Fig. 2
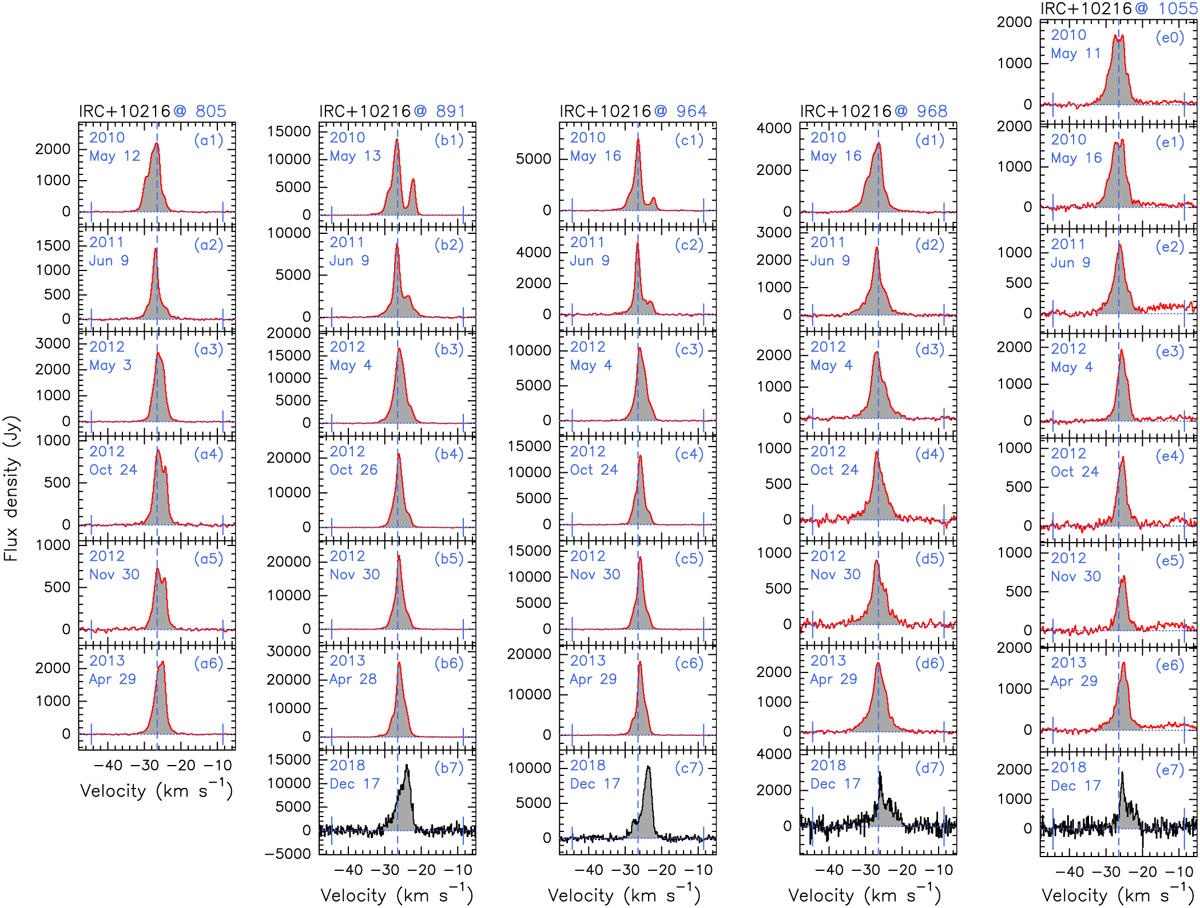
Download original image
Spectra of sub-millimetre HCN laser transitions within the Coriolis-coupled system observed in six to eight epochs towards IRC+10216. Spectra are presented from left to right for the following transitions: (a) the (0,40,0), J = 9−8 line at 805 GHz; (b) the (1,11e,0)–(0,40,0), J = 10−9 line at 891 GHz; (c) the (1,11e,0)−(0,40,0), J = 11−10 line at 964 GHz; (d) the (1,11e,0), J = 11−10 line at 968 GHz; and (e) the (1,1ee,0), J = 12−11 line at 1055 GHz. The Herschel/HIFI spectra are plotted in red, while the SOFIA/4GREAT spectra, smoothed to a channel spacing of ∼0.15 km s−1, are shown in black. The observing dates are labelled in their respective panels. In each panel, the vertical dashed blue line indicates the stellar velocity of −26.5 km s−1, the vertical blue bars mark the terminal velocity of ± 18 km s−1, and the horizontal dotted blue line represents the baseline. The grey-shaded regions indicate the velocity ranges used to determine the integrated intensities.
Current usage metrics show cumulative count of Article Views (full-text article views including HTML views, PDF and ePub downloads, according to the available data) and Abstracts Views on Vision4Press platform.
Data correspond to usage on the plateform after 2015. The current usage metrics is available 48-96 hours after online publication and is updated daily on week days.
Initial download of the metrics may take a while.