| Issue |
A&A
Volume 695, March 2025
|
|
|---|---|---|
| Article Number | L8 | |
| Number of page(s) | 12 | |
| Section | Letters to the Editor | |
| DOI | https://doi.org/10.1051/0004-6361/202553684 | |
| Published online | 11 March 2025 | |
Letter to the Editor
Spectroscopic detection of a 2.9-hour orbit in a long-period radio transient
Department of Astronomy, California Institute of Technology, 1200 E California Blvd, Pasadena, CA 91125, USA
⋆ Corresponding author; This email address is being protected from spambots. You need JavaScript enabled to view it.
Received:
6
January
2025
Accepted:
6
February
2025
Abstract
Long-period radio transients (LPTs) are a mysterious new class of radio transients pulsating on periods of minutes to hours. To date, nine LPTs have been discovered predominantly at low Galactic latitudes, and yet their nature remains unknown. Here I present the first phase-resolved optical spectroscopy of the 2.9 h LPT GLEAM-X J0704–37, acquired with the 10 m Keck I telescope. Radial velocity (RV) shifts of 189 ± 3 km s−1 of an M5-type star in a binary system are detected on a period nearly equal to the radio period. Weak Hα emission is also present, with some of it possibly originating from outside of the M dwarf. Based on the RV amplitude, and assuming a typical M dwarf mass, the companion mass must be M ≥ 0.22 M⊙. Calibrating the spectra with space-based Gaia photometry reveals that the system is nearly four times closer than previously reported, at d ≈ 400 pc, suggesting that more systems could be nearby and amenable to optical characterization. The optical spectrum between 3500–10 000 Åis well modeled by a binary comprised of a massive white dwarf (WD; Teff ≈ 7300 K, M ≈ 0.8 − 1.0 M⊙) and an M dwarf (Teff ≈ 3000 K, M ≈ 0.14 M⊙). Radio pulses arrive when the WD is at nearly maximum blueshift and the M dwarf at nearly maximum redshift, in contrast to what has been reported for a similar LPT, ILT J1101+5521. GLEAM-X J0704–37 is now the second LPT with an orbital period nearly equal to the radio period, establishing a class of LPTs associated with WD + M dwarf binaries; other LPTs are likely related to WD and/or neutron star spins. This work demonstrates that the precise localization of LPTs, which enables optical follow-up, will be key in uncovering the mechanism(s) that power this new class of phenomena.
Key words: binaries: close / pulsars: general / white dwarfs / radio continuum: stars
© The Authors 2025
 Open Access article, published by EDP Sciences, under the terms of the Creative Commons Attribution License (https://creativecommons.org/licenses/by/4.0), which permits unrestricted use, distribution, and reproduction in any medium, provided the original work is properly cited.
This article is published in open access under the Subscribe to Open model. This email address is being protected from spambots. You need JavaScript enabled to view it. to support open access publication.
1. Introduction
Long-period radio transients (LPTs) represent a new era in radio astronomy. Pulsars were the first radio sources discovered to be stably pulsating at ∼1 s timescales (Hewish et al. 1968), and attributed to rotating neutron stars (NSs; Gold 1968; Pacini 1968). Exploring a new range of periodicity has historically proven to be revolutionary in the field. For instance, the discovery of a millisecond pulsar (MSP; Backer et al. 1982) and subsequent studies established the importance of binary interaction in the formation of such rapid rotators (e.g., Phinney & Kulkarni 1994).
Crucially, the association of optical (and other multiwavelength) counterparts with radio sources has proven to be vital for their characterization. Kulkarni (1986) optically identified white dwarf (WD) binary companions to MSPs, establishing both the old age of MSPs and demonstrating that NS magnetic fields do not strictly decay exponentially. In addition, optical spectroscopy of the faint companions to black widow MSPs (Fruchter et al. 1988) with 10 m class telescopes has revealed what may be the most massive NS known to date, placing useful constraints on the NS equation of state (≈2.35M⊙; Romani et al. 2022).
At the time of writing, nine LPTs have been reported1 (in published form or as a preprint), and are summarized in Table 1. Hurley-Walker et al. (2024) reported the discovery of the 2.915 h LPT known as GLEAM-X J0704–37. The radio source was localized using MeerKAT and is associated with a faint (GaiaG ≈ 20.78) optical counterpart at that position. An optical spectrum in that work revealed an M dwarf counterpart, similar to the one seen in the LPT ILT J1101+5521 (de Ruiter et al. 2024). Hurley-Walker et al. (2024) also found a ≈6 yr period in radio timing residuals, and suggested it to be the binary period of a WD + M dwarf system, with the 2.9 h period being the WD spin.
List of the nine known LPTs at the time of writing (reported in published form or as a preprint).
Here I show that GLEAM-X J0704–37 is in fact a compact WD + M dwarf binary, with the 2.9 h radio period matching the orbital period and located only ≈400 pc away. Based on the orbital solution, radio pulses arrive when the WD is nearly at maximum blueshift and M dwarf nearly at maximum redshift.
2. Data
GLEAM-X J0704–37 was observed on two occasions using the Low Resolution Imaging Spectrometer (LRIS; Oke et al. 1995) on the 10 m Keck I telescope on Mauna Kea in Hawai’i. An observing log is provided in Table C.1. All LRIS data were wavelength calibrated with internal lamps, flat-fielded, and cleaned for cosmic rays using lpipe, a pipeline for LRIS optimized for long-slit spectroscopy (Perley 2019). To calculate radial velocities (RVs), the mid-exposure time of all observations was corrected to the barycentric Julian date (BJDTDB).
The spectrum shown in Figure 3 of Hurley-Walker et al. (2024), at λ ≈ 6000 Å, (Fλ ≈ 3 × 10⁻¹⁸ erg s−1 cm−2 Å−1) appears to be nearly four times lower than the value derived from the average Gaia G photometry, Fλ ≈ 1.5 × 10⁻¹⁷ erg s−1 cm−2 Å−1. Here, Gaia Data Release 3 (DR3; Gaia Collaboration 2023) average photometry of the source (Gaia DR3 5566254014771398912) was used to calibrate the overall flux level obtained by spectroscopy. The pyphot package2 was used to calculate synthetic photometry from the average spectrum of Night 2 in the Gaia BP, G, and RP bandpasses. The average spectrum was then multiplied by a correction factor in order to match the synthetic photometry to the Gaia photometry, leading to a smaller inferred distance (≈400 pc) compared to that presented in the discovery paper (≈1500 pc)3.
3. Analysis
3.1. RV fitting and mass constraints on companion star
The radial velocity (RV) measurements traced by the Na I doublet (8183 and 8195 Å) absorption lines in the left panel are shown in the left panel of Figure 1. The full sets of spectra are shown in Figure C.1, and all RV measurements are reported in Table C.2. The orbital phase is set to coincide with the start of observations on Night 2. The gray vertical lines indicate the observed radio pulses (2018-02-04 at 14:57:02, 2023-10-04 at 02:33:02, and 2023-10-04 at 05:29:59 UT) reported by Hurley-Walker et al. (2024), folded on the 10 496 s period, and barycentric-corrected to BJDTDB. Orbital period constraints of 10496 ± 5 s (resp. 10500 ± 500 s) based on RVs from two nights (resp. one night) of data are outlined in Appendix A.1.
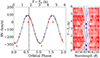 |
Fig. 1. Left: RVs measured using the Na I absorption doublet from Night 1 (blue) and Night 2 (red) folded on a period of 2.915(1) h and plotted with the best RV model (black; KMD = 189 ± 3 km s−1). This shows that the binary orbital period matches the radio pulse period to within 0.05 percent. Radio pulses (gray) occur just after the maximum redshift of the M dwarf, when it is at the ascending node as viewed from Earth. Right: Trailed spectra (Night 2) of the Na I doublet show good agreement with the RV model (black). Two orbital periods are shown for visual aid. |
Equation (1) yields a minimum mass constraint on the companion star:
 (1)
(1)
Assuming an edge-on inclination (i = 90°) and an M dwarf of zero mass, the minimum companion mass is Mcompanion ≥ 0.087 M⊙. Assuming a realistic M dwarf mass of 0.14 M⊙, based on the spectral analysis below, yields Mcompanion ≥ 0.22 M⊙4.
3.2. Hα emission associated with the M dwarf
The origin of the Hα emission is explored by creating a Doppler tomogram5 (Marsh & Horne 1988) in Figure 2 with the doptomog IDL-based code6 (Kotze et al. 2015). The systemic offset of γ = −98.9 km s−1 was applied, and the orbital phases were shifted such that inferior conjunction corresponds to a phase of 90° on the resulting map (e.g., Kotze et al. 2015; Rodriguez et al. 2023). The Roche potentials derived from the inferred masses and system inclination (Table 2) are overlaid, showing the Roche potential of the M dwarf as a solid black teardrop7. The dotted black teardrop is the Roche potential of the companion star. Other markings are related to accreting systems and can be ignored here. The physical geometry mapped onto these coordinates is illustrated in Figures 1 and 3 of Kotze et al. (2015).
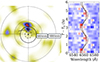 |
Fig. 2. Left: Doppler tomogram of the Hα line revealing > 3σ (red) emission associated with the orbital phase of the M dwarf (Roche potential shown by the solid black teardrop shape). The majority of the emission may originate from outside the M dwarf, with a higher observed velocity. Right: Trailed spectra of the Hα emission line shown alongside the M dwarf RV model (black solid line), and the higher velocity component (black dotted line; K ≈ 330 km s−1). |
All parameters for the GLEAM-X J0704–37 WD + MD binary system.
Figure 2 shows that some Hα emission is coincident with the orbital phase and RV of the donor star (inside the Roche potential), but that the bulk of the Hα emission may originate from a higher velocity region outside of the M dwarf. However, this is only seen in the single orbit of spectra presented here, so further data are needed to confirm the presence of this feature. It may very well turn out that all Hα emission is associated with chromospheric activity of the rapidly rotating M dwarf (e.g., Delfosse et al. 1998). If this higher velocity feature is indeed present, then its velocity corresponds to ≈330 km s−1, as represented by the black dashed curve in the right panel of Figure 2. Details regarding the possible spatial origin of that emission region and resemblance to the post common envelope WD + M dwarf binary QS Vir are discussed in Appendix 3.2.
3.3. Binary parameters
The spectra of GLEAM-X J0704–37 do not reveal any strong emission lines that could be indicative of accretion, suggesting that this system is a detached binary (M dwarf + companion). Because there is a detection of a blue continuum (shortward of 5500 Å) above the noise, I proceeded with the assumption that the companion star is a white dwarf (WD), also adopted by Hurley-Walker et al. (2024) based on radio pulse arguments. Further arguments against a NS + M dwarf binary are put forth in Appendix A.3.
Proceeding with this assumption, the average spectrum can be described by six parameters, only four of which are independent: the WD effective temperature and radius, TWD and RWD; the M dwarf effective temperature and radius, TMD and RMD; the distance to the system, d; and the reddening to the system, E(B − V). TMD and RMD are related though the M dwarf isochrones (assuming an age of 10 Gyr) of Baraffe et al. (2015); d and E(B − V) are related through the 3D dust map of Edenhofer et al. (2024). Other dust maps infer slightly different levels of extinction, explored further in Appendix E. The four independent parameters were constrained using a Markov chain Monte Carlo (MCMC) parameter exploration, described in complete detail in Appendix A.2. The resulting parameters are credible intervals, and are shown in Table 2.
In Figure 3 the average spectrum (rectified using Gaia photometry), both Gaia and synthetic photometry, and the model obtained from the parameters in Table 2 are shown. The residuals do not show any obvious systematic biases across the entire 3500–10 000 Å range, aside from features related to telluric subtraction and the Hα emission feature at 6563 Å.
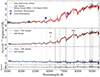 |
Fig. 3. Top: Average spectrum of GLEAM-X J0704–37 (black) well fit by a WD + MD binary model (red; parameters in Table 2). The overall flux level was calibrated by matching synthetic photometry (squares), generated from the spectrum, with Gaia average photometry (circles). Middle: Each binary component provides a good fit to the data when the other is subtracted. Bottom: Residuals show no obvious systematic disagreement, aside from the Hα emission and telluric features (gray bands). |
The largest uncertainty in the above analysis is the extinction to the system; assuming higher extinction values leads to a larger WD radius (meaning lower mass). The WD in this system, however, is clearly massive, since it is unlikely for the extinction to exceed E(B − V) = 0.3 (see Appendix E). Assuming this leads to a WD mass of 0.82 M⊙, lower than that presented in Table 2, but still more massive compared to typical single WDs in the field (0.6 M⊙, 0.7 M⊙ for DA and DB WDs; Kepler et al. 2007) or WDs in post common envelope binaries (0.67 ± 0.21 M⊙; Zorotovic et al. 2011).
4. Discussion
4.1. A detached WD + M dwarf close binary
I have shown that the optical spectrum of GLEAM-X J0704–37 is well modeled by that of a detached (non-accreting) WD + MD binary with an orbital period of 10 496 ± 5 s (2.915 h), which agrees with the radio period (10 496.5522) to within 0.05 percent (to within 5 percent at worst if only fitting RVs from Night 2). This allows us to discard a scenario put forth by Hurley-Walker et al. (2024), where the 2.9 h period was attributed to a NS or WD spin period in a ≈6 yr orbital period with an M dwarf8.
4.2. Connections to ILT J1101+5521, WD pulsars, and cataclysmic variables
GLEAM-X J0704–37 bears a strong similarly to another LPT, ILT J1101+5521 (de Ruiter et al. 2024). They both host a cool massive WD (≈7300 K and ≈5500 K; ≈1.02 M⊙ and ≈0.77 M⊙, respectively). They are both WD + M dwarf binaries, pulsing in the radio on a similar nearly equal to the orbit. WD pulsars (which are also radio emitting detached WD + M dwarf systems, but host a magnetic WD spinning and radio pulsing on 2–5 min timescales, but in a 3.5–4 h orbit) are another class of similar radio sources, though over an order of magnitude less radio luminous than LPTs Marsh et al. (2016), Pelisoli et al. (2022). All of these systems highlight the unexpected diversity of radio activity and emission processes associated with otherwise common detached WD + M dwarf binaries. These systems, including GLEAM-X J0704–37, will eventually begin mass transfer and become cataclysmic variables (CVs; Warner 1995; Hellier 2001). Magnetic braking in some form (e.g., Rappaport et al. 1983; El-Badry et al. 2022) and gravitational wave radiation will drive the binary closer together, with accretion commencing in a few gigayears (e.g., Knigge et al. 2011). An extended discussion on the above points is presented in Appendix B.
5. Conclusions
I conducted the first phase-resolved spectroscopic observations of GLEAM-X J0704–37, an LPT pulsing on a 2.915 h period. The main conclusions are as follows:
-
RV shifts (189 ± 3 km s−1) of the Na I doublet show that the binary orbital period (10 496 ± 5 s) agrees with the 10496.5522 s radio pulse period to within 5 (0.05) percent, fitting spectra from one (both) night(s) (Figure 1).
-
Radio pulses nearly coincide with the ascending node of the orbit when the M dwarf is at maximum redshift and WD at maximum blueshift (Figure 1). This differs from what has been reported in ILT J1101+5521, where radio pulses arrive near binary conjunction.
-
The average spectrum is well fit by the sum of a ≈3000 K, ≈0.14 M⊙ M dwarf and a massive ≈7300 K, ≈0.8–1.0 M⊙ white dwarf (Figure 3; Table 2).
-
Weak Hα emission is seen; some is attributed to the M dwarf, though some appears to be localized to a region outside the M dwarf that coincides with it in orbital phase, but orbits at a higher velocity of ≈330 kms−1 (Figure 2).
-
GLEAM-X J0704–37 (≈400 pc) is nearly four times closer than previously thought (≈1500 pc), suggesting that such systems may be relatively common.
-
I propose that GLEAM-X J0704–37, along with ILT J1101+5521, are part of a class of LPTs that are associated with WD binary orbits, while other LPTs are likely associated with WD or NS spins.
This work demonstrates the importance of multiwavelength follow-up in characterizing LPTs: optical spectroscopy has now revealed a class of LPTs associated with WD + M dwarf close binaries (this work; Hurley-Walker et al. 2024; de Ruiter et al. 2024), and X-ray pulsations along with a spatial association with a supernova remnant has tentatively connected another LPT to NS or WD spins (Wang et al. 2024; Li et al. 2024). Optical follow-up remains difficult, requiring the biggest telescopes in the world (10 m class) to adequately characterize the optical counterparts. Ongoing searches for new LPTs may discover closer sources or reveal them to be an intrinsically distant rare class of objects, in either case shining light on this exciting new phenomenon.
PSR J0901-4046 is an ultra-long-period pulsar (not considered here to be an LPT) that has been established to be a neutron star with a 76 s period (Caleb et al. 2022).
Curiously, the nearer distance agrees with that derived from the radio dispersion measure using the electron density model of Yao et al. (2017), as reported in the discovery paper.
It has been found in M dwarfs in close binaries that the Na I doublet may trace the back of the star, leading to the need for a correction to the RV amplitude of at most ≈ − 15 km s−1 (e.g., Wade & Horne 1988). This would imply a minimum companion mass of 0.068 M⊙ and 0.20 M⊙, assuming an M dwarf mass of zero and 0.14 M⊙, respectively.
A Doppler tomogram, in polar coordinates, shows RV shift as the radial coordinate and orbital phase as the azimuthal coordinate. Doppler maps are commonly used in the cataclysmic variable (CV) literature to disentangle emission from the donor star and accretion-related components, though they are also useful for detached binaries; see Marsh et al. (2001) for a review of the method of Doppler tomography.
Typically, in the CV literature, this also represents the actual shape of the star since it fills its Roche lobe in such systems. That is, however, not the case here since the M dwarf in GLEAM-X J0704–37 does not fill its Roche lobe.
A faint third body could still be present in the system orbiting on a 6 yr period. Recent discoveries in close compact object binaries have revealed the presence and evolutionary impact of distant triples (Burdge et al. 2024; Shariat et al. 2024). At the same time timing residuals of approximately a few years seen in CVs have been attributed to magnetic activity in the low-mass companion star (Souza & Baptista 2024). Both scenarios warrant further investigation to explain the radio timing residuals.
Other periods were reported by Hurley-Walker et al. (2024), differing by at most 0.002 s. The current observing baseline yields a level of precision (5 s) which is consistent with all possible periods in Hurley-Walker et al. (2024).
Other works have also noted this distinction, though the relation to the CV period minimum has not been put forth.
An interesting exception to this are hydrogen-rich donor stars with low metallicities, which can reach even shorter orbital periods (Stehle et al. 1997).
AM CVn binaries and ultra-compact X-ray binaries (UCXBs) are examples of systems where donor stars dominated by helium and heavier elements orbit WDs and NSs, respectively, at periods below this minimum (e.g., Nelemans et al. 2010).
Acknowledgments
I thank Shri Kulkarni and Kareem El-Badry for a close reading of this paper and valuable feedback. I also thank the referee for constructive input that improved the final manuscript. I acknowledge support from an NSF Graduate Student Fellowship. I also thank Matthew Graham and Ilaria Caiazzo for obtaining an early spectrum that demonstrated the feasibility of this campaign and for assistance with observations, respectively. I thank the organizers and attendees of the XMM-Newton “The X-ray Mysteries of Neutron Stars and White Dwarfs” Conference, including Natasha Hurley-Walker and Ingrid Pelisoli, for alerting me to the discovery of LPTs and to Myles Sherman, Casey Law, and the Caltech LPT Group for interesting discussions on related objects. I am grateful to the staff of Keck Observatory for their support in carrying out the observations presented here. Some of the data presented herein were obtained at Keck Observatory, which is a private 501(c)3 non-profit organization operated as a scientific partnership among the California Institute of Technology, the University of California, and the National Aeronautics and Space Administration. The Observatory was made possible by the generous financial support of the W. M. Keck Foundation. I wish to recognize and acknowledge the very significant cultural role and reverence that the summit of Maunakea has always had within the Native Hawaiian community. We are most fortunate to have the opportunity to conduct observations from this mountain.
References
- Allard, F., Homeier, D., & Freytag, B. 2011, in 16th Cambridge Workshop on Cool Stars, Stellar Systems, and the Sun, eds. C. Johns-Krull, M. K. Browning, & A. A. West, ASP Conf. Ser., 448, 91 [Google Scholar]
- Backer, D. C., Kulkarni, S. R., Heiles, C., Davis, M. M., & Goss, W. M. 1982, Nature, 300, 615 [NASA ADS] [CrossRef] [Google Scholar]
- Bailer-Jones, C. A. L., Rybizki, J., Fouesneau, M., Mantelet, G., & Andrae, R. 2018, AJ, 156, 58 [Google Scholar]
- Bailer-Jones, C. A. L., Rybizki, J., Fouesneau, M., Demleitner, M., & Andrae, R. 2021, AJ, 161, 147 [Google Scholar]
- Baraffe, I., Homeier, D., Allard, F., & Chabrier, G. 2015, A&A, 577, A42 [NASA ADS] [CrossRef] [EDP Sciences] [Google Scholar]
- Bédard, A., Bergeron, P., Brassard, P., & Fontaine, G. 2020, ApJ, 901, 93 [Google Scholar]
- Buckley, D. A. H., Meintjes, P. J., Potter, S. B., Marsh, T. R., & Gänsicke, B. T. 2017, Nat. Astron., 1, 0029 [NASA ADS] [CrossRef] [Google Scholar]
- Burdge, K. B., El-Badry, K., Kara, E., et al. 2024, Nature, 635, 316 [NASA ADS] [CrossRef] [Google Scholar]
- Caleb, M., Heywood, I., Rajwade, K., et al. 2022, Nat. Astron., 6, 828 [NASA ADS] [CrossRef] [Google Scholar]
- Caleb, M., Lenc, E., Kaplan, D. L., et al. 2024, Nat. Astron., 8, 1159 [NASA ADS] [CrossRef] [Google Scholar]
- Cordes, J. M. 2004, in Milky Way Surveys: The Structure and Evolution of our Galaxy, eds. D. Clemens, R. Shah, & T. Brainerd, ASP Conf. Ser., 317, 211 [NASA ADS] [Google Scholar]
- Delfosse, X., Forveille, T., Perrier, C., & Mayor, M. 1998, A&A, 331, 581 [NASA ADS] [Google Scholar]
- de Ruiter, I., Rajwade, K. M., Bassa, C. G., et al. 2024, arXiv e-prints [arXiv:2408.11536] [Google Scholar]
- Dong, F. A., Clarke, T., Curtin, A. P., et al. 2024, arXiv e-prints [arXiv:2407.07480] [Google Scholar]
- Edenhofer, G., Zucker, C., Frank, P., et al. 2024, A&A, 685, A82 [NASA ADS] [CrossRef] [EDP Sciences] [Google Scholar]
- Eggleton, P. P. 1983, ApJ, 268, 368 [Google Scholar]
- El-Badry, K., Conroy, C., Fuller, J., et al. 2022, MNRAS, 517, 4916 [NASA ADS] [CrossRef] [Google Scholar]
- Faulkner, J. 1971, ApJ, 170, L99 [NASA ADS] [CrossRef] [Google Scholar]
- Foreman-Mackey, D., Farr, W., Sinha, M., et al. 2019, The J. Open Source Software, 4, 1864 [NASA ADS] [CrossRef] [Google Scholar]
- Fruchter, A. S., Stinebring, D. R., & Taylor, J. H. 1988, Nature, 333, 237 [Google Scholar]
- Gaia Collaboration (Vallenari, A., et al.) 2023, A&A, 674, A1 [NASA ADS] [CrossRef] [EDP Sciences] [Google Scholar]
- Gänsicke, B. T., Dillon, M., Southworth, J., et al. 2009, MNRAS, 397, 2170 [NASA ADS] [CrossRef] [Google Scholar]
- Gelman, A., & Rubin, D. B. 1992, Stat. Sci., 7, 457 [Google Scholar]
- Ginzburg, S., Fuller, J., Kawka, A., & Caiazzo, I. 2022, MNRAS, 514, 4111 [NASA ADS] [CrossRef] [Google Scholar]
- Gold, T. 1968, Nature, 218, 731 [NASA ADS] [CrossRef] [Google Scholar]
- Hastings, W. K. 1970, Biometrika, 57, 97 [Google Scholar]
- Hellier, C. 2001, Cataclysmic Variable Stars (Springer) [Google Scholar]
- Hewish, A., Bell, S. J., Pilkington, J. D. H., Scott, P. F., & Collins, R. A. 1968, Nature, 217, 709 [NASA ADS] [CrossRef] [Google Scholar]
- Hurley-Walker, N., Zhang, X., Bahramian, A., et al. 2022, Nature, 601, 526 [NASA ADS] [CrossRef] [Google Scholar]
- Hurley-Walker, N., Rea, N., McSweeney, S. J., et al. 2023, Nature, 619, 487 [NASA ADS] [CrossRef] [Google Scholar]
- Hurley-Walker, N., McSweeney, S. J., Bahramian, A., et al. 2024, ApJ, 976, L21 [NASA ADS] [CrossRef] [Google Scholar]
- Hyman, S. D., Lazio, T. J. W., Kassim, N. E., et al. 2005, Nature, 434, 50 [NASA ADS] [CrossRef] [Google Scholar]
- Kepler, S. O., Kleinman, S. J., Nitta, A., et al. 2007, MNRAS, 375, 1315 [NASA ADS] [CrossRef] [Google Scholar]
- Knigge, C., Baraffe, I., & Patterson, J. 2011, ApJS, 194, 28 [Google Scholar]
- Koester, D. 2010, Mem. Soc. Astron. Italiana, 81, 921 [NASA ADS] [Google Scholar]
- Kotze, E. J., Potter, S. B., & McBride, V. A. 2015, A&A, 579, A77 [NASA ADS] [CrossRef] [EDP Sciences] [Google Scholar]
- Kulkarni, S. R. 1986, ApJ, 306, L85 [NASA ADS] [CrossRef] [Google Scholar]
- Lallement, R., Vergely, J. L., Babusiaux, C., & Cox, N. L. J. 2022, A&A, 661, A147 [NASA ADS] [CrossRef] [EDP Sciences] [Google Scholar]
- Lee, Y. W. J., Caleb, M., Murphy, T., et al. 2025, Nat. Astron., submitted [Google Scholar]
- Li, D., Yuan, M., Wu, L., et al. 2024, arXiv e-prints [arXiv:2411.15739] [Google Scholar]
- Marsh, T. R. 2001, in Astrotomography, Indirect Imaging Methods in Observational Astronomy, eds. H. M. J. Boffin, D. Steeghs, & J. Cuypers, 573, 1 [NASA ADS] [CrossRef] [Google Scholar]
- Marsh, T. R., & Horne, K. 1988, MNRAS, 235, 269 [Google Scholar]
- Marsh, T. R., Gänsicke, B. T., Hümmerich, S., et al. 2016, Nature, 537, 374 [NASA ADS] [CrossRef] [Google Scholar]
- Nelemans, G., Yungelson, L. R., van der Sluys, M. V., & Tout, C. A. 2010, MNRAS, 401, 1347 [NASA ADS] [CrossRef] [Google Scholar]
- Oke, J. B., Cohen, J. G., Carr, M., et al. 1995, PASP, 107, 375 [Google Scholar]
- Pacini, F. 1968, Nature, 219, 145 [NASA ADS] [CrossRef] [Google Scholar]
- Paczynski, B. 1981, Acta Astron., 31, 1 [NASA ADS] [Google Scholar]
- Pala, A. F., Gänsicke, B. T., Breedt, E., et al. 2020, MNRAS, 494, 3799 [Google Scholar]
- Parsons, S. G., Hill, C. A., Marsh, T. R., et al. 2016, MNRAS, 458, 2793 [NASA ADS] [CrossRef] [Google Scholar]
- Parsons, S. G., Gänsicke, B. T., Marsh, T. R., et al. 2018, MNRAS, 481, 1083 [Google Scholar]
- Pelisoli, I., Marsh, T. R., Parsons, S. G., et al. 2022, MNRAS, 516, 5052 [NASA ADS] [CrossRef] [Google Scholar]
- Pelisoli, I., Marsh, T. R., Buckley, D. A. H., et al. 2023, Nat. Astron., 7, 931 [NASA ADS] [CrossRef] [Google Scholar]
- Pelisoli, I., Chomiuk, L., Strader, J., et al. 2024, MNRAS, 531, 1805 [NASA ADS] [CrossRef] [Google Scholar]
- Perley, D. A. 2019, PASP, 131, 084503 [Google Scholar]
- Phinney, E. S., & Kulkarni, S. R. 1994, ARA&A, 32, 591 [NASA ADS] [CrossRef] [Google Scholar]
- Qu, Y., & Zhang, B. 2024, arXiv e-prints [arXiv:2409.05978] [Google Scholar]
- Ramsay, G., Green, M. J., Marsh, T. R., et al. 2018, A&A, 620, A141 [NASA ADS] [CrossRef] [EDP Sciences] [Google Scholar]
- Rappaport, S., Verbunt, F., & Joss, P. C. 1983, ApJ, 275, 713 [Google Scholar]
- Ribeiro, T., Kafka, S., Baptista, R., & Tappert, C. 2010, AJ, 139, 1106 [NASA ADS] [CrossRef] [Google Scholar]
- Ridder, M. E., Heinke, C. O., Sivakoff, G. R., & Hughes, A. K. 2023, MNRAS, 519, 5922 [NASA ADS] [CrossRef] [Google Scholar]
- Ritter, H., & Kolb, U. 2003, A&A, 404, 301 [NASA ADS] [CrossRef] [EDP Sciences] [Google Scholar]
- Rodriguez, A. C., Kulkarni, S. R., Prince, T. A., et al. 2023, ApJ, 945, 141 [NASA ADS] [CrossRef] [Google Scholar]
- Rodriguez, A. C., El-Badry, K., Hakala, P., et al. 2025a, arXiv e-prints [arXiv:2501.01490] [Google Scholar]
- Rodriguez, A. C., El-Badry, K., Suleimanov, V., et al. 2025b, PASP, 137, 014201 [NASA ADS] [CrossRef] [Google Scholar]
- Romani, R. W., Kandel, D., Filippenko, A. V., Brink, T. G., & Zheng, W. 2022, ApJ, 934, L17 [NASA ADS] [CrossRef] [Google Scholar]
- Schlafly, E. F., & Finkbeiner, D. P. 2011, ApJ, 737, 103 [Google Scholar]
- Schreiber, M. R., Belloni, D., Gänsicke, B. T., Parsons, S. G., & Zorotovic, M. 2021, Nat. Astron., 5, 648 [NASA ADS] [CrossRef] [Google Scholar]
- Schreiber, M. R., Belloni, D., & Schwope, A. D. 2024, A&A, 682, L7 [NASA ADS] [CrossRef] [EDP Sciences] [Google Scholar]
- Schwope, A. D., Horne, K., Steeghs, D., & Still, M. 2011, A&A, 531, A34 [NASA ADS] [CrossRef] [EDP Sciences] [Google Scholar]
- Shariat, C., Naoz, S., El-Badry, K., et al. 2024, arXiv e-prints [arXiv:2411.15644] [Google Scholar]
- Souza, L., & Baptista, R. 2024, ApJ, 972, 33 [NASA ADS] [CrossRef] [Google Scholar]
- Spruit, H. C., & Ritter, H. 1983, A&A, 124, 267 [NASA ADS] [Google Scholar]
- Stanway, E. R., Marsh, T. R., Chote, P., et al. 2018, A&A, 611, A66 [NASA ADS] [CrossRef] [EDP Sciences] [Google Scholar]
- Stehle, R., Kolb, U., & Ritter, H. 1997, A&A, 320, 136 [NASA ADS] [Google Scholar]
- Wade, R. A., & Horne, K. 1988, ApJ, 324, 411 [Google Scholar]
- Walter, F. M., & Matthews, L. D. 1997, Nature, 389, 358 [NASA ADS] [CrossRef] [Google Scholar]
- Wang, Z., Rea, N., Bao, T., et al. 2024, arXiv e-prints [arXiv:2411.16606] [Google Scholar]
- Warner, B. 1995, Cataclysmic Variable Stars, 28 [Google Scholar]
- Yao, J. M., Manchester, R. N., & Wang, N. 2017, ApJ, 835, 29 [NASA ADS] [CrossRef] [Google Scholar]
- Zorotovic, M., Schreiber, M. R., & Gänsicke, B. T. 2011, A&A, 536, A42 [NASA ADS] [CrossRef] [EDP Sciences] [Google Scholar]
- Zorotovic, M., Schreiber, M. R., Parsons, S. G., et al. 2016, MNRAS, 457, 3867 [Google Scholar]
Appendix A: Extended analysis: Parameter constraints
A.1. Orbital solution
Radial velocities are obtained by cross-correlating a 50Å window around the Na I doublet with an M5 template from the BT-DUSTY library of theoretical spectral atmospheres (Allard et al. 2011). The RVs are fit to Equation A.1 using data from both Night 1 and 2 simultaneously, assuming a circular orbit (e = 0):
 (A.1)
(A.1)
Here MD stands for M dwarf, RV is an individual RV, K is the RV curve amplitude, ϕ is the orbital phase, ϕ0 sets the zero-point of the orbit (inferior conjunction), and γ is the systemic velocity. To constrain the parameter values, a Markov chain Monte Carlo (MCMC) parameter exploration (Hastings 1970) was performed using the emcee package (Foreman-Mackey et al. 2019); the ensemble sampler was run with twelve walkers for 10,000 runs, taking the first half as the burn-in period. Table 2 shows the credible intervals of all parameters, with the most relevant being KMD = 189 ± 3kms−1.
To calculate orbital phases, the period was first fixed to be equal to the radio period reported by Hurley-Walker et al. (2024) of 10496.5522 s9. Phases were recalculated based on different candidate orbital periods in the range of 2.8 to 3 h and evaluated the fit to the RV solution derived above. This Monte Carlo trial constrained the orbital period to be P = 10496 ± 5 s. However, since the total number of orbital cycles that transpired between Night 1 and 2 are unknown, performing the above analysis on the Night 2 data lone yields a more conservative error of P = 10500 ± 500 s. Both analyses are consistent with the radio period to within one sigma.
A.2. Binary parameters
To create an M dwarf model, TMD is specified, interpolating through the BT-DUSTY library of theoretical stellar atmospheres (Allard et al. 2011), assuming solar metallicity and log g = 5.0. An inflation factor of 10% is adopted for the radius of the M dwarf, as it has been shown that for binaries this close, fast rotation leads to increased magnetic activity and thus inflation (Parsons et al. 2018). The stellar atmosphere is multiplied by (RMD/d)2 to obtain a flux as viewed from Earth. The same process is used for the WD, taking the theoretical (DA; H-rich) WD atmospheres of (Koester 2010) and assuming log g = 8.0.
A Markov chain Monte Carlo (MCMC) parameter exploration was performed using the emcee package (Foreman-Mackey et al. 2019) to explore all four simultaneously, adopting uniform priors on all parameters: 5000 < TWD (K) < 12000, 2500 < TMD (K) < 4000, 0.008 < RWD (R⊙) < 0.02, 250 < d (pc) < 1000. The MCMC sampler was run for 2000 steps, taking half as the burn-in period. The parameter exploration converged, with a Gelman-Rubin statistic ( ; Gelman & Rubin 1992) of 1.08 averaged over all chains. Gelman & Rubin (1992) argue that values close to 1, with
  being a typical threshold, indicate convergence for typical multivariate distributions. The corner plot and marginalized posterior distributions are shown in Figure E1.
In Table 2, the inferred binary parameters (median values and credible intervals: 16th and 84th percentiles of the posterior distributions) resulting from the MCMC analysis are shown. MWD is obtained from the mass-radius relation of Bédard et al. (2020); MMD, from the M dwarf isochrones (assuming an age of 10 Gyr) of Baraffe et al. (2015), assuming solar metallicity. The binary separation, a, and inclination, i, are solved for using Kepler’s laws, and the M dwarf Roche lobe filling factor, RMD/RL, (i.e., how much of its Roche lobe is filled), is solved for using the Eggleton (1983) relation
 (A.2)
(A.2)
where q = MMD/MWD is the mass ratio of the two objects.
A.3. GLEAM-X J0704–37: WD or NS?
It is unlikely that the primary companion star to the M dwarf could be anything other than a WD. No main sequence star could fit in so compact an orbit. I speculate that in order to produce strong radio emission, the WD must be magnetic. Two known WD pulsars indeed host magnetic WDs in a 3–4 h orbits with an M dwarf (Marsh et al. 2016; Pelisoli et al. 2023) and are discussed further in Section B. A NS is disfavored, since the blue excess (shortward of ≈6500 Å) in the average optical spectrum would require a exceptionally young and nearby NS to be so optically bright (e.g., Walter & Matthews 1997). Being so nearby, such a NS would also be detectable in X-rays, which has been ruled out (Hurley-Walker et al. 2024).
Appendix B: Extended discussion: Connections to cataclysmic variables and white dwarf pulsars
B.1. Comparison to ILT J1101+5521: Cool and massive WDs
The discovery of ILT J1101+5521 was reported by de Ruiter et al. (2024) as an LPT with a radio pulse period of 125.5195 min (2.0912 h). Optical spectroscopy of ILT J1101+5521 revealed an M dwarf with RV variability on a very similar period (127.4 min). It is likely that ILT J1101+5521 is indeed a detached WD + MD binary, as suggested by de Ruiter et al. (2024), though absolute confirmation of this model requires spectroscopic observations over the entire period. Furthermore, both systems host rather cool, massive WDs: ≈7,300 K and ≈5,500 K; ≈1.02M⊙ and ≈0.77M⊙ for GLEAM-X J0704–37 and ILT J1101+5521, respectively. The WD in both systems appears to be more massive than the average isolated DA (hydrogen-atmosphere) and DB (helium-atmosphere) WDs: 0.6M⊙ and 0.7M⊙, respectively (Kepler et al. 2007).
At the time of writing, the origin of radio pulses in LPTs has not been established, though a scenario for ILT J1101+5521 has been put forth (Qu & Zhang 2024). In that model, electron cyclotron maser emission is responsible for the radio emission, requiring that the WD be strongly magnetic (B≈ MG) and the M dwarf only mildly so (B≈ kG). A similar situation could be the case for GLEAM-X J0704–37, though direct evidence for the magnetic nature of the WD (in either system) has not been established.
B.2. Connection to CVs and the period gap
Cataclysmic variables are mass-transferring systems in which a WD accretes from a Roche lobe-filling donor, typically a late-type star (e.g., Warner 1995; Hellier 2001). Magnetic CVs host a WD with a magnetic field strong enough so that the magnetosphere extends well past the WD surface and affects the accretion flow; recently, optical and X-ray surveys have revealed that 35–36% of CVs are magnetic Pala et al. (2020); Rodriguez et al. (2025b).
CVs typically have orbital periods in the range of ≈78 min–10 h, with an observed (though highly debated) period gap between 2.2–3.2 h (e.g., Spruit & Ritter 1983; Schreiber et al. 2024). It is believed that changes in the convective nature of the M dwarf donor star cause magnetic braking to become less efficient and accretion to temporarily stop (Spruit & Ritter 1983). This has been supported by a higher observed rate of detached WD + M dwarf binaries in this period range (Zorotovic et al. 2016). The overlap of both GLEAM-X J0704–37 and ILT J1101+5521 with the CV period gap is exciting (Figure B.1), and may indicate that detached magnetic WD + M dwarf binaries in this orbital period range can exhibit a rich variety of radio activity. However, it may very well be the case that GLEAM-X J0704–37 has never undergone accretion, and is instead a post common envelope binary that will eventually become a CV (pre-CV). This is supported by the extremely low WD temperature, which may not have enough time to cool while crossing the gap (∼1 Gyr), but would after emerging from common envelope (∼ several Gyr).
B.3. LPTs, WD pulsars, and evolutionary links
A connection between LPTs and so-called WD “pulsars” has been made by both Hurley-Walker et al. (2024) and de Ruiter et al. (2024) regarding GLEAM-X J0704–37 and ILT J1101+5521. The two known WD pulsars, AR Sco and J191213.72–441045.1 (henceforth J1912), show pulsed emission at radio frequencies at 1.97 and 5.30 min, respectively (Marsh et al. 2016; Pelisoli et al. 2023). Those periods are not the binary orbital period of the system, which are instead 3.56 and 4.03 h for AR Sco and J1912, respectively (Marsh et al. 2016; Pelisoli et al. 2023). The emission mechanism in WD pulsars is unclear, with it currently being debated whether synchrotron or cyclotron dominates (Buckley et al. 2017; Stanway et al. 2018). Unlike typical NS pulsars, it is thought that radio emission is generated through particle acceleration in the interaction between the WD and M dwarf magnetospheres (Marsh et al. 2016; Pelisoli et al. 2023). Phenomenologically, there are two major differences between WD pulsars and long LPTs:
-
Pulse periods in WD pulsars are shorter, and associated with WD spin periods. In WD pulsars, radio pulses are associated with the spin-orbit beat between the WD spinning at min-long timescales and several hour-long orbits.
-
Pulses in WD pulsars are 10–100 times fainter. AR Sco and J1912 have peak radio luminosities of ≈2 × 1026ergs−1 at ≈1 GHz. GLEAM-X J0704–37 has a radio luminosity of ≈1.5 × 1028ergs−1 (at 1 GHz, adopting a distance of 400 pc in Equation 1 of Hurley-Walker et al. (2024)), and ILT J1101+5521 has a typical peak radio luminosity of 2 × 1027ergs−1 with the highest peak reaching 1 × 1028ergs−1 (both at 100 MHz).
I put forth the possibility that long LPTs represent a phase between WD pulsars and polars. Polars are the most abundant magnetic CVs (e.g., Pala et al. 2020; Rodriguez et al. 2025b), and typically have orbital periods below the period gap, in the 1.3–2.2 h regime (e.g., Warner 1995; Hellier 2001. WD pulsars are detached, with the Roche lobe filling factor (RMD/RL) in AR Sco having been measured to be ≈0.8 Pelisoli et al. (2022). Since (Pelisoli et al. 2022) also detected that the WD in AR Sco is spinning down (to longer spin periods), WD pulsars may evolve into long LPTs. Magnetic braking in some form (e.g., Rappaport et al. 1983; Knigge et al. 2011; El-Badry et al. 2022) by the M dwarf will then lead it to fill its Roche lobe. At this point, accretion will commence and the system will be a polar Alternatively, accretion could commence before the WD fully spins down, which is consistent with the recent finding of a magnetic CV with a polar-like magnetic field, though with a WD spinning at 9.36 min (Rodriguez et al. 2025a).
This is qualitatively similar to the picture put forth by Schreiber et al. (2021), further explored by Ginzburg et al. (2022), where WD pulsars are thought to evolve into polars. The WD magnetic field in this evolutionary model is thought to emerge as a result of crystallization in the WD core, which is more easily achieved in cool, massive WDs. Comparing to Figure 2 of Schreiber et al. (2021), it is clear that both the WD in in GLEAM-X J0704–37 and that in ILT J1101+5521 are cool and massive enough to be at least somewhat crystallized. Optical polarimetry of GLEAM-X J0704–37 should be undertaken in order to assess the magnetic nature of the WD.
Finally, it could be that GLEAM-X J0704–37 and ILT J1101+5521 may be progenitors to magnetic CVs (post common envelope binaries) that have not yet experienced mass transfer. Their unusually cool WD temperatures are significantly cooler than those of WDs in a sample of detached WD + M dwarf binaries in this period range (Teff; WD ≳ 10, 000 K; Zorotovic et al. 2016), and may favor this scenario.
B.4. An emerging picture: Two classes of LPTs
I amplify the idea that there are two classes of LPTs: short (P ≲ 78 min) and long’ (P ≳ 78 min).10 The dividing line between the two types in Figure B.1 is the CV orbital period minimum of ≈78 min (e.g., Hellier 2001). Samples of CVs and AM CVns are shown in Figure B.1, drawn from the catalogs of Ritter & Kolb (2003) and Ramsay et al. (2018), respectively. However, there are two major caveats: 1) it is obvious that GCRT J1745-3009 is effectively on that line, and 2) the recent discovery of ASKAP J183950.5-075635.0 and its likely association with a NS spin reveals that long LPTs are not exclusively WD binaries. I primarily argue that long LPTs can be plausibly associated with orbital periods, but not short LPTs.
For any mass-transferring system with a main-sequence star as the donor, ≈78 min is the minimum orbital period at which hydrogen burning on the donor star can be sustained (Faulkner 1971; Paczynski 1981; Gänsicke et al. 2009). In other words, any binary system with an orbital period lower than this value cannot have a hydrogen-rich donor star.11 Due to angular momentum losses (from magnetic braking and gravitational wave radiation), long LPTs such as GLEAM-X J0704–37 will commence accretion near the orbital period minimum, and then “bounce” back to longer periods as CVs do (e.g., Knigge et al. 2011), meaning they will not overlap with the population of short LPTs.
Based on this, I suggest that in general, long LPTs are associated with WD binary orbital periods, and short LPTs with compact object (WD or NS) spin periods. Short LPTs may still be associated with orbital periods of binary systems, but unlikely with those in which the lower mass component is hydrogen rich.12 The lack of optical counterparts in short LPTs would instead point to a spin period of an optically faint WD or NS.
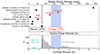 |
Fig. B.1. Two of the three “long LPTs” (P≳ 78 min) are associated with orbital periods of WD + MD binaries, while “short LPTs” (P≲ 78 min) generally lack optical counterparts. The ≈78 min division (black line) corresponds to the orbital period minimum of any binary containing a Roche lobe-filling H-rich donor star, seen in the observed period distribution of CVs. The recent discovery of ASKAP J183950.5-075635.0 and its likely association with an NS spin suggests that “long LPTs” are not exclusively associated with WD orbits. Two of the three known “long LPTs” nearly coincide with the CV “period gap”, where accretion is thought to temporarily shut off (blue band). |
Appendix C: Full spectra and RVs
Individual spectra from Night 1 and 2 are shown in Figure C.1 with observing logs in Table C.1. All spectra are dominated by TiO molecular bandheads, characteristic of M dwarfs, as first revealed in the discovery paper by Hurley-Walker et al. (2024). I detect a clear Na I doublet (8183 and 8195 Å) in absorption in all spectra, not seen in the original discovery paper due to wavelength constraints of the spectroscopic setup. I also detect weak Hα, which was not reported in the discovery paper, demonstrating the advatage of spectroscopy from 10 m class telescopes. The K I doublet (7665 and 7699Å) is also seen in the spectrum, and yield an RV solution that is consistent with that of fitting the Na I doublet alone. However, the K I doublet is excluded from this analysis since it overlaps significantly with airmass-dependent telluric features that can alter the wavelength solution. No other obvious emission or absorption features are present.
Even in the 1.3 h total observation from Night 1, radial velocity (RV) variations of the Na I doublet from the M dwarf are clearly seen. The measured RVs and ensuring MCMC parameter exploration of the RV model (Equation A.1) are presented in Table C.2 and Figure C2, respectively. The 3 h total observation from Night 2 shows the entire RV curve filled out, although by shallower Na I absorption lines, likely due to the presence of high clouds on that night. Some features in the red spectra of the second night could be attributed to cosmic rays or poor telluric subtraction, but are shown here for full transparency, namely the apparent emission feature at ≈6650–6670Å in the first and seventh spectra of Night 2. Follow-up observations should confirm or refute the presence of such features.
Keck I/LRIS observation log of GLEAM-X J0704–37. The blue (red) side was binned at 2x2 (2x1) (spatial vs spectral axis). The 600/4000 grism was used on the blue side, and 400/8500 grating on the red side, leading to a resolution of approximately 1.2 and 1.1Å, respectively. Total time includes read-out between consecutive exposures.
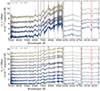 |
Fig. C.1. Keck I/LRIS 900-s exposures (top: Night 1, bottom: Night 2) of GLEAM-X J0704–37 reveal 2.9 h RV variability of an M dwarf star in the binary system. Gray bands indicate telluric features. |
RV measurements and errors of each exposure from Night 1 and Night 2. Times shown are the mid-exposure times (of 900s exposures in all cases), and have been barycentric-corrected.
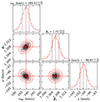 |
Fig. C.2. Corner plot of the MCMC analysis used to constrain RV parameters. |
Appendix D: Origin of the Hα emission, frame shifting, and cartoons of the geometry
Doppler tomography reveals the Hα emission to be coincident with the orbital phase of the donor star, though with a higher RV. This means that the bulk of the Hα emission originates from outside the M dwarf. Figure 2, however, is not a spatial representation of the system — rather, I explore two possible scenarios that could lead to the observed ≈330 kms−1 Hα emission (which is higher than the 189 ± 3 kms−1 RV amplitude of the M dwarf):
-
A compact emission region co-rotating with the M dwarf, but at higher orbital separation.
-
Emission from material falling onto the M dwarf.
The geometry of both scenarios is visually outlined below. It is unlikely that the emission region would be located between the WD and M dwarf. The Doppler tomogram shows that the emission region is locked with the M dwarf at the same orbital phase, meaning that they have the same angular velocity, ω. Since v = rω, where r is the distance from the center of mass, this means that in order to see a higher velocity, the material would have to be located farther from the center of mass than the M dwarf. A way around this would be for the emission region to be in Keplerian orbit (i.e., not locked with the M dwarf) around the WD. However, this would mean that the material is localized to a small region (i.e., not a disk), and it is highly unlikely that we would see the orbital phase of the emission region coincide with that of the M dwarf in one, much less both observing runs. It could also be possible that the Na I absorption line could emerge from the side of the M dwarf facing the WD while Hα emission originates from the center of mass of the M dwarf; however, this is unlikely given the large difference in velocities and previous findings in the CV literature (e.g., Wade & Horne 1988; Schwope et al. 2011).
In Figure D1, I show the average spectrum around the Hα line in the frame of the binary system (adding all spectra without any shifts; black), frame of the M dwarf (adding all spectra by shifting each one by the corresponding M dwarf RV; blue), and frame of the M dwarf but with an RV amplitude of 330kms−1 (adding all spectra by shifting each one by 1.7 times the corresponding M dwarf RV; red). This shows that the strongest, sharpest emission is resolved when shifting into the 330kms−1 frame, though signal-to-noise also builds up in the frame of the M dwarf. This exercise demonstrates that, independent of any model assumptions made, other than the measurement of the M dwarf RV curve with the Na I doublet, that Hα emission comes from outside of the M dwarf.
In Figure D2, I show cartoons of two possible scenarios that could lead to the observed Hα emission. The two criteria to be met are: 1) the emission region must coincide with the orbital phase of the M dwarf and 2) must be seen to have an RV of 330 kms−1, around 1.7 times that of the M dwarf. I speculate that the same phenomenon which powers the radio pulses also powers the Hα emission, and I draw the cartoons in Figure D2 in the orbital configuration (ascending node) where the radio pulses are observed (Figure 1).
In the first scenario, material would be locked with the M dwarf, but located at a higher orbital separation, aemission = 1.7aMD. Taking a = 0.99R⊙ ⇒ aMD = 0.85R⊙, This corresponds to aemission = 1.5R⊙ and confirms that the emission must originate from outside of the M dwarf. In the second scenario, the material would be falling in toward the M dwarf, potentially magnetically channeled. At that velocity, the free-fall height from the M dwarf center of mass would be  , corresponding to h ≈ 0.45R⊙, also well outside the surface of the M dwarf.
D.1. Connection to the 3.6 h post common envelope WD + M dwarf QS Vir
As a final note, the resemblance of this Hα Doppler tomogram to at least one of QS Vir, a post common envelope WD + M dwarf in a 3.6 h binary only ≈50 pc away, is intriguing. Figure 7 of Ribeiro et al. (2010) shows a similar picture to Figure 2 in this work — some Hα emission is associated with the M dwarf, yet a large fraction of it spills past the Roche lobe and originates from higher velocity. Ribeiro et al. (2010) argued that this was evidence of magnetic confinement in a prominence-like magnetic loop. However, this is not the case in Figure 5 of Parsons et al. (2016), where spectra obtained at a later date revealed no Hα emission at higher velocity, but instead some emission localized to different orbital phases. Recently, QS Vir was identified as a radio source in the VLA Sky Survey (VLASS) by Ridder et al. (2023). Follow-up of that source revealed a variable circularly polarized component in addition to a constant low-polarization component (Ridder et al. 2023). However, it appears that QS Vir has not been observed for an entire orbital period in the radio, which is necessary to search for pulsations. Upcoming radio campaigns should target post common envelope-binaries to investigate the occurrence rate of LPTs among them. Curiously, a survey of WD candidates in a crossmatch between Gaia and VLASS has revealed at most one candidate, suggesting that such systems may be rare, or radio-faint (Pelisoli et al. 2024).
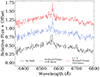 |
Fig. D.1. Average Hα line profile after shifting into the reference frame of the binary (black), M dwarf (blue), and 1.7 times the velocity of the M dwarf (red). This demonstrates that Hα is strongest and sharpest when shifting into the latter frame. This result only depends on the measured RV curve of the M dwarf from the Na I doublet, and is independent of any M dwarf parameter estimation. |
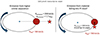 |
Fig. D.2. I propose two possible scenarios in which Hα emission could be generated: 1) an emission region locked with M dwarf, co-orbiting the WD, though 1.7 times farther away from the WD; 2) an emission region originating from material falling into the WD, either through free-fall or by being magnetically channeled. Both diagrams are shown at the ascending node, where the radio pulses occur. |
Appendix E: MCMC corner plots
E.1. Prior information on distance and extinction
GLEAM-X J0704–37 is located at Galactic coordinates of ℓ = 247.912298 ° ,b = −13.62183°. The low Galactic latitude corresponds to low, but non-negligible extinction: the 2D map of Schlafly & Finkbeiner (2011) estimates a value of E(B − V) = 0.25 while the 3D map of Lallement et al. (2022) estimates a value of A550nm = 0.821 at its maximum reach of 800 pc, which corresponds to E(B − V)≈0.28. The map of Edenhofer et al. (2024) is ultimately used, as described in the main text, which leads to E(B − V)≈0.12.
Notably, the distance to the system is poorly constrained a priori. Its Gaia DR3 (DR2) parallax of −0.22 ± 0.98 (0.4 ± 1.1) mas implies a distance of  (
( ) kpc as estimated by Bailer-Jones et al. (2021) (Bailer-Jones et al. 2018). Hurley-Walker et al. (2024) report that electron density models of the Milky Way report lead to modest distance estimates of 0.4 ± 0.1 (Yao et al. 2017) and 1.8 ± 0.5 kpc (Cordes 2004). Since Gaia does not detect a significant parallax, I favor an a priori assumption that the distances implied by electron density models are favored, and expect the system to be located within 2 kpc, with the extinction to be at most E(B − V) = 0.3.
In addition to the MCMC analysis described in the main text, I ran another routine identical to the one adopted in the main text, but fixing E(B − V) = 0.3. This was done in order to produce the lowest possible mass WD (since higher extinction values lead to higher WD radii). The table of parameters and ensuing corner plot are shown in Table E.1 and Figure E1, respectively. Even assuming extreme values of extinction, it appears that the WD in the system is massive, taking on a value of 0.82M⊙ with E(B − V) = 0.3.
Same as Table 2, but fixing E(B − V) = 0.3. The parameter that is most strongly affected is the inferred WD mass, reducing the median value from 1.02 to 0.82M⊙. Since higher values of extinction are unlikely, it appears that the WD must be above the mean WD mass of single WDs (0.6M⊙; Kepler et al. 2007).
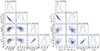 |
Fig. E.1. Corner plots resulting from the MCMC analysis. Left: Letting E(B − V) depend on the distance according to the 3D map of Edenhofer et al. (2024). Right: Fixing E(B − V)=0.3, which is likely the highest possible value. This leads to a lower inferred WD mass, though which still exceeds that of the mean single WD in the field (0.6 M ⊙ for a DA WD; Kepler et al. 2007). |
All Tables
List of the nine known LPTs at the time of writing (reported in published form or as a preprint).
Keck I/LRIS observation log of GLEAM-X J0704–37. The blue (red) side was binned at 2x2 (2x1) (spatial vs spectral axis). The 600/4000 grism was used on the blue side, and 400/8500 grating on the red side, leading to a resolution of approximately 1.2 and 1.1Å, respectively. Total time includes read-out between consecutive exposures.
RV measurements and errors of each exposure from Night 1 and Night 2. Times shown are the mid-exposure times (of 900s exposures in all cases), and have been barycentric-corrected.
Same as Table 2, but fixing E(B − V) = 0.3. The parameter that is most strongly affected is the inferred WD mass, reducing the median value from 1.02 to 0.82M⊙. Since higher values of extinction are unlikely, it appears that the WD must be above the mean WD mass of single WDs (0.6M⊙; Kepler et al. 2007).
All Figures
|
Fig. 1. Left: RVs measured using the Na I absorption doublet from Night 1 (blue) and Night 2 (red) folded on a period of 2.915(1) h and plotted with the best RV model (black; KMD = 189 ± 3 km s−1). This shows that the binary orbital period matches the radio pulse period to within 0.05 percent. Radio pulses (gray) occur just after the maximum redshift of the M dwarf, when it is at the ascending node as viewed from Earth. Right: Trailed spectra (Night 2) of the Na I doublet show good agreement with the RV model (black). Two orbital periods are shown for visual aid. |
| In the text | |
|
Fig. 2. Left: Doppler tomogram of the Hα line revealing > 3σ (red) emission associated with the orbital phase of the M dwarf (Roche potential shown by the solid black teardrop shape). The majority of the emission may originate from outside the M dwarf, with a higher observed velocity. Right: Trailed spectra of the Hα emission line shown alongside the M dwarf RV model (black solid line), and the higher velocity component (black dotted line; K ≈ 330 km s−1). |
| In the text | |
|
Fig. 3. Top: Average spectrum of GLEAM-X J0704–37 (black) well fit by a WD + MD binary model (red; parameters in Table 2). The overall flux level was calibrated by matching synthetic photometry (squares), generated from the spectrum, with Gaia average photometry (circles). Middle: Each binary component provides a good fit to the data when the other is subtracted. Bottom: Residuals show no obvious systematic disagreement, aside from the Hα emission and telluric features (gray bands). |
| In the text | |
|
Fig. B.1. Two of the three “long LPTs” (P≳ 78 min) are associated with orbital periods of WD + MD binaries, while “short LPTs” (P≲ 78 min) generally lack optical counterparts. The ≈78 min division (black line) corresponds to the orbital period minimum of any binary containing a Roche lobe-filling H-rich donor star, seen in the observed period distribution of CVs. The recent discovery of ASKAP J183950.5-075635.0 and its likely association with an NS spin suggests that “long LPTs” are not exclusively associated with WD orbits. Two of the three known “long LPTs” nearly coincide with the CV “period gap”, where accretion is thought to temporarily shut off (blue band). |
| In the text | |
|
Fig. C.1. Keck I/LRIS 900-s exposures (top: Night 1, bottom: Night 2) of GLEAM-X J0704–37 reveal 2.9 h RV variability of an M dwarf star in the binary system. Gray bands indicate telluric features. |
| In the text | |
|
Fig. C.2. Corner plot of the MCMC analysis used to constrain RV parameters. |
| In the text | |
|
Fig. D.1. Average Hα line profile after shifting into the reference frame of the binary (black), M dwarf (blue), and 1.7 times the velocity of the M dwarf (red). This demonstrates that Hα is strongest and sharpest when shifting into the latter frame. This result only depends on the measured RV curve of the M dwarf from the Na I doublet, and is independent of any M dwarf parameter estimation. |
| In the text | |
|
Fig. D.2. I propose two possible scenarios in which Hα emission could be generated: 1) an emission region locked with M dwarf, co-orbiting the WD, though 1.7 times farther away from the WD; 2) an emission region originating from material falling into the WD, either through free-fall or by being magnetically channeled. Both diagrams are shown at the ascending node, where the radio pulses occur. |
| In the text | |
|
Fig. E.1. Corner plots resulting from the MCMC analysis. Left: Letting E(B − V) depend on the distance according to the 3D map of Edenhofer et al. (2024). Right: Fixing E(B − V)=0.3, which is likely the highest possible value. This leads to a lower inferred WD mass, though which still exceeds that of the mean single WD in the field (0.6 M ⊙ for a DA WD; Kepler et al. 2007). |
| In the text | |
Current usage metrics show cumulative count of Article Views (full-text article views including HTML views, PDF and ePub downloads, according to the available data) and Abstracts Views on Vision4Press platform.
Data correspond to usage on the plateform after 2015. The current usage metrics is available 48-96 hours after online publication and is updated daily on week days.
Initial download of the metrics may take a while.