Fig. E.1.
Download original image
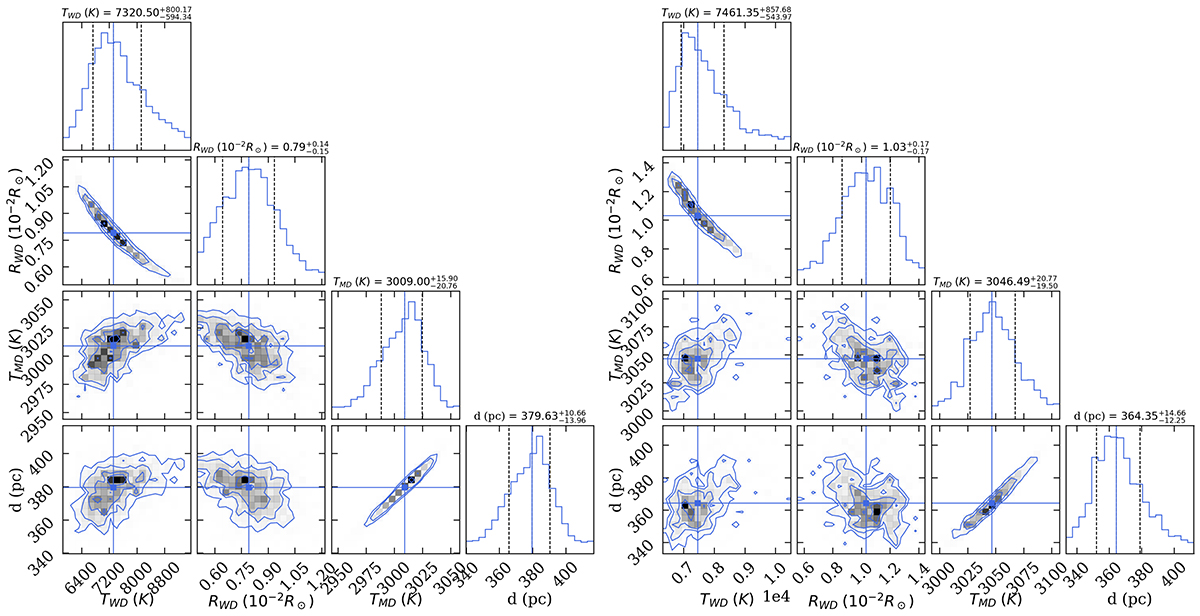
Corner plots resulting from the MCMC analysis. Left: Letting E(B − V) depend on the distance according to the 3D map of Edenhofer et al. (2024). Right: Fixing E(B − V)=0.3, which is likely the highest possible value. This leads to a lower inferred WD mass, though which still exceeds that of the mean single WD in the field (0.6 M ⊙ for a DA WD; Kepler et al. 2007).
Current usage metrics show cumulative count of Article Views (full-text article views including HTML views, PDF and ePub downloads, according to the available data) and Abstracts Views on Vision4Press platform.
Data correspond to usage on the plateform after 2015. The current usage metrics is available 48-96 hours after online publication and is updated daily on week days.
Initial download of the metrics may take a while.