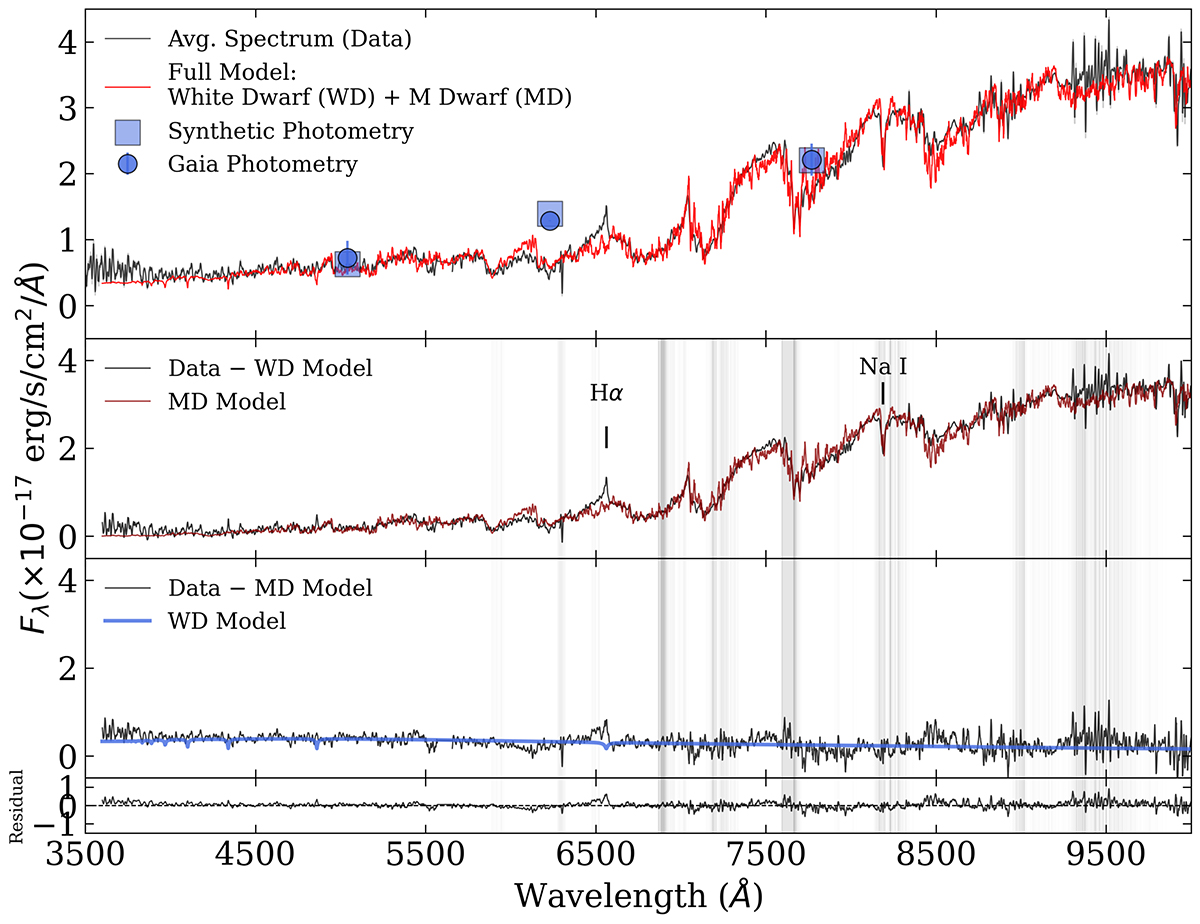
Fig. 3.
Download original image
Top: Average spectrum of GLEAM-X J0704–37 (black) well fit by a WD + MD binary model (red; parameters in Table 2). The overall flux level was calibrated by matching synthetic photometry (squares), generated from the spectrum, with Gaia average photometry (circles). Middle: Each binary component provides a good fit to the data when the other is subtracted. Bottom: Residuals show no obvious systematic disagreement, aside from the Hα emission and telluric features (gray bands).
Current usage metrics show cumulative count of Article Views (full-text article views including HTML views, PDF and ePub downloads, according to the available data) and Abstracts Views on Vision4Press platform.
Data correspond to usage on the plateform after 2015. The current usage metrics is available 48-96 hours after online publication and is updated daily on week days.
Initial download of the metrics may take a while.