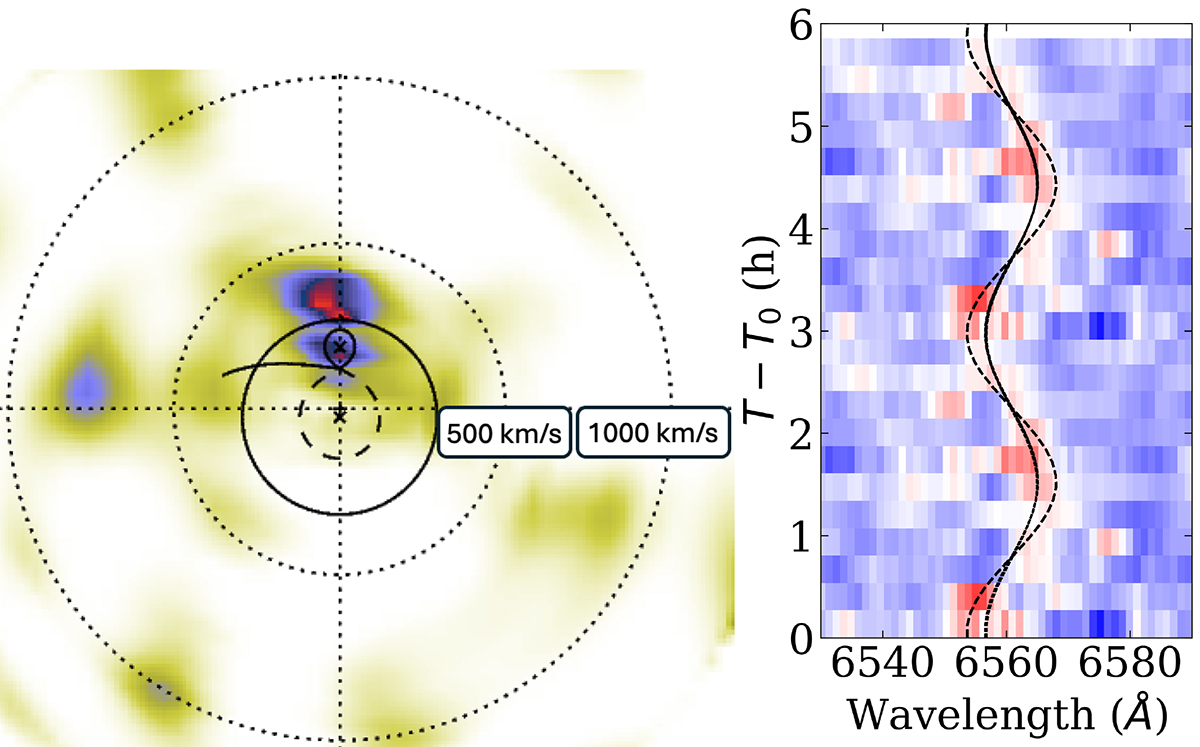
Fig. 2.
Download original image
Left: Doppler tomogram of the Hα line revealing > 3σ (red) emission associated with the orbital phase of the M dwarf (Roche potential shown by the solid black teardrop shape). The majority of the emission may originate from outside the M dwarf, with a higher observed velocity. Right: Trailed spectra of the Hα emission line shown alongside the M dwarf RV model (black solid line), and the higher velocity component (black dotted line; K ≈ 330 km s−1).
Current usage metrics show cumulative count of Article Views (full-text article views including HTML views, PDF and ePub downloads, according to the available data) and Abstracts Views on Vision4Press platform.
Data correspond to usage on the plateform after 2015. The current usage metrics is available 48-96 hours after online publication and is updated daily on week days.
Initial download of the metrics may take a while.