| Issue |
A&A
Volume 695, March 2025
|
|
|---|---|---|
| Article Number | A248 | |
| Number of page(s) | 15 | |
| Section | Galactic structure, stellar clusters and populations | |
| DOI | https://doi.org/10.1051/0004-6361/202453269 | |
| Published online | 26 March 2025 | |
Gaia-ESO survey: Massive stars in the Carina Nebula
II. The spectroscopic analysis of the O-star population
1
Instituto de Astrofísica de Canarias,
38200
La Laguna, Tenerife,
Spain
2
Departamento de Astrofísica, Universidad de La Laguna,
38205
La Laguna, Tenerife,
Spain
3
Royal Observatory of Belgium,
Ringlaan 3,
1180
Brussels, Belgium
4
Centro de Astrobiología (CAB), CSIC-INTA, Campus ESAC,
28692 Villanueva de la Cañada,
Madrid,
Spain
5
ESO,
Karl-Schwarzschild-Strasse 2,
85748
Garching bei München, Germany
6
Departamento de Física Aplicada, Universidad de Alicante,
3690, San Vicente del Raspeig,
Alicante,
Spain
7
Instituto de Astronomía y Física del Espacio,
UBA-CONICET. CC 67, Suc. 28,
1428
Buenos Aires, Argentina
8
Department of Astrophysics, University of Vienna,
1180
Vienna,
Austria
9
Observatório Nacional (ON)-MCTI,
Rua José Cristino, 77,
20921-400
Rio de Janeiro, RJ,
Brazil
10
Universidade Estadual de Santa Cruz – UESC,
Rodovia Ilhéus/Itabuna, km 16,
45662-900
Ilhéus, BA,
Brazil
11
Gemini Observatory/NSF’s NOIRLab,
Casilla 603,
La Serena,
Chile
★ Corresponding author; This email address is being protected from spambots. You need JavaScript enabled to view it.
Received:
2
December
2024
Accepted:
24
January
2025
Abstract
Context. The new census of massive stars in the Carina Nebula reveals the presence of 54 apparently single O-type stars in the Car OB1 association, an extremely active star-forming region that hosts some of the most luminous stars of the Milky Way. A detailed spectroscopic analysis of the current most complete sample of O-type stars in the association can be used to inspect the main physical properties of cluster members and test evolutionary and stellar atmosphere models.
Aims. Our aim is to carry out a spectroscopic characterization of the census of the apparently single (actual single or SB1) O-type stars in Car OB1, obtaining a reliable distribution of rotational velocities and stellar parameters from high-resolution spectra from the Gaia-ESO survey (GES) and the LiLiMaRlin library database, which is itself fed by spectroscopic surveys such as the high-resolution spectroscopic monitoring survey of Southern Galactic O- and WN-type stars (OWN), the high-resolution, multi-epoch project of Galactic OB stars (IACOB), the northern massive dim stars survey (NoMaDS), and the Calar Alto fiber-fed echelle – binary evolution Andalusian northern survey (CAFÉ-BEANS).
Methods. To derive rotational velocities, we used the semi-automatized tool for the line-broadening characterization of OB stars (iacob-broad) which is based on a combined Fourier transform and the goodness-of-fit methodology. To derive the stellar parameters, we used the iacob-gbat tool, FASTWIND stellar models, and astrometry provided by the Gaia third data release. The BONNSAI tool was used to compute evolutionary masses and ages.
Results. We performed quantitative spectroscopic analysis for the most complete sample of apparently single O-type stars in Car OB1 with available spectroscopic data. From the high-resolution GES and OWN spectra, we obtain a reliable distribution of rotational velocities for a sample of 37 O-type stars. It shows a bimodal structure with a low velocity peak at 60 km s−1 and a short tail of fast rotators reaching 320 km s−1. We also performed a quantitative spectroscopic analysis and derived effective temperature, surface gravity, and He abundance for a sample of 47 O-type stars, now including further stars from the GOSSS database. Radii, luminosities, and spectroscopic masses were also determined using Gaia astrometry. We created the Hertzsprung-Russell diagram to inspect the evolutionary status of the region and confirm the lack of stars close to the zero-age main sequence (ZAMS) from ∼35–55 M⊙. We confirm a very young population with an age distribution peaking at 1 Myr, with some stars close to or even on the ZAMS, and a secondary peak at 4–5 Myr in the age distribution. We confirm the youth of Trumpler 14, which is also the only cluster not showing the secondary peak. We also find a clear trend of evolutionary masses higher than derived spectroscopic masses for stars with an evolutionary mass below 40 M⊙ .
Key words: stars: early-type / stars: fundamental parameters / stars: massive / stars: rotation / open clusters and associations: individual: Carina Nebula
© The Authors 2025
 Open Access article, published by EDP Sciences, under the terms of the Creative Commons Attribution License (https://creativecommons.org/licenses/by/4.0), which permits unrestricted use, distribution, and reproduction in any medium, provided the original work is properly cited.
This article is published in open access under the Subscribe to Open model. This email address is being protected from spambots. You need JavaScript enabled to view it. to support open access publication.
1 Introduction
The Carina Nebula complex, at a distance of only ~2.3 kpc (Smith & Brooks 2008; Maíz Apellániz et al. 2024), is one of the major massive star-forming regions in the Galaxy. It contains several stellar groups immersed in the Car OB1 association (Maíz Apellániz et al. 2020, 2022) and hundreds of high-mass stars, including 74 O-type stars, 54 of which are apparently single or SB1 (see Berlanas et al. 2023, Paper I here-after). Despite its adequacy for studying massive stars, there is no systematic spectroscopic analysis of its OB population. Carina has many previous spectroscopic investigations (e.g., Voss et al. 2012; Alexander et al. 2016; Damiani et al. 2017; Mohr-Smith et al. 2017; Berlanas et al. 2017; Kiminki & Smith 2018; Hanes et al. 2018), but they were only performed on individual clusters, selected members, or for its less massive population.
While some of these studies give an initial insight into the spectroscopic parameters of the massive stars in Carina, there is still a need for a wider study of their young OB members throughout the rest of the nebula. It will be highly relevant to inspect the stellar formation across the nebula and investigate problems such as rotation and internal mixing and the stellar multiplicity of massive stars (see Langer 2012; Herrero 2016). The rotational velocity distribution is especially important because it directly affects (and reveals) their evolutionary behavior (see Langer 2012; de Mink et al. 2014; Holgado et al. 2022). Rotation favors the transport of angular momentum from inside the star and produces a circulation of matter from the core to the surface. Depending on the initial rotational velocity of the star and the mixing mechanisms working in its interior, the evolution and fate of a massive star may be completely different (see, e.g., Brott et al. 2011; Ekström et al. 2012). In addition, massive stars are usually born in multiple systems (Sana et al. 2012; Sota et al. 2014; Maíz Apellániz et al. 2019b), where the components are close enough to interact during their lifetime, so the possible channels of evolution and final fate are multiplied (de Mink et al. 2013). Fast rotating massive OB stars have been proposed as products of interaction processes (de Mink et al. 2013, 2014), so the distribution of rotational velocities can be used as evidence for their evolutionary behavior, including pre- and post-binary interaction. In recent years a considerable effort has been made to establish the full distribution of rotational velocities of massive OB stars in different environments (e.g., Ramírez-Agudelo et al. 2013, 2017; Simón-Díaz & Herrero 2014; Berlanas et al. 2020; Holgado et al. 2022). The possible lack of a fast rotating tail seen by Berlanas et al. (2020) in Cygnus OB2 in contrast to the results found by Ramírez-Agudelo et al. (2013) in 30 Doradus would add interest to the study of a similar population in another young region. Car OB1 represents an ideal target to this aim, as a similar analysis is still pending despite it being one of the youngest star-forming regions in the Galaxy that may provide key environmental constraints.
In addition, an extensive spectroscopic study of the O population is requisite for an accurate characterization of its massive stellar content and inspection of the Carina Nebula star formation history. Since the Gaia satellite in its third data release (DR3; Gaia Collaboration 2021) has provided precise astrometry for the whole region and the distance to Carina clusters was re-estimated in Paper I and Molina Lera et al. (in prep.), we are poised to provide the most complete and precise catalog of spectroscopic and physical parameters of the O population in the nebula. It will allow us to create a much more precise Hertzsprung-Russell diagram (HRD) to interpret its evolutionary status and explore open questions concerning massive star research; these may include the possible dearth of stars close to the zero-age main sequence (ZAMS) between 30 and 60 M⊙ (see, e.g., Holgado et al. 2020), the mass-discrepancy problem, or the age dispersion in very young clusters. Thanks to the high-quality spectra (in terms of resolution and signal-to-noise ratio) provided by the Gaia-ESO survey (GES; see Gilmore et al. 2022; Randich et al. 2022; Blomme et al. 2022) and the high-resolution spectroscopic monitoring survey of Southern Galactic O- and WN-type stars (OWN; see Barbá et al. 2014), this work focuses on the line-broadening and spectroscopic characterization of the O-star population identified in Car OB1 from the most recent census of massive stars presented in Paper I.
This paper is organized as follows. In Sect. 2, we introduce the spectroscopic sample. In Sect. 3, we describe methodology and tools for performing quantitative spectroscopic analysis. We present the results in Sect. 4, where we also discuss and interpret the distribution of projected rotational velocities, the HRD, the mass discrepancy, and the age dispersion for the O-star population in the Car OB1 association. Finally, we summarize our conclusions in Sect. 5.
2 Sample
We selected stars classified as O types in Paper I (excluding identified SB2 stars) for which high-resolution spectra are available. Most of the available optical–blue data come from the GES and OWN catalogs, which meet with the quality requirements (in terms of resolution and S/N) for deriving accurate rotational and stellar parameters. We remind the reader that the LiLiMaRlin library of libraries (Maíz Apellániz et al. 2019a) is a collection of high-resolution spectra of early-type stars collected from a series of individual projects and archival searches. For this work, we used the FEROS part of LiLiMaRlin, which was built from the OWN project (Barbá et al. 2010, 2017), and a global search of the FEROS archive, which retrieved data from multiple programs. The main sample is composed of 37 presumably single O-type stars, representing a fraction of 68.5% of the apparently single O star population identified in Paper I (including SB1 stars). We note that the bright member HD 93 129 Aa is actually an SB3 system with two very early O components and one OB component (Maíz Apellániz et al. 2017; Molina Lera et al., in prep.) so it is not included in the analysis. This system was analyzed by Gruner et al. (2019) assuming two components and using the Potsdam Wolf-Rayet model atmosphere code (PoWR) and a multiwavelength SED fitting to derive its luminosity. Furthermore, the noisy spectrum of [ARV2008] 217 prevents us from performing a reliable analysis, and thus it has also been excluded from the main sample. Spectra for another ten O-type stars in Car OB1 are available from the Galactic O-Star Spectral Survey (GOSSS, see Maíz Apellániz et al. 2011). Due to their low-resolution spectra (R~2500), they were not included in the distribution of rotational velocities, but were used to investigate the possible presence of fast rotators and for completeness purposes in the HRD (see Sects. 3.1 and 4 for further details). The remaining five stars do not have optical spectra available. Table 1 shows a brief summary of the spectral sample considered in this work.
3 Methodology
3.1 Line-broadening characterization
To derive projected rotational velocities, we used iacob-broad, a user-friendly tool for the line-broadening characterization of OB stars (Simón-Díaz & Herrero 2007, 2014). It is based on a combined Fourier transform (FT) and the goodness-of-fit (GOF) method, which allows us to easily determine the stellar projected rotational velocity (v sin i) and the amount of extra broadening (vmac) from a specific diagnostic line. The FT technique is based on the identification of the first zero in the FT of a given line profile (Gray 2008; Simón-Díaz & Herrero 2007). The GOF technique is based on a comparison between the observed line profile and a synthetic one that is convolved with different values of v sin i and vmac to obtain the best fit by means of a χ2 optimization. The main advantage of this methodology is that we obtain two independent measurements of the v sin i (resulting from either the FT or the GOF analysis) whose comparison is used as a consistency check and to better understand problematic cases.
In order to obtain a reliable distribution of projected rotational velocities for the O population in Car OB1, high-resolution spectroscopy for the maximum number of O stars in the census is required to reach low projected rotational velocities and better disentangle the macroturbulence broadening. As shown in Table 1, GES provides spectra at R~20 000 and R~47 000 using the two VLT instruments with which the survey was performed (Giraffe and UVES, respectively). However, it does not include the brightest members of the surveyed region due to saturation limits. Several spectral libraries such as the MEGARA-GTC library (García-Vargas et al. 2020) or the IACOB database (Simón-Díaz et al. 2011) provide the community with high-quality spectra of massive stars, but both cover mainly the northern hemisphere. Fortunately, the LiLiMaRlin library of libraries includes FEROS high-resolution spectroscopy (R~48 000) from the OWN survey (Barbá et al. 2010, 2017) and others for several OB massive stars present in Paper I. Since metallic lines do not suffer from strong Stark broadening or nebular contamination, they are best suited for obtaining accurate v sin i values. Giraffe setups cover the Si III 4552 diagnostic line, while UVES/FEROS setups also cover the O III 5592 diagnostic line. For the earliest types, we also used N V 4603-20. In case none of them were present, we used the nebular free or weakly contaminated He I lines (He I 4387,4471,4713). Only when the He I lines are weak or too noisy were we able to rely on He II 4542. As in Ramírez-Agudelo et al. (2013), for those cases in which different diagnostic lines are available, we compare the measured v sini values. We find similar results to the aforementioned authors, who concluded that the comparison between v sin i measurements obtained from metal and from different He I lines reveals no systematic differences. In all cases, differences are within the limits represented in Fig. 1.
As an assessment of the reliability of the results from the line-broadening analysis, in Fig. 1 we first compare the v sin i values derived from the FT and those derived from the GOF technique for the sample of O-type stars present in the census and for which high-resolution spectroscopy is available from the GES and OWN catalogs. We count with a sample of 22 O-type stars from GES (excluding detected SB2 stars, see Paper I) and with another 15 O-type stars from the OWN survey. We adopted limits of 20 km s−1 or 20%, whichever was the largest. Simón-Díaz & Herrero (2014) found that the agreement is always better than 20%; however, for low projected rotational velocities effects such as the spectral resolution or the microturbulence may play an additional role (see, e.g., Sundqvist et al. 2013; Simón-Díaz & Herrero 2014). These limits also mark the region where errors in v sin i may have an impact on the derived spectroscopic parameters (see Sabín-Sanjulián et al. 2017). For all stars, we find good agreement within the limits given above. We adopted the v sin i provided by the GOF technique since it is less affected by the subjectivity in the selection of the first zero of the FT (see Simón-Díaz & Herrero 2014). However, the values are consistent with those from the FT, as indicated above. The results, with uncertainties in the range of 10–20%, are given in Table A.1.
Telescopes, instruments, and settings of the spectra used in this work.
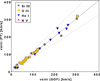 |
Fig. 1 Comparison of v sin i values for sample of O stars analyzed in this work and resulting from either the FT or the GOF analysis provided by the iacob-broad tool. Dashed lines represent a difference of 20 km s−1 or 20% from the 1:1 relation, whichever is largest. Different colors and symbols indicate the diagnostic lines used for the line-broadening characterization. |
3.2 Main spectroscopic parameters
We performed quantitative spectroscopic analysis for the whole sample of O stars based on large grids of synthetic spectra computed with the non-local thermodynamic equilibrium (NLTE) stellar atmosphere code FASTWIND (Santolaya-Rey et al. 1997; Puls et al. 2005; Rivero González et al. 2012) and the user friendly iacob-gbat tool (Simón-Díaz et al. 2011), which through synthetic FASTWIND line profiles and applying a χ2 algorithm, allows us to easily determine the effective temperature (Teff), surface gravity (log ɡ), wind-strength parameter (Q, defined as Ṁ/(v∞ R)1.5), helium abundance (Y(He), defined as N(He)/N(H)), microturbulence (ξ), and the exponent of the wind velocity law (β) from their H and He lines1.
Our grid of models were calculated using version 10.4 of the FASTWIND code and the distributed computation system HTCondor2. This grid includes more than 100 000 models covering a wide range of stellar and wind parameters considered for standard OB stars and calculated at solar metallicity. The input atmospheric parameters to FASTWIND are Teff, log ɡ, radius (R*), ξ, and surface abundances. The wind parameters are the mass-loss rate (Ṁ), terminal velocity (v∞), and β, without considering optically thin clumping.
Derived stellar parameters for the O population in Carina are shown in Table A.1. We also include the gravity corrected from centrifugal acceleration, log ɡtrue3, as it is needed to properly compute spectroscopic masses. We complement these results with a series of figures (Appendix B) in which the best-fitting model resulting from the analysis of each star is overplotted on the observed spectrum. We note that some of the stars of our sample have previous parameter determinations in the literature. Holgado et al. (2018, 2020, 2022) analyzed 22 stars of our sample using the same methodology as in this work (see also Sect. 4.3 for a proper comparison of results in Trumpler 14). We find an extremely good agreement in the derived spectroscopic parameters.
3.3 Radii, luminosities, and masses
When absolute magnitudes are given, the iacob-gbat tool uses them to determine the associated physical stellar parameters. It computes the radius (R), luminosity (L), and spectroscopic mass (Msp) using the procedure introduced by Kudritzki (1980).
Benefiting from Gaia DR3 and within the Villafranca project, Molina Lera et al. (in prep.) studied the groups of the Car OB1 association and determined their distances (see also Maíz Apellániz et al. 2024). To properly measure distances for stellar groups (avoiding systematic biases and estimating random uncertainties), the Villafranca project established an independent and improved astrometric calibration of Gaia data. The project uses corrected parallaxes (by the nonzero parallax zero point) with their external uncertainties4. For a proper estimation of the distance, the project also uses the thin-disk model, which is optimized for early-type stars in the Galactic disk, and the priors of Maíz Apellániz (2001, 2005) updated with the parameters of Maíz Apellániz et al. (2008). In addition, Gaia parallaxes have a substantial angular correlation that imposes a limit on the distance uncertainty for clusters. For DR3, this amounts to the distance in kiloparsecs as a percentage, for example 1% at 1 kpc and 3% at 3 kpc. As dividing stars into groups will produce more accurate distances (than for individual stars) and should give us coeval populations to compare to simulation predictions, we adopted group distances derived by the Villafranca project instead of the distances and uncertainties of individual stars. Adopted distances in parsecs are  for Trumpler 14 (group O-002),
  for Trumpler 16 W (group O-003),
  for Trumpler 16 E (group O-025),
  for Trumpler 15 (group O-027),
  for Collinder 228 (group O-028),
  for Collinder 232 (group O-029), and
  for Bochum 11 (group O-030). However, we note that a comparison between the results obtained assuming both group and individual distances shows no significant differences in the derived parameters, but it does show smaller errors when using groups, as expected.
The visual extinction AV can be defined in terms of the (V − Ks) color excess as  . We adopted optical and near-IR photometry from the USNO-B (Monet et al. 2003) and 2MASS (Skrutskie et al. 2006) catalogs and unreddened intrinsic colors from Martins & Plez (2006). Only the star HD 93 129 B does not have infrared photometry available. We thus used photometric transformations between Gaia photometry and the 2MASS system5 to derive the corresponding Ks magnitude for this star. We assume the RV = 3.1 extinction law from Rieke & Lebofsky (1985) to derive
  and
and  . We note that our results will be dependent both on the extinction law adopted and on the assumption of a constant average RV. This coefficient depends on the properties of the absorbing dust grains and thus on the kind of region containing them (see, e.g., Maíz Apellániz & Barbá 2018). Nevertheless, for the whole sample we find good agreement between the derived AV values and those derived by Maíz Apellániz & Barbá (2018), with a mean difference of 0.12 ± 0.12 mag corresponding to a possible additional error in log L/L⊙ of 0.05 dex. Furthermore, we also find good agreement between our MV values and those obtained from the Martins & Plez (2006) calibration. Only for the star 2MASS J10443089-5914461 do we find a significant difference in MV. However, the derived MV suggests that this star is probably located in the background (a possibility that was also indicated in Paper I).
Derived visual extinctions and physical parameters are shown in Table A.2. For luminosities, radii, and spectroscopic masses, errors include the iacob-gbat formal uncertainties for the stellar parameters and those related to MV. MV uncertainties were obtained from the considered distance errors.
4 Results and discussion
4.1 Distribution of rotational velocities for the O population
We obtained the distribution of projected rotational velocities for a sample of 37 O-type stars with available high-resolution spectra, 22 of them observed by GES and 15 observed by the OWN survey and taken from the LiLiMaRlin library (see Fig. 2, left and middle panels). As stated before, this number represents a 68.5% fraction of the total known population of 54 single O-type stars identified in Paper I6, providing us with a representative distribution of projected rotational velocities for the O-star population in Carina. We found a low-velocity peak at 60 km s−1 and a tail of fast rotators above 200 km s−1, as expected from previous results in some other surveys involving O-type stars (see, e.g., Ramírez-Agudelo et al. 2013; Simón-Díaz & Herrero 2014; Ramírez-Agudelo et al. 2017; Holgado et al. 2022). We observe an evident lack of stars in the 75–100 km s−1 bin. A small gap is also found by Berlanas et al. (2020) in the Cygnus OB2 association, although it is slightly shifted to higher velocities, which may be caused by the lower resolution data used in that study (see left panel of Fig. 3 and Berlanas et al. (2020) for a detailed discussion on this gap). This pattern weakly resembles that found by Dufton et al. (2013) in a sample of early-B stars in 30 Doradus, as part of the VLT-FLAMES Tarantula Survey (VFTS, Evans et al. 2011). These authors found a bimodal distribution (although with a much more relevant secondary peak than in our case) with a gap at around 100 km s−1 and suggest that it could be due to evolutionary effects related to binarity and/or magnetic fields or that the velocity distribution was inherited in the star formation process. Nevertheless, Ramírez-Agudelo et al. (2013) do not find a similar pattern when considering the sample of 216 VFTS O-type stars at R= 8000 in the same region (see Fig. 3, right panel), and it is not observed either in the distribution found by Holgado et al. (2022) for a general sample of 285 Galactic O-type stars at R= 25 000–46 000 in the Milky Way (Fig. 3, middle panel).
To minimize possible spectral classification uncertainties we added to the distribution the 27 single B0 stars observed by GES (excluding detected SB2 stars, see Paper I and Table A.4). In Fig. 3, right panel, we observe that this gap is highly attenuated when adding the B0 star sample, and therefore we consider this gap an stochastic effect that has no real implication in the obtained distribution. Apart from this, the distribution is very similar to the above-mentioned samples of O stars in the Milky Way and 30 Doradus regions, showing a bimodal structure, although a shorter tail of fast rotators is found in Carina. The sample of Galactic O stars presents a clear tail of fast rotators reaching 450 km s−1, while the distribution in Carina does not reach 350 km s−1. In 30 Doradus there is a more evident tail of fast rotators reaching 600 km s−1. In this case, larger v sin i values are expected due to the lower metallicity of the Large Magellanic Cloud, where stars lose less angular momentum through stellar winds (Langer 2012).
We applied the Anderson-Darling k-sample test (see Scholz & Stephens 1987) to check if the difference between the two above mentioned distributions and ours in Carina is statistically significant. In both cases, the null hypothesis that the samples are drawn from the same distribution are rejected (at a significance level of 0.6% and 2.8% for 30 Doradus and the Milky Way, respectively). If we carry out the same test for the distributions up to 250 km s−1 , the null hypothesis cannot be rejected (at significance levels of 60% and 24% for 30 Doradus and the Milky Way, respectively), indicating that the lack of very fast rotators in the Car OB1 distribution is significant.
In order to check whether the ten O-type stars not present in either GES or OWN catalogs could be populating the observed tail, we used GOSSS spectra. From a rough approximation (vlim ~ c/R), we find that ~100 km s−1 is the lower limit that can be measured at R ~ 25007. Such a low resolution prevents us from detecting significantly lower velocities, and may result, in some cases, in v sin i values overestimated by ~20 km s−1 (i.e., one bin in Fig. 2). Although the accuracy of the results is not sufficient to include them in the final distribution, it is enough to let us know whether they are fast rotators or not. We do not find any of those stars rotating above 200 km s−1, deriving v sin i values in the 100-200 km s−1 range in all cases. The same conclusion can be obtained from their spectral classification (see Table A.3) as only one of them includes a broadening index, (n), which, as shown in Paper I, corresponds to a mean v sin i value of 206 km s−1. We note, however, that they can contribute to filling the gap observed at 75–100 km s−1. We also degraded the spectrum of [ARV2008] 217 to the GOSSS resolution in order to increase the S/N, deriving a v sin i value slightly above 200 km/s, which confirms that it would not be populating the fast rotating tail either. Also interesting is that the addition of B0 stars to the distribution increases the fast rotator peak around v sin i ~ 250 km s−1 , but it does not extend the tail to higher projected rotational velocities.
A similar lack of fast rotators has been found in Cygnus OB2 (Fig. 3, left panel). In this case, the null hypothesis that the samples are drawn from the same distribution can only be rejected at a significance level of 16%. In fact, we do not find any O stars rotating above 275 km s−1 and 310 km s−1 for Cygnus OB2 and Car OB1, respectively. Considering the distributions for 30 Dor and the Milky Way, the probability of finding stars with projected rotational velocities higher than 250 km s−1 is 0.16 and 0.13, respectively (or eight and six stars in Carina, and ten and eight stars in Cygnus OB2). However, we find only four and three O- type stars rotating above 250 km s−1 in Carina and Cygnus OB2, which is significantly lower than expected. Thus, the lack of extremely fast O rotators in both associations is clear. Taking into account that they have been proposed as a consequence of binary interaction processes (see Sana et al. 2012; de Mink et al. 2014; Holgado et al. 2022) and considering the relative small size of our O sample in Carina and its young age, we have to contemplate the possibility that a significant part of its population may not have had enough time for binary interactions to produce such an extended tail. However, the similar result found in Cygnus OB2, an association with an extended star formation history (Negueruela et al. 2008; Wright et al. 2015; Berlanas et al. 2020), suggests that a thorough study on this discrepancy is required in order to obtain a firm conclusion.
 |
Fig. 2 Distribution of rotational velocities of final sample of OB stars analyzed in this work. Left: rotational velocities for sample of 22 and 15 O-type stars in Carina from GES (turquoise) and OWN (green) catalogs, respectively. Middle: normalized distribution for same sample of 37 O-type stars for which high-resolution spectra are available. The red line represents a kernel density estimation using Gaussian kernels. Right: distribution for same sample of 37 O-type stars (light blue) but including 27 B0-type stars identified in the GES catalog (dark blue). |
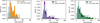 |
Fig. 3 Normalized distribution of rotational velocities of final sample of O-stars in Carina presented in this work compared to the distribution of O-stars found in the Cygnus OB2 association by Berlanas et al. (2020) (left), the Milky Way by Holgado et al. (2022) (middle), and in 30 Doradus by Ramírez-Agudelo et al. (2013) (right). |
4.2 The Hertzsprung–Russell diagram
The 37 O-type stars for which high-resolution spectra are available are placed in the HRD (in yellow). For completeness purposes, the ten stars for which only low-resolution spectra are available from GOSSS are also included (in orange). This low resolution prevents us from including them in the distribution of projected rotational velocities, as it would be difficult to assign them to the correct bin for low v sin i objects. However, the limitations introduced by the resolution are automatically taken into account in the iacob-gbat algorithm, and thus we can derive the stellar parameters for GOSSS stars in the same way as for GES and OWN ones (albeit with corresponding larger uncertainties for the same S/N). We note that only two of the GOSSS stars have previous parameter determinations in the literature. ALS 15207 was included in Rainot et al. (2022) within the Carina High-contrast Imaging Project of massive Stars (CHIPS), although the provided parameters are based on calibrations by Martins et al. (2005). HDE 305518 is also included in the work by Hanes et al. (2018), who analyzed it using the nonlocal thermodynamic equilibrium Tlusty BSTAR2006 Lanz & Hubeny (2007) model spectra. The stellar parameters determined by these authors (Teff and log g) differ significantly from our results, with differences of 5000 K in temperature and 0.4 dex in gravity. Calibrations by Martins et al. (2005) and Holgado et al. (2018) agree with our results.
Since evolutionary models affect the interpretation of the HRD, and considering previous works comparing stellar tracks (see, e.g., Martins & Palacios 2013; Wright et al. 2015; Berlanas et al. 2020), in Fig. 4 we show two HRDs from two of the most used families of stellar models for massive stars. We only used nonrotating Bonn (Brott et al. 2011) and rotating Geneva (Ekström et al. 2012) stellar evolutionary tracks and isochrones (in top and bottom panels, respectively) as the nonrotating Geneva models and the rotating Bonn models behave in a way quite similar (but not identical) to the non-rotating Bonn models of the top panel. The main difference among both families of models is the treatment of the magnetic field and the angular- momentum transport in the interior, which has consequences when the initial stellar rotation is high. This produces the large differences that we see in the isochrones of both panels. Moreover, the overshooting parameter used for compute the models (0.1 for Geneva and 0.335 for Bonn) plays a significant role in defining the width of the main sequence.
In both cases, the stars are distributed over the HRD covering the whole range of expected stellar masses. The most massive star is the bright member HD 93 250 A,B, with a derived spectroscopic mass above 75 M⊙ . Less massive stars have masses above 16 M⊙ , as expected for O types. The stars cover a wide range of temperatures at any luminosity, indicating different degrees of evolution, and thus a range of stellar ages and star formation epochs. From the Bonn models (top panel in Fig. 4) ages vary between 0 and 5 Myr. However, we note that the stars following the ZAMS and the 1 Myr isochrone present a remarkable lack of stars between ~32 and 55 M⊙. These numbers would be slightly different if we used the rotating Geneva models (bottom panel in Fig. 4), but they offer the same global scenario.
The fastest rotators concentrate at the lower masses. The highest mass star rotating above 200 km s−1 has a spectroscopic mass of 25.9 ± 6.3 M⊙. The same conclusion is reached using the evolutionary masses that will be derived in Sect. 4.5 (although the  M⊙). This result was already pointed out by Holgado et al. (2022) for their Galactic sample of O stars and by Sabín-Sanjulián et al. (2017) in 30 Doradus, who also find that most of the rapid rotators in their sample have masses below ~25 M⊙.
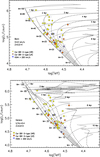 |
Fig. 4 HRDs for sample of 47 O-type stars in Carina using rotating Geneva (Ekström et al. 2012, bottom panel) and nonrotating Bonn (Brott et al. 2011, top panel) evolutionary stellar tracks and isochrones. |
4.3 The GAP close to the ZAMS
The place where the most luminous (HD 93 250 AB) and hottest (HD 93128, HD 93129 B) stars of the sample are located leaves a region close to the ZAMS between 32 and 55 M⊙ with a clear lack of stars. Whereas stars follow the isochrones ≥2 Myr (in the Bonn diagram) with a continuum of masses, those at the ZAMS and 1 Myr isochrone show remarkable gaps between the most massive stars and the rest.
This apparent lack of massive O stars close to the ZAMS in the upper left part of the HRD has been widely discussed by several authors over the last decades (e.g., Herrero et al. 2007; Castro et al. 2014; Sabín-Sanjulián et al. 2017) and was recently revisited by Holgado et al. (2020). The gap is particularly clear in the latter work, which used the so-called spectroscopic HRD (Teff versus log ℒ8, see Langer & Kudritzki 2014). This diagram has been widely used by the community thanks to its independence of distance and interstellar extinction, establishing a useful diagram to compare observations and evolutionary models when accurate distance measurements are not available.
As an explanation for this gap, a possible observational bias was pointed out, namely the lack of stars from very young clusters (<1–2 Myr) in the observed stellar samples. The missing stars could still be embedded in their birth cocoon and thus be heavily reddened (Hanson et al. 1998). In order to check this possible young age implication, Holgado et al. (2020) included Trumpler 14 in their study and constructed the associated classical HRD for this specific young cluster.
To facilitate the comparison between this work and ours, we first compare the spectroscopic HRDs. To this aim, we show in Fig. 5 our spectroscopic HRD for the sample of 47 O-type stars in Car OB1 analyzed here. We also find the age of the O population in Carina well constrained below 5 Myr, as deduced from the HRDs. However, we note that the position (on the Y-axis) of many stars has varied, mainly those defining ages ≤1 Myr. In fact, the most luminous and hottest stars are now located close together at ~90–100 M⊙, and no star is located below the 1 Myr isochrone. This is a significant difference with respect to the corresponding HRDs of Fig. 4 that show a large number of stars close to or at the ZAMS. Nevertheless, we again detect the absence of stars close to the ZAMS above 25 M⊙ .
We now perform a proper comparison between the classical HRD of Holgado et al. (2020) and our HRD. We should consider that these authors used data from Gaia DR2, and some of the cluster memberships they adopted are incorrect (see Paper I for an updated membership study of clusters in Carina based on Gaia DR3 data). Despite this, there are six stars of Trum- pler 14 in common with our sample for which high-resolution spectra are available. We find an extremely good correspondence between temperatures derived by both studies (with differences below 1000 K in all cases), but larger discrepancies in luminosity. This could be due to the use of different data releases (DR3 has provided much more precise parallax values than DR2). However, only for the star HD 93129 B do we find a critical difference in the position of the diagrams: we estimate a log L/L⊙ value of 5.62, while Holgado et al. (2020) derived a log L/L⊙ value of 6.43 for the same star. We note that Gaia parallaxes are affected by a global zero-point offset that makes the corrected parallaxes larger than the uncorrected ones (see Lindegren et al. 2018, 2021). This is systematic for all stars. Then there is also a dependence on magnitude, color, and position (Lindegren et al. 2021; Maíz Apellániz 2022). In that case, it varies in a different direction for each star (see Fig. 8 of Maíz Apellániz 2022). However, these effects have been taken into account in our analyses. Therefore, apart from the difference between the parallax value provided by the second and third Gaia data release, we point out the different visual extinction considered for this star. Holgado et al. (2020) assumed the same value as for the A component given by Maíz Apellániz & Barbá (2018) (AV = 2.199 mag) while we use the derived value following methods described in Sect. 3.3, where Ks magnitude has been obtained using Gaia photometric transformations (AV = 1.929 mag). We remark that our derived MV value is compatible with that by Martins & Plez (2006). Moreover, in the spectroscopic diagram this star appears around the 100 M⊙ track, while in the classical HRD we constructed it lies on the ZAMS and close to the 60 M⊙ track9. We recall that the parameters obtained for very hot stars can be improperly constrained with our methodology due to the low signal of He, I lines, thus slightly overestimating derived temperatures. As seen in Rivero González et al. (2012), nitrogen lines can be used instead, although the expected change in temperature is not large enough to produce a significant change on the reported gap.
The comparison of both works and that of the spectroscopic and classical HRD lead us to conclude that the gap reported by other authors is also present in Carina (between ~30–60 M⊙). The gap is marked by the position of the most massive and luminous stars, and this leads us to consider the possibility that the stars in our sample may have followed different evolutionary paths and have been born with different rotational velocities, or have followed peculiar or nonstandard evolution. For example, the isochrones of the rotating Geneva models move back toward the ZAMS for the most massive stars. Thus, the abovementioned stars could be the product of fast rotation evolution, while other stars of the sample may have followed nonrotating tracks. In this scenario and with the rotating Geneva models, we would expect these stars to be older than 2–3 Myr and have moved toward the ZAMS, showing a present-day projected rotational velocity of the order of the observed v sin i (≤115 km s−1 for all of them). However, we would also expect high He abundances, but we derived solar values in all cases. If they belonged to a population of even faster rotators, we would expect them to be rotating fast and closely following a chemically homogeneous evolution. Yet, they have normal He abundances and modest v sin i values (although they could be affected by the inclination of the rotational axis). These stars could also be interpreted as mergers after binary interaction and detected as blue stragglers that appear to be younger than the rest of cluster members. In this case, He abundances could be closer to the observed ones as a consequence of the fresh hydrogen supply, while the expected rotational velocities would depend on model details (see Schneider et al. 2016; Menon et al. 2024). Nevertheless, an explanation for the position of these stars on the HRD as result of mergers of lower mass stars would still need to clarify why these mergers do not produce stars in the gap region.
Therefore, an explanation of the gap, either as a lack or a dearth of stars with ~30–60 M⊙ close to the ZAMS, is lacking. A correct interpretation of the possible nonstandard evolutionary paths deserves a more in-depth study of the stellar properties (including abundances) in the future, while the inhomogeneous visual extinction present in the nebula and the lack of known dwarfs of types O4–O5 imply that a deep, near-infrared (NIR) spectroscopic study to uncover the heavily obscured (and not easily accessible in the optical) massive population in Car OB1 is demanded as some of the youngest and most massive stars could also be hidden behind their natal clouds, thus producing the mentioned gap.
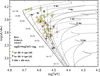 |
Fig. 5 Spectroscopic HRD for sample of O stars in Car OB1 using Geneva rotating evolutionary stellar tracks and isochrones. The triangles indicate upper limits for log g. |
4.4 Ages
In order to infer individual ages for the sample of the stars analyzed in this work, we used the BONNSAI tool10 (Schneider et al. 2014) based on Bonn evolutionary tracks computed at solar metallicity. To this aim, the stellar parameters previously determined with the iacob-gbat tool (see Sect. 3.2) were used as input parameters (Teff, log L/L⊙ and log gtrue).
We have to consider possible age differences when using different evolutionary models. Bonn stellar models do not exhibit large differences in stellar ages when including rotation, and these are similar to those obtained from nonrotating Geneva models, as previously shown by Berlanas et al. (2020) (although Bonn models provide a more extended TAMS, and when considering rotation more stars are located close to (or on) the ZAMS because it is slightly displaced to higher luminosities and lower temperatures). As stated before, one of the main reasons for the differences in the extension of the main sequence is the use of high overshooting values (see, e.g., Schootemeijer et al. 2021; Higgins & Vink 2019). When considering Geneva rotating evolutionary models and isochrones (v/vc ~ 0.4, see bottom panel of Fig. 4), we find slightly older main sequence ages of ~2 Myr, as seen by previous works (Wright et al. 2015; Berlanas et al. 2018, 2020), with most massive members being more affected. Nevertheless, we follow the conclusions by Holgado et al. (2022) here. Based on their analysis of a sample of 285 stars, they conclude that O-type stars are born with moderate initial rotational velocities (no more than 20% of the critical velocity). We thus expect the results found in this section to be significant for the bulk of our sample.
Figure 6 shows the age distribution of the sample of 47 O- type stars in Car OB1 when divided into the different clusters or Villafranca groups present in Car OB1. As stated in the Vil- lafranca papers and in Paper I, Trumpler 14 (O-002), Trumpler 16 E (O-025), and Trumpler 15 (O-027) can be considered real clusters, while the rest have to be considered as sub-associations within Car OB1. Since we do not have enough multi-period information for our spectral sample, we cannot identify SB1 stars properly (as in Paper I). Thus, we do not include a discussion of their distribution as a separate group.
For Trumpler 14, we derive very young ages for two of their members (HD 93128 and HD 93129 B, the O3.5 V stars that are discussed in the previous section), which are located very close to (or on) the ZAMS below the 1 Myr isochrone. This agrees with the results of other authors (see Sana et al. 2010) who estimated an age of 0.3–0.5 Myr for Trumpler 14 through infrared observations of pre-main-sequence stars. The rest of the cluster members are all younger than 3 Myr, with a mean age value of 1.6 ± 0.9 Myr. This could indicate different bursts of star formation, as most massive stars reach the ZAMS more rapidly or a single, extended burst. Only for Collinder 232 do we find a younger mean age of 0.7 ± 0.4 Myr. However, we note that only two members are used for the statistics, so this result is of little significance at the moment. The same happens for Trum- pler 16W, for which a mean value of 2.2 ± 0.1 Myr is derived from just two objects. For Trumpler 16E, Collinder 228, and Bochum 11 we derive mean values consistent with 2.4 ± 1.4, 2.6 ± 1.4, and 2.6 ± 1.3 Myr. The oldest cluster is Trumpler 15, with an age of 3.6 ± 1.6 Myr. However, considering the derived errors, we cannot confirm a significant difference. We also note that there is not any evident relation between projected fast rotation and age. Seven stars rotate at v sin i ≥200 km s−1 and four of them have ages of <3 Myr. If these stars were born with high initial rotational velocities (contrary to our assumption), it is possible that we have underestimated their ages. Alternatively, they may be the product of post-interaction binarity and appear rejuvenated as a consequence. A detailed abundance analysis will be required to disentangle these possibilities (with no guarantee of success).
Overall, we confirm that Car OB1 is one of the youngest regions of the Galaxy, as confirmed by its age distribution that peaks at 1 Myr (see the histogram of Fig. 6). We also see a secondary peak at 4–5 Myr that could indicate a previous burst of star formation in the region. Only Trumpler 14, Trumpler 16W, and Collinder 232 (the last two with only two objects each) do not have objects contributing to this secondary peak, which reinforces the young character of Trumpler 14. Connecting with the previous section, an infrared (IR) search of young embedded O4–O5 stars should begin by Trumpler 14.
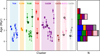 |
Fig. 6 Age distribution (derived using the BONNSAI tool) for members of different clusters analyzed in this work: Trumpler 14 (Villafranca O- 002 group, in blue), Trumpler 16 W (Villafranca O-003, in orange), Trumpler 16 E (Villafranca O-025, in green), Trumpler 15 (Villafranca O-027, in red), Collinder 228 (Villafranca O-028, in purple), Collinder 232 (Villafranca O-029, in brown), and Bochum 11 (Villafranca O-030, in pink). Those stars just falling in the gaps between defined groups are simply indicated as Car OB1 members (in gray). Black stars indicate stars stars rotating at v sin i > 200 km s−1. |
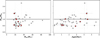 |
Fig. 7 Msp/Mev relation against Mev (left) and age (right) for our sample of O-stars in Car OB1. Evolutionary masses were obtained from the BONNSAI tool (using nonrotating evolutionary Bonn tracks at solar metallicity). Solid black lines indicate the relation Msp/Mev = 1. Squares and red points indicate the fast-rotating objects with v sin i > 200 km s−1. |
4.5 Masses
The discrepancy between evolutionary and spectroscopic masses in O-type stars (known as the mass-discrepancy problem) has been widely discussed in previous studies of O-type stars (e.g., Herrero et al. 1992, 2002; Massey et al. 2005; Mokiem et al. 2007; Martins et al. 2012; Mahy et al. 2015, 2020; Tkachenko et al. 2020; Sabín-Sanjulián et al. 2017). Furthermore, it has also been found in B-type stars (e.g., Searle et al. 2008) and studies of OB stars in the Small Magellanic Cloud (which theoretically would mitigate the dependence on the distance) also report the mass discrepancy (Bouret et al. 2021; Bernini-Peron et al. 2024). The spectroscopic mass (Msp) is derived by analyzing the spectrum with stellar atmosphere models, while the evolutionary mass (Mev) is obtained by comparing the position of a star in the HR or log g − Teff diagrams with theoretical evolutionary tracks. Some authors find the inferred evolutionary masses significantly higher than the derived spectroscopic ones. However, others find the opposite discrepancy, a relatively good agreement, or no compelling evidence for a systematic mass discrepancy. Inaccurate distances, the treatment of mass loss, the need for turbulent pressure in stellar atmosphere models, and the treatment of overshooting, rotation, and/or binary evolution in the evolutionary models (e.g., Mokiem et al. 2007; Massey et al. 2012; Markova et al. 2018; Mahy et al. 2020; González-Torà et al. 2025) have been proposed as possible explanations. Nonetheless, there is not yet a firm consensus regarding this problem.
As in Sect. 4.4, the BONNSAI tool provides us with the predicted evolutionary mass (Mev) for the sample of the stars analyzed in this work. In Fig. 7, we show the Msp /Mev relation against Mev (left) and age (right) for our sample stars, indicating with squares and red points the fast-rotating objects (v sin i > 200 km s−1), where spectroscopic masses have been derived using the gravity corrected from centrifugal acceleration. We find a clear trend of Msp/Mev < 1.0 mainly for less massive O-type stars (those with Mev ≤ 40 M⊙, in agreement with results from Herrero et al. (1992) for Galactic O stars and Sabín-Sanjulián et al. (2017) in the LMC. For stars with higher masses, we find both positive and negative discrepancies in similar proportions between evolutionary and spectroscopic masses. We find no systematic trends with projected rotational velocity, with almost half of the fast rotating sample showing the mass discrepancy. We also did not find any trends on age. Considering derived uncertainties, we cannot conclude any obvious systematic pattern on our sample.
5 Conclusions
We performed quantitative spectroscopic analysis for the sample of O stars in Car OB1 from Paper I for which spectral data are available. We provide rotational parameters for the sample of O stars in Carina using available high-quality spectra. Stellar parameters are also derived for these stars and those for which only low-resolution spectra are available. Benefiting from Gaia DR3 astrometry and inferred cluster distances, we also determined main physical parameters, including ages. The main results of this work are summarized below.
We obtained representative distribution of rotational velocities for the sample of 37 O-type stars in Carina using high-resolution spectra from GES and OWN surveys. We find the low-velocity peak at 60 km s−1 and a tail of fast rotators above 200 km s−1, as expected from previous studies in other galactic and extragalactic regions. The distributions show a bimodal structure, which is more clear when we consider B0 types, although a shorter tail of fast rotators is found in Carina. A similar pattern was found in the Cygnus OB2 association, but considering the relatively small size of our sample (thus large uncertainties) and the young age of Carina, it may imply insufficient time for binary interactions to produce such an extended tail of fast rotators;
We constructed the HRD and found the O population in Car OB1 to be well constrained between 0 and 5 Myr. Using the BONNSAI tool, we derived individual ages for all analyzed members, obtaining an age distribution peaking at 1 Myr. It confirms Car OB1, and specifically Trumpler 14, as one of the youngest regions of the Galaxy, as suggested by other authors. Another secondary peak at 4–5 Myr could indicate a previous burst of star formation in the region;
We also placed the sample of O stars in the so-called spectroscopic HRD and noted an evident lack of stars close to the ZAMS above 25 M⊙ , as reported by other authors. We checked that, although attenuated, the reported gap is still present in Carina when constructing the HRD (between ~32–55 M⊙). Given the inhomogeneous visual extinction present in the nebula and the lack of known dwarfs of types O4–O5, further study is required to uncover the possible heavily obscured massive population in Car OB1 that might be producing the mentioned gap;
We found a clear trend to obtain evolutionary masses higher than derived spectroscopic masses for stars with Mev ≤ 40 M⊙, something previously reported in other samples of massive stars and known as the “mass discrepancy problem”. However, we find no systematic trends with rotational velocity and age, and considering derived uncertainties we cannot conclude any obvious systematic pattern on our sample.
Acknowledgements
This paper is based on data products from observations made with ESO Telescopes at the La Silla Paranal Observatory under programme ID 188.B-3002. These data products have been processed by the Cambridge Astronomy Survey Unit (CASU) at the Institute of Astronomy, University of Cambridge, and by the FLAMES/UVES reduction team at INAF/Osservatorio Astrofisico di Arcetri. These data have been obtained from the Gaia-ESO Survey Data Archive, prepared and hosted by the Wide Field Astronomy Unit, Institute for Astronomy, University of Edinburgh, which is funded by the UK Science and Technology Facilities Council. This work was partly supported by the European Union FP7 programme through ERC grant number 320360 and by the Leverhulme Trust through grant RPG-2012-541. We acknowledge the support from INAF and Ministero dell’ Istruzione, dell’ Università’ e della Ricerca (MIUR) in the form of the grant “Premiale VLT 2012”. The results presented here benefit from discussions held during the Gaia-ESO workshops and conferences supported by the ESF (European Science Foundation) through the GREAT Research Network Programme. This work has made use of data from the European Space Agency (ESA) mission Gaia, processed by the Gaia Data Processing and Analysis Consortium (DPAC). Funding for the DPAC has been provided by national institutions, in particular the institutions participating in the Gaia Multilateral Agreement. The Gaia data is processed with the computer resources at Mare Nostrum and the technical support provided by BSC-CNS. S.R.B. and A.H. acknowledge funding from the Spanish Ministry of Science and Innovation (MICINN) through the Spanish State Research Agency through grants PID2021-122397NB-C21, and the Severo Ochoa Programme 2020-2024 (CEX2019-000920-S). S.R.B. also acknowledges financial support by NextGeneration EU/PRTR and MIU (UNI/551/2021) trough grant Margarita Salas-ULL. A.H. acknowledges ESO for its hospitality during his stay as Unpaid Associate in 2022. I.N. is partially supported by the Spanish Government Ministerio de Ciencia, Innovación y Universidades and Agencia Estatal de Investigación (MCIU/AEI/10.130 39/501 100 011 033/FEDER, UE) under grant PID2021-122397NB-C22, and by MCIU with funding from the European Union NextGenerationEU and Generalitat Valenciana in the call Pro- grama de Planes Complementarios de I+D+i (PRTR 2022), project HIAMAS, reference ASFAE/2022/017, and NextGeneration EU/PRTR. S.D. acknowledges CNPq/MCTI for grant 306859/2022-0. J.M.A. and M.P.G. acknowledge support from the Spanish Government Ministerio de Ciencia e Innovación through grants PGC2018-095 049-B-C22 and PID2022-136 640 NB-C22 and from the Consejo Superior de Investigaciones Científicas (CSIC) through grant 2022-AEP 005.
Appendix A Tables
In this appendix we present derived parameters for the O and B0 population of Car OB1 analyzed in this work. Tables A.1 and A.2 list the projected rotational velocities, spectroscopic, and physical parameters for the sample of 37 O-type stars for which high resolution spectra are available. Table A.3 lists the stellar and physical parameters for those stars for which only low-resolution spectra are available from GOSSS. Table A.4 lists the rotational parameters for the sample of B0 stars included in the distribution of rotational velocities.
Spectroscopic parameters for the O stars analyzed in this work and for which high-resolution spectra are available.
Physical parameters for the O stars analyzed in this work and for which high-resolution spectra are available.
Derived tellar and physical parameters for those stars for which only low-resolution spectra are available from GOSSS
Rotational velocities for the sample of single B0 stars analyzed in this work and for which high-resolution spectra are available.
Appendix B Best-fitting models
In this appendix we show an example of the online material available at the Zenodo open-access repository (http://doi.org/10.5281/zenodo.14768288). We present the FASTWIND best-fitting model to the observed spectra for one star of the Car OB1 O-type population analyzed in this work (CPD -59 2627). The observed spectra (in black) is overplotted to the best-fitting model (in red) resulting from the iacob-gbat analysis. Each star is labeled with its name and the model. He I, He II and H lines are indicated with solid, dashed and dotted short vertical lines, respectively.
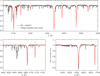 |
Fig. B.1 The observed spectrum of CPD -59 2627 (in black) overplotted to the best-fitting model (in red) resulting from the iacob-gbat analysis. He I, He II and H lines are indicated with solid, dashed and dotted short green vertical lines, respectively. |
References
- Alexander, M. J., Hanes, R. J., Povich, M. S., & McSwain, M. V. 2016, AJ, 152, 190 [Google Scholar]
- Barbá, R., Gamen, R., Arias, J. I., et al. 2014, in Revista Mexicana de Astronomia y Astrofisica Conference Series, 44, 148 [Google Scholar]
- Barbá, R. H., Gamen, R., Arias, J. I., et al. 2010, in Revista Mexicana de Astronomia y Astrofisica Conference Series, 38, 30 [Google Scholar]
- Barbá, R. H., Gamen, R., Arias, J. I., & Morrell, N. I. 2017, in The Lives and Death-Throes of Massive Stars, 329, eds. J. J. Eldridge, J. C. Bray, L. A. S. McClelland, & L. Xiao, 89 [Google Scholar]
- Berlanas, S. R., Herrero, A., Martins, F., et al. 2017, in Highlights on Spanish Astrophysics IX, eds. S. Arribas, A. Alonso-Herrero, F. Figueras, et al., 453 [Google Scholar]
- Berlanas, S. R., Herrero, A., Comerón, F., et al. 2018, A&A, 612, A50 [NASA ADS] [CrossRef] [EDP Sciences] [Google Scholar]
- Berlanas, S. R., Herrero, A., Comerón, F., et al. 2020, A&A, 642, A168 [NASA ADS] [CrossRef] [EDP Sciences] [Google Scholar]
- Berlanas, S. R., Maíz Apellániz, J., Herrero, A., et al. 2023, A&A, 671, A20 [NASA ADS] [CrossRef] [EDP Sciences] [Google Scholar]
- Bernini-Peron, M., Sander, A. A. C., Ramachandran, V., et al. 2024, A&A, 692, A89 [NASA ADS] [CrossRef] [EDP Sciences] [Google Scholar]
- Blomme, R., Daflon, S., Gebran, M., et al. 2022, A&A, 661, A120 [NASA ADS] [CrossRef] [EDP Sciences] [Google Scholar]
- Bouret, J. C., Martins, F., Hillier, D. J., et al. 2021, A&A, 647, A134 [NASA ADS] [CrossRef] [EDP Sciences] [Google Scholar]
- Brott, I., de Mink, S. E., Cantiello, M., et al. 2011, A&A, 530, A115 [NASA ADS] [CrossRef] [EDP Sciences] [Google Scholar]
- Castro, N., Fossati, L., Langer, N., et al. 2014, A&A, 570, L13 [NASA ADS] [CrossRef] [EDP Sciences] [Google Scholar]
- Damiani, F., Klutsch, A., Jeffries, R. D., et al. 2017, A&A, 603, A81 [NASA ADS] [CrossRef] [EDP Sciences] [Google Scholar]
- de Mink, S. E., Langer, N., Izzard, R. G., Sana, H., & de Koter, A. 2013, ApJ, 764, 166 [Google Scholar]
- de Mink, S. E., Sana, H., Langer, N., Izzard, R. G., & Schneider, F. R. N. 2014, ApJ, 782, 7 [Google Scholar]
- Dufton, P. L., Langer, N., Dunstall, P. R., et al. 2013, A&A, 550, A109 [NASA ADS] [CrossRef] [EDP Sciences] [Google Scholar]
- Ekström, S., Georgy, C., Eggenberger, P., et al. 2012, A&A, 537, A146 [Google Scholar]
- Evans, C. J., Taylor, W. D., Hénault-Brunet, V., et al. 2011, A&A, 530, A108 [NASA ADS] [CrossRef] [EDP Sciences] [Google Scholar]
- Gaia Collaboration (Brown, A. G. A., et al.) 2021, A&A, 649, A1 [NASA ADS] [CrossRef] [EDP Sciences] [Google Scholar]
- García-Vargas, M. L., Carrasco, E., Mollá, M., et al. 2020, MNRAS, 493, 871 [CrossRef] [Google Scholar]
- Gilmore, G., Randich, S., Worley, C. C., et al. 2022, A&A, 666, A120 [NASA ADS] [CrossRef] [EDP Sciences] [Google Scholar]
- González-Torà, G., Sander, A. A. C., Sundqvist, J. O., et al. 2025, A&A, 694, A269 [NASA ADS] [CrossRef] [EDP Sciences] [Google Scholar]
- Gray, D. F. 2008, The Observation and Analysis of Stellar Photospheres (Cambridge, UK: Cambridge University Press) [Google Scholar]
- Gruner, D., Hainich, R., Sander, A. A. C., et al. 2019, A&A, 621, A63 [NASA ADS] [CrossRef] [EDP Sciences] [Google Scholar]
- Hanes, R. J., McSwain, M. V., & Povich, M. S. 2018, AJ, 155, 190 [Google Scholar]
- Hanson, M. M., Rieke, G. H., & Luhman, K. L. 1998, AJ, 116, 1915 [NASA ADS] [CrossRef] [Google Scholar]
- Herrero, A. 2016, in Multi-Object Spectroscopy in the Next Decade: Big Questions, Large Surveys, and Wide Fields, eds. I. Skillen, M. Balcells, & S. Trager, Astronomical Society of the Pacific Conference Series, 507, 135 [NASA ADS] [Google Scholar]
- Herrero, A., Kudritzki, R. P., Vilchez, J. M., et al. 1992, in The Atmospheres of Early-Type Stars, eds. U. Heber, & C. S. Jeffery, Lecture Notes in Physics: (Berlin Springer Verlag) 401, 21 [Google Scholar]
- Herrero, A., Puls, J., & Najarro, F. 2002, A&A, 396, 949 [CrossRef] [EDP Sciences] [Google Scholar]
- Herrero, A., Simon-Diaz, S., Najarro, F., & Ribas, I. 2007, in Massive Stars in Interactive Binaries, eds. N. St.-Louis, & A. F. J. Moffat, Astronomical Society of the Pacific Conference Series, 367, 67 [NASA ADS] [Google Scholar]
- Higgins, E. R., & Vink, J. S. 2019, A&A, 622, A50 [NASA ADS] [CrossRef] [EDP Sciences] [Google Scholar]
- Holgado, G., Simón-Díaz, S., Barbá, R. H., et al. 2018, aap, 613, A65 [Google Scholar]
- Holgado, G., Simón-Díaz, S., Haemmerlé, L., et al. 2020, A&A, 638, A157 [NASA ADS] [CrossRef] [EDP Sciences] [Google Scholar]
- Holgado, G., Simón-Díaz, S., Herrero, A., & Barbá, R. H. 2022, A&A, 665, A150 [NASA ADS] [CrossRef] [EDP Sciences] [Google Scholar]
- Kiminki, M. M., & Smith, N. 2018, MNRAS, 477, 2068 [Google Scholar]
- Kudritzki, R. P. 1980, A&A, 85, 174 [Google Scholar]
- Langer, N. 2012, ARA&A, 50, 107 [CrossRef] [Google Scholar]
- Langer, N., & Kudritzki, R. P. 2014, A&A, 564, A52 [NASA ADS] [CrossRef] [EDP Sciences] [Google Scholar]
- Lanz, T., & Hubeny, I. 2007, ApJS, 169, 83 [CrossRef] [Google Scholar]
- Lindegren, L., Hernández, J., Bombrun, A., et al. 2018, A&A, 616, A2 [NASA ADS] [CrossRef] [EDP Sciences] [Google Scholar]
- Lindegren, L., Bastian, U., Biermann, M., et al. 2021, A&A, 649, A4 [EDP Sciences] [Google Scholar]
- Mahy, L., Rauw, G., De Becker, M., Eenens, P., & Flores, C. A. 2015, A&A, 577, A23 [NASA ADS] [CrossRef] [EDP Sciences] [Google Scholar]
- Mahy, L., Almeida, L. A., Sana, H., et al. 2020, A&A, 634, A119 [NASA ADS] [CrossRef] [EDP Sciences] [Google Scholar]
- Maíz Apellániz, J. 2001, AJ, 121, 2737 [Google Scholar]
- Maíz Apellániz, J. 2005, in The Three-Dimensional Universe with Gaia, eds. C. Turon, K. S. O’Flaherty, & M. A. C. Perryman, ESA Special Publication, 576, 179 [Google Scholar]
- Maíz Apellániz, J. 2022, A&A, 657, A130 [NASA ADS] [CrossRef] [EDP Sciences] [Google Scholar]
- Maíz Apellániz, J., & Barbá, R. H. 2018, A&A, 613, A9 [Google Scholar]
- Maíz Apellániz, J., Alfaro, E. J., & Sota, A. 2008, arXiv e-prints [arXiv:0804.2553] [Google Scholar]
- Maíz Apellániz, J., Sota, A., Walborn, N. R., et al. 2011, in Highlights of Spanish Astrophysics VI, eds. M. R. Zapatero Osorio, J. Gorgas, J. Maíz Apellániz, J. R. Pardo, & A. Gil de Paz, 467 [Google Scholar]
- Maíz Apellániz, J., Sana, H., Barbá, R. H., Le Bouquin, J. B., & Gamen, R. C. 2017, MNRAS, 464, 3561 [Google Scholar]
- Maíz Apellániz, J., Trigueros Páez, E., Jiménez Martínez, I., et al. 2019a, in HSA 10, 420 [Google Scholar]
- Maíz Apellániz, J., Trigueros Páez, E., Negueruela, I., et al. 2019b, A&A, 626, A20 [NASA ADS] [CrossRef] [EDP Sciences] [Google Scholar]
- Maíz Apellániz, J., Crespo Bellido, P., Barbá, R. H., Fernández Aranda, R., & Sota, A. 2020, A&A, 643, A138 [NASA ADS] [CrossRef] [EDP Sciences] [Google Scholar]
- Maíz Apellániz, J., Barbá, R. H., Fariña, C., et al. 2021, A&A, 646, A11 [NASA ADS] [CrossRef] [EDP Sciences] [Google Scholar]
- Maíz Apellániz, J., Barbá, R. H., Fernández Aranda, R., et al. 2022, A&A, 657, A131 [NASA ADS] [CrossRef] [EDP Sciences] [Google Scholar]
- Maíz Apellániz, J., Barbá, R. H., Molina Lera, J. A., Lambarri Martínez, A., & Fernández Aranda, R. 2024, arXiv e-prints [arXiv:2407.21399] [Google Scholar]
- Markova, N., Puls, J., & Langer, N. 2018, A&A, 613, A12 [NASA ADS] [CrossRef] [EDP Sciences] [Google Scholar]
- Martins, F., & Palacios, A. 2013, A&A, 560, A16 [NASA ADS] [CrossRef] [EDP Sciences] [Google Scholar]
- Martins, F., & Plez, B. 2006, A&A, 457, 637 [NASA ADS] [CrossRef] [EDP Sciences] [Google Scholar]
- Martins, F., Schaerer, D., & Hillier, D. J. 2005, A&A, 436, 1049 [NASA ADS] [CrossRef] [EDP Sciences] [Google Scholar]
- Martins, F., Mahy, L., Hillier, D. J., & Rauw, G. 2012, A&A, 538, A39 [NASA ADS] [CrossRef] [EDP Sciences] [Google Scholar]
- Massey, P., Puls, J., Pauldrach, A. W. A., et al. 2005, ApJ, 627, 477 [NASA ADS] [CrossRef] [Google Scholar]
- Massey, P., Morrell, N. I., Neugent, K. F., et al. 2012, ApJ, 748, 96 [NASA ADS] [CrossRef] [Google Scholar]
- Menon, A., Ercolino, A., Urbaneja, M. A., et al. 2024, ApJ, 963, L42 [NASA ADS] [CrossRef] [Google Scholar]
- Mohr-Smith, M., Drew, J. E., Napiwotzki, R., et al. 2017, MNRAS, 465, 1807 [Google Scholar]
- Mokiem, M. R., de Koter, A., Vink, J. S., et al. 2007, A&A, 473, 603 [NASA ADS] [CrossRef] [EDP Sciences] [Google Scholar]
- Monet, D. G., Levine, S. E., Canzian, B., et al. 2003, AJ, 125, 984 [Google Scholar]
- Negueruela, I., Marco, A., Herrero, A., & Clark, J. S. 2008, A&A, 487, 575 [NASA ADS] [CrossRef] [EDP Sciences] [Google Scholar]
- Puls, J., Urbaneja, M. A., Venero, R., et al. 2005, A&A, 435, 669 [NASA ADS] [CrossRef] [EDP Sciences] [Google Scholar]
- Rainot, A., Reggiani, M., Sana, H., Bodensteiner, J., & Absil, O. 2022, A&A, 658, A198 [NASA ADS] [CrossRef] [EDP Sciences] [Google Scholar]
- Ramírez-Agudelo, O. H., Simón-Díaz, S., Sana, H., et al. 2013, A&A, 560, A29 [NASA ADS] [CrossRef] [EDP Sciences] [Google Scholar]
- Ramírez-Agudelo, O. H., Sana, H., de Koter, A., et al. 2017, A&A, 600, A81 [NASA ADS] [CrossRef] [EDP Sciences] [Google Scholar]
- Randich, S., Gilmore, G., Magrini, L., et al. 2022, A&A, 666, A121 [NASA ADS] [CrossRef] [EDP Sciences] [Google Scholar]
- Repolust, T., Puls, J., & Herrero, A. 2004, A&A, 415, 349 [NASA ADS] [CrossRef] [EDP Sciences] [Google Scholar]
- Rieke, G. H., & Lebofsky, M. J. 1985, ApJ, 288, 618 [Google Scholar]
- Rivero González, J. G., Puls, J., Massey, P., & Najarro, F. 2012, A&A, 543, A95 [NASA ADS] [CrossRef] [EDP Sciences] [Google Scholar]
- Sabín-Sanjulián, C., Simón-Díaz, S., Herrero, A., et al. 2017, A&A, 601, A79 [NASA ADS] [CrossRef] [EDP Sciences] [Google Scholar]
- Sana, H., Momany, Y., Gieles, M., et al. 2010, A&A, 515, A26 [NASA ADS] [CrossRef] [EDP Sciences] [Google Scholar]
- Sana, H., de Mink, S. E., de Koter, A., et al. 2012, Science, 337, 444 [Google Scholar]
- Santolaya-Rey, A. E., Puls, J., & Herrero, A. 1997, A&A, 323, 488 [NASA ADS] [Google Scholar]
- Schneider, F. R. N., Langer, N., de Koter, A., et al. 2014, A&A, 570, A66 [NASA ADS] [CrossRef] [EDP Sciences] [Google Scholar]
- Schneider, N., Bontemps, S., Motte, F., et al. 2016, A&A, 591, A40 [NASA ADS] [CrossRef] [EDP Sciences] [Google Scholar]
- Scholz, F. W., & Stephens, M. A. 1987, J. Am. Statist. Assoc., 82, 918 [Google Scholar]
- Schootemeijer, A., Langer, N., Lennon, D., et al. 2021, A&A, 646, A106 [NASA ADS] [CrossRef] [EDP Sciences] [Google Scholar]
- Searle, S. C., Prinja, R. K., Massa, D., & Ryans, R. 2008, A&A, 481, 777 [NASA ADS] [CrossRef] [EDP Sciences] [Google Scholar]
- Simón-Díaz, S., & Herrero, A. 2007, A&A, 468, 1063 [NASA ADS] [CrossRef] [EDP Sciences] [Google Scholar]
- Simón-Díaz, S., & Herrero, A. 2014, A&A, 562, A135 [NASA ADS] [CrossRef] [EDP Sciences] [Google Scholar]
- Simón-Díaz, S., Castro, N., Garcia, M., Herrero, A., & Markova, N. 2011, Bull. Soc. Roy. Sci. Liege, 80, 514 [Google Scholar]
- Simón-Díaz, S., Castro, N., Herrero, A., et al. 2011, in Journal of Physics Conference Series, 328, 012021 [CrossRef] [Google Scholar]
- Skrutskie, M. F., Cutri, R. M., Stiening, R., et al. 2006, AJ, 131, 1163 [NASA ADS] [CrossRef] [Google Scholar]
- Smith, N., & Brooks, K. J. 2008, in Handbook of Star Forming Regions, Volume II, 5, ed. B. Reipurth, 138 [Google Scholar]
- Sota, A., Maíz Apellániz, J., Morrell, N. I., et al. 2014, ApJS, 211, 10 [Google Scholar]
- Sundqvist, J. O., Simón-Díaz, S., Puls, J., & Markova, N. 2013, A&A, 559, L10 [NASA ADS] [CrossRef] [EDP Sciences] [Google Scholar]
- Tkachenko, A., Pavlovski, K., Johnston, C., et al. 2020, A&A, 637, A60 [NASA ADS] [CrossRef] [EDP Sciences] [Google Scholar]
- Voss, R., Martin, P., Diehl, R., et al. 2012, A&A, 539, A66 [NASA ADS] [CrossRef] [EDP Sciences] [Google Scholar]
- Wright, N. J., Drew, J. E., & Mohr-Smith, M. 2015, MNRAS, 449, 741 [NASA ADS] [CrossRef] [Google Scholar]
The following optical diagnostic lines were considered for the analysis of our stellar samples (whenever present): Hα, Hβ, Hγ, Hδ, He I+II 4026, He I 4387, He I 4471, He I 4713, He I 4922, He I 6678, He II 4200, He II 4541, He II 4686, and He II 5411.
http://research.cs.wisc.edu/htcondor/: the supercomputer facility at Instituto de Astrofisica de Canarias.
ɡtrue = ɡ + ɡcent = ɡ + (Vrotsini)2/R*; see Herrero et al. (1992) and Repolust et al. (2004).
We note that the internal Gaia DR3 parallax uncertainties are underestimated and have to be converted into external uncertainties; see Maíz Apellániz et al. (2021) and Maíz Apellániz (2022).
Background and foreground members have been excluded.
Actually, the effect of a lower v sin i on the line width can be determined.
The ℒ parameter is defined in terms of effective temperature and surface gravity as  , which is equivalent to the L/M ratio.
The same happens for HD 93128, but without a difference between the luminosities derived by Holgado et al. and ours.
All Tables
Spectroscopic parameters for the O stars analyzed in this work and for which high-resolution spectra are available.
Physical parameters for the O stars analyzed in this work and for which high-resolution spectra are available.
Derived tellar and physical parameters for those stars for which only low-resolution spectra are available from GOSSS
Rotational velocities for the sample of single B0 stars analyzed in this work and for which high-resolution spectra are available.
All Figures
|
Fig. 1 Comparison of v sin i values for sample of O stars analyzed in this work and resulting from either the FT or the GOF analysis provided by the iacob-broad tool. Dashed lines represent a difference of 20 km s−1 or 20% from the 1:1 relation, whichever is largest. Different colors and symbols indicate the diagnostic lines used for the line-broadening characterization. |
| In the text | |
|
Fig. 2 Distribution of rotational velocities of final sample of OB stars analyzed in this work. Left: rotational velocities for sample of 22 and 15 O-type stars in Carina from GES (turquoise) and OWN (green) catalogs, respectively. Middle: normalized distribution for same sample of 37 O-type stars for which high-resolution spectra are available. The red line represents a kernel density estimation using Gaussian kernels. Right: distribution for same sample of 37 O-type stars (light blue) but including 27 B0-type stars identified in the GES catalog (dark blue). |
| In the text | |
|
Fig. 3 Normalized distribution of rotational velocities of final sample of O-stars in Carina presented in this work compared to the distribution of O-stars found in the Cygnus OB2 association by Berlanas et al. (2020) (left), the Milky Way by Holgado et al. (2022) (middle), and in 30 Doradus by Ramírez-Agudelo et al. (2013) (right). |
| In the text | |
|
Fig. 4 HRDs for sample of 47 O-type stars in Carina using rotating Geneva (Ekström et al. 2012, bottom panel) and nonrotating Bonn (Brott et al. 2011, top panel) evolutionary stellar tracks and isochrones. |
| In the text | |
|
Fig. 5 Spectroscopic HRD for sample of O stars in Car OB1 using Geneva rotating evolutionary stellar tracks and isochrones. The triangles indicate upper limits for log g. |
| In the text | |
|
Fig. 6 Age distribution (derived using the BONNSAI tool) for members of different clusters analyzed in this work: Trumpler 14 (Villafranca O- 002 group, in blue), Trumpler 16 W (Villafranca O-003, in orange), Trumpler 16 E (Villafranca O-025, in green), Trumpler 15 (Villafranca O-027, in red), Collinder 228 (Villafranca O-028, in purple), Collinder 232 (Villafranca O-029, in brown), and Bochum 11 (Villafranca O-030, in pink). Those stars just falling in the gaps between defined groups are simply indicated as Car OB1 members (in gray). Black stars indicate stars stars rotating at v sin i > 200 km s−1. |
| In the text | |
|
Fig. 7 Msp/Mev relation against Mev (left) and age (right) for our sample of O-stars in Car OB1. Evolutionary masses were obtained from the BONNSAI tool (using nonrotating evolutionary Bonn tracks at solar metallicity). Solid black lines indicate the relation Msp/Mev = 1. Squares and red points indicate the fast-rotating objects with v sin i > 200 km s−1. |
| In the text | |
|
Fig. B.1 The observed spectrum of CPD -59 2627 (in black) overplotted to the best-fitting model (in red) resulting from the iacob-gbat analysis. He I, He II and H lines are indicated with solid, dashed and dotted short green vertical lines, respectively. |
| In the text | |
Current usage metrics show cumulative count of Article Views (full-text article views including HTML views, PDF and ePub downloads, according to the available data) and Abstracts Views on Vision4Press platform.
Data correspond to usage on the plateform after 2015. The current usage metrics is available 48-96 hours after online publication and is updated daily on week days.
Initial download of the metrics may take a while.