Fig. 2
Download original image
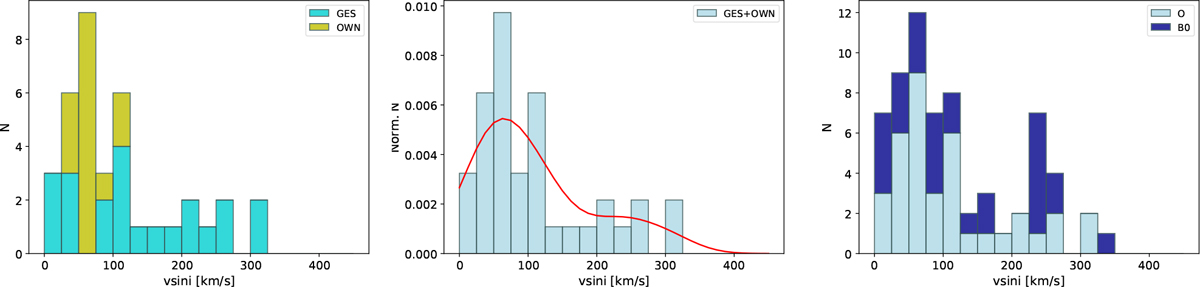
Distribution of rotational velocities of final sample of OB stars analyzed in this work. Left: rotational velocities for sample of 22 and 15 O-type stars in Carina from GES (turquoise) and OWN (green) catalogs, respectively. Middle: normalized distribution for same sample of 37 O-type stars for which high-resolution spectra are available. The red line represents a kernel density estimation using Gaussian kernels. Right: distribution for same sample of 37 O-type stars (light blue) but including 27 B0-type stars identified in the GES catalog (dark blue).
Current usage metrics show cumulative count of Article Views (full-text article views including HTML views, PDF and ePub downloads, according to the available data) and Abstracts Views on Vision4Press platform.
Data correspond to usage on the plateform after 2015. The current usage metrics is available 48-96 hours after online publication and is updated daily on week days.
Initial download of the metrics may take a while.