| Issue |
A&A
Volume 695, March 2025
|
|
|---|---|---|
| Article Number | A244 | |
| Number of page(s) | 12 | |
| Section | Interstellar and circumstellar matter | |
| DOI | https://doi.org/10.1051/0004-6361/202453173 | |
| Published online | 25 March 2025 | |
Chemistry and ro-vibrational excitation of HeH+ in the Planetary Nebula NGC 7027
1
Univ. Grenoble Alpes, CNRS, IPAG,
38000
Grenoble,
France
2
Univ Rennes, CNRS,
IPR (Institut de Physique de Rennes) – UMR 6251,
35000
Rennes, France
3
Max-Planck-Institut für Radioastronomie,
Auf dem Hügel 69,
53121
Bonn, Germany
4
KU Leuven, Department of Chemistry,
3001
Leuven,
Belgium
5
J. Heyrovský Institute of Physical Chemistry, Academy of Sciences,
Dolejškova 2155/3,
182 23
Prague 8, Czech Republic
★ Corresponding authors; milansil93@gmail.com; alexandre.faure@univ-grenoble-alpes.fr
Received:
26
November
2024
Accepted:
21
February
2025
Context. The helium hydride cation (HeH+) holds the distinction of being the first molecule to form in the metal-free Universe after the Big Bang. Following its first circumstellar detection via the pure rotational J = 1 → 0 transition in the young and dense planetary nebula NGC 7027, its presence is further confirmed by detecting the υ = 1 → 0 P(l) and P(2) ro-vibrational line emissions.
Aims. HeH+ belongs to the class of “reactive” ions that can be destroyed so quickly that chemical formation and destruction rates may compete with inelastic rates and should be considered when solving the statistical equilibrium equations. This so-called chemical “pumping” or “excitation” effect is investigated here for the first time in HeH+.
Methods. The chemical evolution of HeH+ in NGC 7027 is modeled with the CLOUDY photoionization code using updated reaction rate coefficients. The electron temperature and atomic-molecular densities are modeled as a function of position in the nebula. The non-local thermodynamic equilibrium (NLTE) analysis of the three observed HeH+ emission lines is then performed with the CLOUDY and RADEX codes using an extensive set of spectroscopic and inelastic collisional data suitable for the specific high-temperature environment of NGC 7027. In a second approach, chemical formation and destruction rates of HeH+ are implemented in RADEX. This code is combined with a Markov Chain Monte Carlo (MCMC) sampling (performed on the RADEX-parameters space) in order to extract the best-fit HeH+ column density and physical conditions from the observed line fluxes.
Results. The CLOUDY and RADEX NLTE results are found to be in good agreement, and they reproduce the observed HeH+ line fluxes to within a factor of 2–5, and the υ = 1 → 0 P(2)/P(l) line ratio to better than 20%. Agreement to better than a factor of 2.3 is obtained when including the reaction between He(23S) and H as an additional source of HeH+ in the chemical model. The RADEX-MCMC model with chemical pumping is found to reproduce both the observed line fluxes and the line ratio to 20%. However, while the best-fit parameters agree rather well with the model predictions, the posterior distributions are poorly constrained, suggesting that additional HeH+ lines must be detected in NGC 7027 to better constrain the physical conditions via NLTE models. On the other hand, uncertainties in collisional (reactive and inelastic) data of HeH+ have been largely reduced in this work. We also show that the three observed lines are not sensitive to chemical pumping while excited “short-lived” levels are significantly overpopulated with respect to a NLTE model neglecting chemical excitation. The corresponding full-line spectrum predicted for NGC 7027 is provided.
Key words: astrochemistry / molecular data / molecular processes / radiative transfer / astronomical databases: miscellaneous / planetary nebulae: individual: NGC 7027
© The Authors 2025
 Open Access article, published by EDP Sciences, under the terms of the Creative Commons Attribution License (https://creativecommons.org/licenses/by/4.0), which permits unrestricted use, distribution, and reproduction in any medium, provided the original work is properly cited.
This article is published in open access under the Subscribe to Open model. Subscribe to A&A to support open access publication.
1 Introduction
The formation of a planetary nebula begins when an intermediate-mass star sheds its dusty asymptotic giant branch (AGB) envelope at a high rate. This stage is followed by the pre-planetary nebula phase, during which the central star, while still too cool to ionize its surroundings, drives fast energetic jets that shape the nebula. Within a few hundred years, the fast-moving, mass-losing star sweeps the AGB material into a dense shell and ionizes it, completing the formation of the planetary nebula with a thick shell and a partly hollow interior. NGC 7027 is a young, highly ionized, rapidly evolving, and extensively studied planetary nebula with a massive molecular envelope (Bublitz et al. 2023) within a distance ~1 kpc of the Sun (D = 980 + 100 pc; Zijlstra et al. 2008). The proper-motion analyses of the radio-frequency continuum emission from the inner elliptical shell indicate a kinematic age of ~600 years (Masson 1989; Zijlstra et al. 2008), whereas, based on multi-epoch Hubble Space Telescope imaging of the extended ring system, the nebular expansion analyses suggest a dynamical age between 1080–1620 years (Schönberner et al. 2018; Guerrero et al. 2020). However, both methods have inherent uncertainties, and the difference in ages derived from two different approaches suggests a multi-phase history for the nebula’s formation and evolution. The central star is exceptionally hot, with an effective temperature of about 198 kK and a significant bolometric luminosity of ~6.2 × 10³ LΘ (Latter et al. 2000; Moraga Baez et al. 2023). These parameters indicate that the central star originates from a progenitor of mass ≥3 MΘ. It has a present-day mass of ~0.6–0.7 MΘ (Moraga Baez et al. 2023), and left the AGB phase within the last ~1000 years (from the stellar evolution models in Weidmann et al. 2020). These extreme conditions lead to the formation of overlapping H and He Strömgren spheres, which drive the production of the helium hydride cation (HeH+, also known as hydro-helium cation) within a specific region where the He+ Strömgren sphere extends beyond the H+ (H II) zone (Güsten et al. 2019; Neufeld et al. 2020). Although HeH+ was initially identified in the laboratory a century ago (Hogness & Lunn 1925), the idea that it could exist in local astrophysical plasmas, particularly in planetary nebulae, was suggested more than four decades ago (Dabrowski & Herzberg 1977; Black 1978; Flower & Roueff 1979; Roberge & Dalgarno 1982).
The near-infrared emissions from the υ = 1 → 0 P(l) and P(2) ro-vibrational transitions of HeH+ are recently detected by Neufeld et al. (2020) in NGC 7027 planetary nebula using the iSHELL spectrograph on NASA’s Infrared Telescope Facility observations. This detection comes after the first-ever astrophysical identification of HeH+ reported by Güsten et al. (2019) using the GREAT instrument on the Stratospheric Observatory for Infrared Astronomy airborne observatory of its far-infrared / = 1 → 0 pure rotational transition toward the same target. The confirmation of HeH+ in nearby circumstellar space may provide important constraints on our understanding of the chemical network controlling its formation and destruction. The dominant formation channel of HeH+ in NGC 7027 involves the radiative association of He+ with neutral H1 and the associative ionization of neutral H with He in the metastable level 23S state. The dominant destruction channels are the reaction of HeH+ with H and electrons.
In agreement with earlier predictions, Güsten et al. (2019) and Neufeld et al. (2020) suggest that the prime region for the presence of HeH+ (abundance peak) is near the Strömgren radius of NGC 7027, where the physical conditions, such as electron density and temperature, abruptly change. However, modeling the intensity of the observed HeH+ lines has proven to be challenging. A comprehensive nonequilibrium chemical and level population model, conducted by Güsten et al. (2019), predicts that the main-beam brightness temperature of the HeH+ J = 1 → 0 line is approximately four times lower than the observed value. These authors suggest that this discrepancy could be resolved by adjusting the literature values of the rate coefficient for the radiative association process. Later, Neufeld et al. (2020) implement several changes to the chemistry adopted by Güsten et al. (2019) and, in particular, they find that the associative ionization between He(23S) and H is another significant source of HeH+. They predict a line flux for the HeH+ υ = 1 → 0 P(l) transition in very good agreement with the observed value. However, the measured fluxes of the J = 1 → 0 and υ = 1 → 0 P(2) lines are found to exceed the model predictions significantly by factors of 2.9 and 2.3, respectively. In addition, the observed υ = 1 → 0 P(2)/P(1) line ratio (1.34 ± 0.24) is significantly larger than the prediction (0.53).
In this work, we provide new rate coefficients for describing both the chemistry and excitation of HeH+ in the specific high-temperature environment of NGC 7027. This new molecular data covers all 162 bound levels of HeH+ and includes both state-to-state collisional inelastic (non-reactive) rate coefficients and state-resolved collisional reactive (formation and destruction) rate coefficients. The non-local thermodynamic equilibrium (NLTE) analysis of the observed HeH+ rotational and ro-vibrational emissions is first performed with the CLOUDY (Chatzikos et al. 2023) and RADEX (van der Tak et al. 2007) codes. Both codes utilize our newly constructed HeH+ collision data set for inelastic transitions. In a second approach, chemical pumping of HeH+ is implemented in RADEX and the observed line fluxes are fitted using Markov chain Monte Carlo (MCMC) sampling (Goodman & Weare 2010) performed on the parameter space, namely the kinetic temperature, the atomic hydrogen and electron densities, and the HeH+ column density. In Sect. 2, we report the predicted results of our NLTE model and compare them with the observed HeH+ line fluxes. Finally, in Sect. 3, we discuss our obtained results and the concluding remarks are summarized.
Physical parameters and corresponding values used in the CLOUDY model.
2 Modeling and results
2.1 CLOUDY modeling and results
The CLOUDY photoionization code (c23.01; Chatzikos et al. 2023, and references therein) is used to model the HeH+ abundance and interpret the observed line flux features in NGC 7027, similarly to Güsten et al. (2019); Neufeld et al. (2020), by approximating an elongated nebula as spherically symmetric and assuming dynamically young nebula in steady-state equilibrium.
2.1.1 Physical conditions
The physical model parameters are listed in Table 1. Our standard model is computed under the assumption of constant pressure, as in Neufeld et al. (2020). The pressure is adjusted by fixing the initial total hydrogen nuclei density [n(Htot)] at 2.61 × 104 cm−3 to obtain a Strömgren sphere of angular radius at 4.6″ (~0.02186 pc = 6.75 × 1016 cm), considering a source distance of 980 pc. We note that the sound travel time (~1010 years) in the constant pressure model is larger than the kinematic age (~600 years; Masson 1989; Zijlstra et al. 2008), but comparable to the dynamic age (1080–1620 years; Schönberner et al. 2018; Guerrero et al. 2020) of the system. We assume the central star emits ionizing blackbody radiation with a temperature 1.98 × 10s K and a bolometric luminosity 6.2 × 10³ L⊙, irradiating a spherical geometry of gas (Latter et al. 2000; Moraga Baez et al. 2023). The dimension of the gas is defined by an inner radius at 3.1″ (~0.01473 pc = 4.55 × 1016 cm). The resulting geometry is a thick, spherical, and closed shell. The ionization of atomic hydrogen by the Galactic cosmic-ray background is considered with a mean primary ionization rate of ζp = 2 × 10⁻¹⁶ s−1 (Indriolo et al. 2007). The ionization of H2, with a mean secondary ionization rate of ζ2 = 4.6 × 10⁻¹⁶ s−1 is estimated by the scaling ζ2 = 2.3ζp (Glassgold & Langer 1974). The background radiation field includes the cosmic microwave background (CMB) at 2.725 K, the unextinguished local interstellar radiation field adopted from the continuum provided by Black (1987, see their Fig. 2) and the Galactic background radiation field proposed by Draine & Bertoldi (1996) with an intensity of the continuum scaled up by a factor of ~3 × 10⁴ (Hasegawa et al. 2000; Godard & Cernicharo 2013; Lau et al. 2016). The default elemental abundance (relative to total hydrogen nuclei) set for planetary nebulae in CLOUDY modeling, noted in Table 2, is primarily from Aller & Czyzak (1983); Khromov (1989).
Since NGC 7027 is a carbon-rich nebula, dust is thought to be primarily made up of amorphous carbon. Based on the best-fit dust model proposed by Lau et al. (2016), we applied a similar approach here. A large grain (LG) component of a single uniform distribution of amorphous carbon (Rouleau & Martin 1991) with radii 1.5 μm is considered. A log-normal distribution of (3.1–12) × 10−4 μm neutral polycyclic aromatic hydrocarbons (PAHs) centered at 6.4 × 10⁻⁴ μm with a width σ = 0.1 is adopted considering the refractive index data from Draine & Li (2007). A power-law grain size distribution, n(a) ∝ a−α with index α = 3.5, amin = 12 × 10−4 μm, and amax = 0.4 μm of amorphous carbon (Rouleau & Martin 1991) very small grains (VSGs) is finally considered. Following Lau et al. (2016), we adjusted the dust properties of three independent components with LGs, VSGs, and PAHs constituting 96.51, 1.93, and 1.56% of the total dust by mass, respectively. With these different components of grain size distribution, we obtained dust-to-gas mass ratio (Md/Mg) of ~1/145, a ratio of extinction per reddening of RV = AV/E(B − V) = 4.118 and extinction-to-gas ratio = AV/N(H)~1.48 × 10−22 mag cm2.
Initial gas-phase elemental abundances with respect to total hydrogen nuclei(a) used in the CLOUDY model.
2.1.2 Chemistry
The equilibrium abundance of HeH+ is dominated by the reactions noted in Table A.1 (see Appendix A). Our main update with respect to Neufeld et al. (2020) concerns the radiative association (reaction R1) of He+ with H based on new quantum calculations (see Appendix B). For the three other reactions (reactions R2 to R4 noted in Table A.1), our references are the same, but the rate coefficients are fitted using the modified-Arrhenius equation with good accuracy over the temperature range 100–2 × 10⁴ K. The other chemical reactions related to HeH+ are adopted from Neufeld et al. (2020); Das et al. (2020); Sil et al. (2024).
Figure 1 shows the equilibrium temperature and density profiles of H, H+, H2, H+, e−, He, He+, He(23S), and HeH+ as a function of the distance from the star starting from the illuminated face (where the starlight striking the cloud) up to a certain depth where the temperature reaches up to 800 K. The bottom panel of Fig. 1 shows a zoomed-in view of the top panel, focusing on the region near the Strömgren radius (within the black-colored dashed rectangle) where the HeH+ peak appears. The density peak of HeH+ (~9.69 × 10⁻⁴ cm−3) from our model appears close to the helium Strömgren radius (~0.02189 pc), where half of the He+ has recombined. But it is important to note that the abundance peak of HeH+ (~1.02 × 10⁻⁸) appears closer to the hydrogen Strömgren radius (~0.02186 pc). The HeH+ peak density is ~2.1 times lower than that reported in Neufeld et al. (2020). It should be noted that the density and temperature profiles shown in Fig. 1 slightly differ from Neufeld et al. (2020) (see their Fig. 8) due to the update from CLOUDY version c17 to c23, as the microphysics treatment in CLOUDY improves over time. Also, due to the revised physical model parameters (source luminosity and effective temperature, radiation field, grain physics), we had to fix the initial n(Htot) at 2.96 × 104 cm−3 for the constant pressure model to obtain the expected position of the Strömgren sphere.
Neufeld et al. (2020) show that the associative ionization of atomic H with He(23S ) is a significant source of HeH+ formation. This finding reflects their update of the rate coefficient to the measurements of Waibel et al. (1988), ignored in all previous astrochemical models. While CLOUDY allows us to predict the population of the metastable 23S level of Helium through its recombination history, and to add it as a reaction partner or product to its chemical network, it is as yet (Version 23.01) unable to consistently couple the underlying chemical reaction network to the statistical equilibrium calculations. We, therefore, neglected this reaction in our CLOUDY modeling. We, however, tested its impact using a simple steady-state chemical model restricted to the four dominant formation and destruction reactions of HeH+, as identified by Neufeld et al. (2020) (reactions R1, R2, R3, and R4 in Table A.1), and taking the CLOUDY density profiles for H, He+, He(23S) and e−. We found that the HeH+ peak density is increased by about a factor of 2.3, reaching a peak density of ~2.19 × 10⁻³ cm−3, similar to the results of Neufeld et al. (2020) (see their Fig. 8). The impact of this reaction is thus significant and will be considered in our NLTE RADEX calculations in Sect. 2.2.
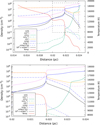 |
Fig. 1 Top panel: equilibrium temperature and densities of H, H+, H2, |

Comparison between the observed and CLOUDY model predicted line fluxes.
2.1.3 NLTE calculations
In CLOUDY, the NLTE radiative transfer is treated in 1D geometry within the escape probability formalism (Ferland et al. 2017, and references therein). We assumed the closed spherically symmetric geometry (implicit for planetary nebulae) with the sphere expanding (default) option so that the Large Velocity Gradient (LVG) or Sobolev approximation was employed.
Spectroscopic data for HeH+, i.e., level energies and Einstein coefficients, were taken from the EXOMOL database (Tennyson et al. 2016; Amaral et al. 2019). This set includes a total of 183 ro-vibrational levels, with 162 bound and 21 quasi-bound states. Because most of the quasi-bound states have large dissociation probabilities, we selected only the 162 bound states, with the highest level (υ = 11, J = 1) lying 14 873.7 cm−1 (about 21 400 K) above the ground level. For inelastic collisions with electrons and hydrogen atoms, we combined several accurate sets of theoretical data using various approximations based on propensity rules, as described in Appendix C. It should be noted that rate coefficients for electron-impact (de)excitation are typically 3–4 orders of magnitude larger than those for collisions with hydrogen atoms. In regions where n(e)/n(H) ≫ 10−3, such as the region close to the Strömgren radius in NGC 7027, electron collisions will thus dominate the excitation of HeH+.
In Table 3, we compared the observed line fluxes reported by Neufeld et al. (2020) for HeH+, H i, He ii and He i to the predictions of our CLOUDY model. The line fluxes in CLOUDY are given in units of erg s−1 cm−2. To compare with the observations, we converted them to W m−2, accounting for the observational angular sizes (see notes in Table 3). our model underpredicts the observation by Güsten et al. (2019) for the J = 1 → 0 pure rotational line flux of HeH+ by a factor of 3.44, which is similar but slightly worse than the predictions of Neufeld et al. (2020), primarily due to the missing reaction channel R2 (see Sect. 2.1.2 and Table A.1) in our CLOUDY model. For both the P(1) and P(2) ro-vibrational transitions, our model underpredicts them by factors of 1 .91 and 2.29, respectively, while the predictions by Neufeld et al. (2020) for P(1) are better (overpredicted by 1.08), but that for P(2) is similar (underpredicted by 2.33). However, the observed υ = 1 → 0 P(2)/P(1) line ratio of 1.34 ± 0.24 is consistent with our model prediction (1.12), while the predicted value by Neufeld et al. (2020) is 0.53. Since this ratio is mainly determined by the relative collisional rate coefficients for ro-vibrational excitation, our closer match with the observations suggests that the collisional propensity rules are best described in our data set. This point is further illustrated in Appendix C. Finally, the line-center optical depths of the three HeH+ lines predicted from the CLOUDY model are 6.48 × 10⁻², 9.92 × 10⁻⁵, and 6.20 × 10⁻⁶ for J = 1 → 0, υ = 1 → 0 P(1), and P(2), respectively.
Our model underestimates the strongest observed recombination lines for H and He+, showing flux discrepancies of about 1.17 and 1.22 times lower than observed, respectively. Conversely, for He, it overestimates the flux by a factor of 1.34. overall, our model prediction leads to a deviation percentage of 14–34%. The predicted fluxes for one-electron systems (He+ and H), computed from the actual model ionization and temperature structure, were based on the Case B recombination line emissivities presented by Storey & Hummer (1995). For the He recombination line, we utilized the emissivities calculated by Porter et al. (2012, 2013). Ultimately, our model has a better agreement with the observed data compared to the predictions made by Neufeld et al. (2020), likely due to the updated physical model parameters and upgrade from CLOUDY version c17 to c23.
2.2 RADEX modeling and results
In RADEX, the NLTE radiative transfer is solved for a homogeneous and isothermal medium within the escape probability formalism (van der Tak et al. 2007). As with CLOUDY, the LVG approximation (option expanding sphere) was used to model the HeH+ emission in NGC 7027. The RADEX parameters for the physical conditions, namely kinetic temperature Tkin, atomic hydrogen density n(H), and electron density n(e−) were extracted from the CLOUDY solution at the HeH+ abundance peak, which also coincides with the emission peak for the three detected lines. These parameters are listed in Table 4 (see also Fig. 1). The last parameter is the HeH+ column density per unit velocity interval. The HeH+ column density was taken as the CLOUDY value (also reported in Table 4) and a line width (FWHM) of 30 km s−1 was selected as representative of the three detected lines. We also considered a larger column density of 2.04 × 1012 cm−2, as predicted from our simple four-reaction model where the associative ionization of H with He(23S ) (reaction R2) was included (see Sect. 2.1.2). The background radiation field was assumed to be solely the 2.725 K CMB radiation field. We checked that the average interstellar radiation field, as implemented in RADEX, has no effect. The nebular and dust continuum emission was also neglected. We note, however, that radiative pumping due to the internal infrared continuum is not insignificant and should be investigated in future models.
The predicted line fluxes are reported in Table 5. We can notice that the agreement with the CLOUDY results (reported in Table 3) is very reasonable, with RADEX line fluxes being typically 30% lower than those from CLOUDY. Since the same collisional data set was employed, this modest difference can be attributed to the different NLTE radiative transfer treatments and, in particular, the isothermal and homogeneous assumptions. As with CLOUDY, the υ = 1 → 0 and P(2) lines are significantly underpredicted (by a factor of ~3) while the υ = 1 → 0 P(2)/P(1) observational ratio (1.34 ± 0.24) is well reproduced (1.12). Our predictions using the larger column density of 2.04 × 1012 cm−2 are also reported in square brackets. While the line flux computed with RADEX is still too low for the J = 1 → 0 pure rotational line, the agreement with observational values is much better for the two υ = 1 → 0 ro-vibrational lines. Overall, the predicted fluxes agree with observations to better than a factor of 2.3. This result supports the importance of the reaction between He(23S) and H as an additional source of HeH+ in NGC 7027.
In order to illustrate the impact of relative collisional rate coefficients on line flux ratios, we investigated in Appendix C the relation between the υ = 1 → 0 P(2)/P(1) line flux ratio (1.34 ± 0.24) and the ratio of the corresponding fundamental excitation rate coefficients. We showed that the two ratios follow a simple linear relationship so that the line flux ratio is very sensitive to the collisional propensity rules. on the other hand, the υ = 1 → 0 P(2)/P(1) line flux ratio depends only very weakly on the electron density and temperature (in the HeH+ emission region), as already noted by Neufeld et al. (2020).
Physical parameters obtained at HeH+ abundance peak from CLOUDY model.
2.3 RADEX-MCMC modeling and results
In this section, a second approach, where chemical pumping is introduced in the NLTE analysis, is used. Indeed, because HeH+ belongs to the class of reactive ions, i.e., species that react fastly with the dominant colliders (here electrons and H atoms), the chemical source and sink terms should be, in principle, included when solving the statistical-equilibrium equations. These two terms describe the so-called chemical (or formation) pumping process, and they are ignored in the previous sections, as well as in Neufeld et al. (2020). These authors argue that chemical pumping effects should be minor for the detected levels of HeH+ since the destruction rate coefficients are smaller than the excitation rate coefficients. The competition between inelastic and destruction rates is investigated in detail below. In addition, in contrast to the previous NLTE RADEX calculations where the physical conditions and HeH+ column density were taken from the CLOUDY results, here RADEX is combined with MCMC sampling in order to determine the RADEX parameters that best reproduce the three lines detected in NGC 7027.
The version of RADEX, as modified by Faure et al. (2017), was employed in order to include the state-resolved formation and state-resolved destruction rate coefficients of HeH+. The formation of HeH+ was assumed to be entirely dominated by the radiative association of He+ and H, as in our CLOUDY chemical model. Accurate state-resolved rate coefficients were computed for this purpose and are described in Appendix B. Thus, this new data set describes the formation of all 162 bound states of HeH+(υ, J) at kinetic temperatures from 10 to 20 000 K. We recall that the associative ionization of neutral H with He(23S) is another important source of HeH+ in NGC 7027, as shown by Neufeld et al. (2020) and confirmed above. However, to our knowledge, no state-resolved rate coefficients are available for this process, but we note that theoretical state-resolved cross sections at the collision energy Ecol = 50 meV can be found in Waibel et al. (1988). Extending such calculations to higher collision energy would be necessary to include the associative ionization process as a source term. For the destruction of HeH+ by electrons and hydrogen atoms through dissociative recombination and proton transfer, respectively, we employed accurate sets of theoretical data with some extrapolations and assumptions, as described in Appendix B. It is to be noted that we neglected the HeH+ photodissociation reaction (HeH+ + hv → He+ + H) in the chemical pumping model since this reaction is negligible in the region of the HeH+ abundance peak (see Fig. 9 of Neufeld et al. 2020).
MCMC is a statistical method used to estimate the parameters of a model by iteratively generating random samples from the prior probability distributions. To calculate the likelihood of the parameters given the observed values, we utilized the publicly available MCMC Python implementation emcee developed by Foreman-Mackey et al. (2013). It should be noted that MCMC works even if the number of free parameters is larger than the number of data points, which is the case here (four RADEX free parameters versus three observed line fluxes). In this situation, however, some of the parameters remain unconstrained, as described below.
The MCMC analysis is detailed in the Appendix D. In order to illustrate the convergence of the four RADEX free parameters (kinetic temperature, atomic hydrogen density, electron density, and HeH+ column density) considering the applied RADEX-MCMC sampling, the corner diagram for the achieved solution is presented in Fig. D.1. The corner diagram shows the highest probability distributions resulting from the individual histograms of the mentioned free parameters. The best-fit posterior with uncertainties is noted in Table 6.
As shown in Table 7, the agreement between the MCMC best-fit and the observed line fluxes is very good and within observational error bars for the two transitions (υ, J) = (0,1) → (0,0) and (1,1) → (0,2). We can notice in Table 6 that the best-fit posterior parameters are overall in rather good agreement with the values extracted from the CLOUDY solution at the HeH+ abundance peak (see Table 4). However, from the corner plot shown in Fig. D.1, we see that the posterior distributions are not gaussian and clearly bimodal for the electron density. This latter also shows some correlation with the kinetic temperature and the HeH+ column density. Thus, as expected, the small number of detected lines limits the reliability of the parameter estimates. Still, it is interesting to compare the electron density and HeH+ column density inferred from our RADEX-MCMC modeling with the CLOUDY results: the HeH+ column density is twice as large while the electron density is larger by a factor of 3. Compared to the four-reaction model, the HeH+ column density is in excellent agreement. These results will be further discussed in Sect. 3 below.
To assess the role of chemical pumping in our RADEX modeling, we further ran an MCMC model where the chemical source and sink terms are ignored in the statistical-equilibrium equations. The best-fit parameters were found to be practically identical to when these terms are included, demonstrating that the three detected lines are not sensitive to the chemical terms. This result confirms the assumption of Neufeld et al. (2020) based on their estimate of destruction and excitation rates, as mentioned above. Indeed, according to our collisional data set, the destruction state-resolved rate coefficients for both electrons and H atoms are (at 104 K) of the order of 10−9 cm3 s−1, while the electron-impact excitation rate coefficients from the ground (υ, J) = (0, 0) to the three upper levels (0, 1), (1 , 0), and (1 , 1) are 4.1 × 10⁻⁷ cm3 s−1, 3.1 × 10⁻⁹ cm3 s−1, and 5.3 × 10⁻⁹ cm3 s−1, respectively. on the other hand, the electron-impact rate coefficients follow propensity rules, as discussed in Appendix C, and in practice, all transitions with ΔJ ≥ 4 or Δυ ≥ 2 have rate coefficients much lower than 10−9 cm3s−1. This is illustrated in Fig. 2 where the relative population (divided by the degeneracy) of levels with upper energy lower than 7000 K is plotted as a function of the upper-level energy. The two RADEX models, with and without chemical pumping included, are compared using the parameters listed in Table 6. We can clearly observe that the two models agree for low J ≤ 4 and that deviations occur for higher and less populated levels, as expected. The population of highly excited levels is thus found to be much larger by up to eight orders of magnitude for the highest plotted level (υ, J) = (0, 12) when chemical pumping is taken into consideration. The higher population of excited states reflects their relatively short chemical lifetime and the memory of the HeH+ formation process, as observed previously for CH+ in the same source (Godard & Cernicharo 2013; Faure et al. 2017; Neufeld et al. 2021).
Finally, in order to illustrate how the HeH+ emission spectrum retains some memory of the state-specific formation, we plotted in Fig. 3 the HeH+ line surface brightness variation with wavelength in the range 0–40 μm. This plot considers the best-fit RADEX-MCMC model parameters mentioned in Table 6. Furthermore, Table 8 presents the surface brightness of the most intense low-excitation HeH+ transitions with and without pumping based on our best-fit RADEX-MCMC model. It is evident that the most intense lines (with surface brightness exceeding 10−5 erg cm−2 s−1 sr−1 ), including the three already detected, remain unaffected by pumping. Conversely, a significant number of lines exhibit much higher intensities with pumping compared to without, attributed to the substantially elevated populations of their upper levels. According to our best-fit RADEX-MCMC model with chemical pumping, it is predicted that within the JWST range (0.6–28.3 μm), the next lines to be detected in terms of surface brightness should be the (υ, J) = (1,1) → (0,0) [R(0)] and (1,2) → (0,3) [P(3)] lines at 3.36 μm and 3.71 μm, respectively.
Comparison between the observed and RADEX model(a) predicted HeH+ line fluxes.
Summary of the best-fit posterior physical parameters obtained from the RADEX-MCMC model with chemical pumping.
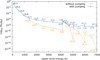 |
Fig. 2 Ro-vibrational population diagram of HeH+ (υ, J) as predicted by RADEX with and without considering chemical pumping for the bestfit parameters noted in Table 6. |
Comparison between the observed and the RADEX-MCMC best-fitted model parameters(a) predicted HeH+ line fluxes.
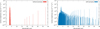 |
Fig. 3 HeH+ line surface brightness variation with wavelength (in μm) as predicted by the best-fit RADEX-MCMC model parameters noted in Table 6. The left panel is without pumping, and the right panel is considering pumping. |
3 Discussion and conclusions
In this study, we utilize three different NLTE models (CLOUDY, RADEX, and RADEX-MCMC with chemical pumping) to conduct a comprehensive analysis aimed at determining how the HeH+ emissions from NGC 7027 can help to evaluate our understanding of the HeH+ chemistry and excitation. One important finding is that including the reaction of H with He(23S) as an additional source of HeH+ increases its column density by a factor of 2.1 and brings RADEX predictions more in line with observations, with line fluxes that agree within a factor of ~2. This result supports the results of Neufeld et al. (2020) and underlines the importance of including He(23S) as a separate species and consistently coupling the resulting chemical population in a future update of CLOUDY. This also suggests that our current knowledge of the HeH+ chemistry should be reliable and that it can be employed in other similar environments with good confidence. We note in this context that for early Universe chemistry, the formation path to HeH+ is yet another reaction, the radiative association of He with H+, for which accurate rate coefficients are also available (Courtney et al. 2021).
A perplexing result is that the electron density inferred from our RADEX-MCMC model, n(e) = 1.45 × 10s cm−3, is a factor of ~3 larger than the electron density predicted by CLOUDY at the position of the HeH+ peak, n(e) = 4.63 × 104 cm−3, which is similar to the average value of 4.7 × 104 cm−3 yielded by density-sensitive diagnostics from ionic atomic lines (Zhang et al. 2005). It is unclear whether HeH+ may serve as a useful probe for electron density in NGC 7027. It may only provide insights into the thin layer where it forms, which is not representative of either the ionized nebula or the surrounding molecular envelope. In any case, a more solid estimate of the electron density will require the identification of additional HeH+ lines, which would also lift the degeneracy with the kinetic temperature and column density. In this context, we stress that our current results suggest that new ro-vibrational transitions of HeH+ such as υ = 1 → 0 R(0) and P(3) could be detected with the JWST in less than an hour (NIRSpec integral field unit, JWST exposure time calculator version 4.0). Another related important result is that uncertainties in the electron-impact excitation rate coefficients have been largely removed in this study, as highlighted by our analysis of the υ = 1 → 0 P(2)/P(1) line ratio.
The impact of the chemical terms on the HeH+ excitation is also investigated, revealing that the three detected lines are insensitive to chemical pumping, in contrast to relatively “shortlived” and less populated levels. As a result, HeH+ chemical pumping effects in NGC 7027 could be probed observationally by detecting lines with surface brightness typically larger than ~10−6 erg cm−2 s−1 sr−1.
As a caveat, we note that NGC 7027 is a dynamically young nebula (600 years, Masson 1989; Zijlstra et al. 2008), while our CLOUDY modeling assumes steady-state equilibrium. In particular, there may be a significant mixing of neutral and atomic gas phases. The expansion of the molecular shell can be described by a radial velocity field, υr = 10–13 kms−1 and an additional linear component along its major axis of 6–8 kms−1 and, locally, up to ~40kms−1 (Santander-Garcia et al. 2012). The latter high-velocity gas is also seen in ro-vibrational H2 emissions from the photon-dominated region (PDR) and in the ionized gas (Br γ emission, Cox et al. 2002), evidencing a system of jets, or the footprint of a precessing jet (Bublitz et al. 2023). In view of this complexity, some mixing of molecular and ionized gas phases seems inevitable. As a matter of fact, an immersion of molecular knots in the ionized gas of planetary nebulae has been evidenced in later evolutionary stages observationally easier to access, e.g., in the Helix nebula (Meixner et al. 2005) or NGC 2828 (Derlopa et al. 2024). Bublitz et al. (2023) indeed locate CO+ emission in front of the PDR, fully exposed to external ultraviolet radiation. In turn, this implies a local coexistence of  and He, which could further enhance the HeH+ abundance through the reversal of the proton-transfer reaction R4 (Table A.1)2. It is possible to provide a rough estimate of whether this path is important: At the maximum HeH+ density (T ≃ 104 K), the formation path via reaction R1 exceeds that of the reverse of R4 by a factor of 750, with a minimum value of 75 at a temperature of 6000 K where the HeH+ density is an order of magnitude lower. In our CLOUDY model,
  is produced by photo-ionization of H2 or charge transfer with H+ or He+; only an inflow of molecular gas, as suggested by Black (1983), could potentially produce the two-order-of-magnitude overabundance of
  required for the reverse of R4 to compete with R1. Such a scenario is out of the capabilities of our model and reserved for future work.
Finally, the elongated nebula is approximated as spherically symmetrical to simplify our modeling approach. However, we highlight that considering an ellipsoidal geometry could provide a better prediction of the physical conditions. Investigating how ellipsoidal or more complex geometries affect radiative transfer is a challenging task that requires further study. While addressing this complex geometry is beyond the scope of the present work, it remains an important area for future investigation.
Data availability
The new extended HeH+ ro-vibrational inelastic dataset underlying this article will be made available in the Excitation of Molecules and Atoms for Astrophysics (EMAA) database3.
Acknowledgements
The authors express their gratitude to the referee, John H. Black, for his invaluable insights and constructive comments, which have substantially enhanced the quality of this work. M.S. acknowledges financial support from the European Research Council (consolidated grant COLLEX-ISM, grant agreement ID: 811363). The work of R.C. has been supported by the Czech Science Foundation (Grant No. GACR 21-12598S). Fabrizio Esposito is acknowledged for sending the authors the state-resolved rate coefficients for the reaction of HeH+ with H. The authors are grateful to David A. Neufeld for reading the first version of this paper and making very useful comments. The authors also thank Thierry Forveille and Joel Kastner for interesting discussions.
Appendix A Updated reaction rates
The HeH+ chemical network from CLOUDY version c23.01 was updated for the three dominant formation and destruction reactions R1, R3, and R4, as listed in Table A.1. For the radiative association of He+ with H (reaction R1), the thermal rate coefficient computed in the present work (see Sect. B.1) was adopted. For the dissociative recombination (DR) of HeH+ (reaction R3), the thermal rate coefficient derived by Novotný et al. (2019) was used. For the reaction of HeH+ with H (reaction R4), we employed the thermal quasi-classical trajectory (QCT) rate coefficient computed by Esposito et al. (2015). In addition, the impact of the associative ionization of H with He in the metastable level 23S (reaction R2) was tested in a simplified four-reaction model, as discussed in Sect. 2.1.2. For this reaction, a thermal rate coefficient was computed using the experimental cross sections of Waibel et al. (1988) (see their Fig. 13) extrapolated as 1/Ecol up to 20 eV. For all reactions R1-R4, the rate coefficients were fitted using a standard modified-Arrhenius equation. It should be noted that our fits are reliable over the kinetic temperature range 100 – 20 000 K only, and they should be accurate to within ~ 20%.
Appendix B New HeH+ ro-vibrational data for reactive collisions
B.1 Radiative association of He+ with H
The electronic potential energy curves for the ground (X1Σ+) and the excited state (A1Σ+) of HeH+, along with the dipole moment (μυ) were computed by means of the state-averaged complete active space self-consistent field method followed by a configuration interaction calculation as a function of the internuclear distance using the Molpro software (Werner et al. 2012), as described in Loreau et al. (2010).
The partial cross sections of the radiative association reaction were calculated by applying the Fermi golden rule in the zero-density limit as,
![${\sigma _{v,J}}(E) = \frac{{64{\pi ^5}{v^3}p}}{{3{c^3}{k^2}}}\left[ {JM_{v,J - 1;k,J}^2 + (J + 1)M_{v,J + 1;k,J}^2} \right],$](/articles/aa/full_html/2025/03/aa53173-24/aa53173-24-eq15.png)
where v represents the frequency of the emitted photon, k denotes the wavenumber of the initial state, p is the probability factor in the initial electronic state, and J indicates the initial rotational quantum number. Moreover, The term MυJ±1;k,J corresponds to the electric transition dipole moment given by,

where fkJ(R) represents the radial, energy-normalized, continuum wavefunctions which were computed through numerical propagation using the symplectic integrator given by Manolopoulos & Gray (1995); and ψv,J±1(R) are the bound ro-vibrational wavefunctions obtained by solving the vibrational Schrodinger equation using the discrete variable representation method described in Colbert & Miller (1992). Consequently, the total cross section was obtained by summing over all possible vibrational and rotational levels of HeH+, σ(E) = Σ v,J σvJ (E).
The partial cross sections were computed in a collision energy range from 1 × 10⁻³ to 1 × 105 cm−1 with a denser grid around resonances.
The total or state-to-state rate coefficients as a function of the temperature were computed by assuming the Maxwellian velocity distribution of the initial states, and averaging over the normalized energy distribution,

where μ is the reduced mass, and kb is the Boltzmann constant. Numerical integration was employed to compute the rate coefficients over a range from 10 to 2 × 10⁴ K. The results are in good agreement with previous calculations on the same system (Forrey et al. 2020).
B.2 Dissociative recombination of HeH+ with electrons
For the DR of HeH+ with electrons, we used the multichannel quantum defect theory (MQDT) cross sections computed by Čurík et al. (2020). HeH+ ro-vibrational levels with υ = 0 – 2 and J = 0 – 2 were considered. In order to cover kinetic temperatures up to 20 000 K, cross sections were extrapolated as 1/Ecol from 3.3 eV up to 20 eV. It should be noted that the DR cross sections for HeH+(υ = 0, J = 0 – 2) were checked against an experiment performed at the Cryogenic Storage Ring (CSR; Novotný et al. 2019) by computing state-specific DR rate coefficients convolved over the CSR electron beam energy distributions. The good agreement observed between theory and experiment suggests that the state-specific thermal (Maxwell-Boltzmann averaged) rate coefficients computed here should be accurate to within ~ 30% above 100 K. Within υ = 0 – 2, the rate coefficients for J = 2 were used for all levels with J ≥ 3. This simple extrapolation should have a modest impact on our modeling since rotational effects become negligible above ~ 1000 K (see Fig. 5 in (Čurík et al. (2020)). Similarly, the rate coefficients for υ = 2, J = 2 were employed for all J levels with υ ≥ 3. We note in this respect that the DR rate coefficients were found to increase significantly with υ, especially below 1000 K where the rate coefficients for υ = 1,2 can exceed those for υ = 0 by more than an order of magnitude. At 104 K, the rate coefficient for the levels (υ, J) = (0,0), (1,0) and (2,0) are 3.9 × 10⁻¹⁰, 1.3 × 10⁻⁹ and 2.5 × 10⁻⁹ cm3s−1, respectively.
B.3 The reaction of HeH+ with H atoms
For the reaction of HeH+ with H (which produces  ), we employed the rate coefficients computed by Esposito et al. (2015) for (bound) levels υ = 0 – 5, J = 0 – 23 and kinetic temperatures up to 15 000 K. This set was computed using the QCT approach, which was found to be in excellent agreement with quantum close-coupling calculations for collisional energies larger than ~ 0.1 eV. The QCT thermal rate coefficient at room temperature (298 K) was also found to be in excellent agreement with the experimental result of Karpas et al. (1979) (see Fig. 6 in Esposito et al. 2015). For levels not included in the set of Esposito et al. (2015), i.e. levels with υ ≥ 6, we used an average temperature-independent rate coefficient of 1.5 × 10⁻⁹ cm3s−1. We note in this respect that rotational and vibrational effects are modest above ~ 1000 K with all QCT state-specific rate coefficients lying in the range 1 – 3 × 10⁻⁹ cm3s−1. This range is comparable to the magnitude of the above DR rate coefficients so that hydrogen atoms can compete with electrons in regions where n(e)/n(H) < 1, which is observed in our CLOUDY modeling near the HeH+ abundance peak (see Fig. 1).
Updated reaction rate coefficient adopted in the chemical model.
Appendix C New HeH+ ro-vibrational data for inelastic collisions
C.1 Electron collisions
For inelastic collisions with electrons, we combined two sets of accurate cross sections: the pure rotational cross sections of Hamilton et al. (2016) for levels with υ = 0 and J ≤ 9 and the ro-vibrational cross sections of Čurík & Greene (2017) for levels with υ = 0,1 and J ≤ 4. Both sets were computed using the R-matrix approach, but the MQDT used by Čurík & Greene (2017) includes resonances and is more accurate than the adiabatic-nuclei-rotation (ANR) approximation used by Hamilton et al. (2016). In order to cover kinetic temperatures up to 20 000 K, the two sets of cross sections were extrapolated as 1/Ecol up to 20 eV. In addition, for levels higher than υ = 1, J = 4, the dipolar Coulomb-Born (CB) approximation was employed, as described in Sil et al. (2024) (see their Appendix A). For ions with a significant dipole such as HeH+ (1.66 D; Pavanello et al. 2005), the CB approximation is usually reliable for dipolar transitions, i.e., those with ΔJ = ±1 and Δυ = 0, ±1. For such transitions, the CB cross sections agree very well with those of Hamilton et al. (2016), who applied a CB-closure technique, while they are significantly larger than those of Čurík & Greene (2017). As discussed by these latter authors, the limited number of partial waves included in their calculations is, in fact, expected to underestimate such cross sections. As a result, for dipolar transitions, we used the cross sections of Hamilton et al. (2016) for levels with υ = 0, J ≤ 9 and the CB cross sections otherwise. The corresponding rotational rate coefficients should be accurate to within ~ 30%, as observed experimentally for CH+ (Kálosi et al. 2022) whose dipole is very similar (1.68 D). Future MQDT calculations involving a CB-closure technique, such as those used by Forer et al. (2024) for CH+, should confirm this result. Finally, while cross sections for dipole-forbidden transitions with |ΔJ| ≥ 3 and |Δυ| ≥ 2 can be neglected (Čurík & Greene 2017; Ayouz & Kokoouline 2019), those with |Δυ| = 0,1 and |ΔJ| = 0,2 have magnitudes similar to those with |ΔJ| = 1. Thus, for upper levels higher than υ = 1, J = 4, de-excitation rate coefficients for such transitions were set identical to the CB rate coefficients for |ΔJ| = 1. This simple prescription follows the propensity rules and should be accurate within a factor of 3. We note that the typical magnitude of the largest de-excitation state-to-state rate coefficients at 103 K is 10−6 cm3s−1 for rotational transitions and 10−8 cm3s−1 for ro-vibrational transitions.
C.2 Collision with hydrogen atoms
For inelastic collisions with hydrogen atoms, we used the rate coefficients computed by Desrousseaux & Lique (2020) for levels with υ = 0 and J = 0 – 9 and kinetic temperatures up to 500 K. This set of data was computed using the quantum close-coupling approach and should be accurate to within ~30%. A flat temperature dependence of the de-excitation rate coefficients was assumed above 500 K. For levels higher than υ = 0, J = 9, we followed the propensity rules observed by Desrousseaux & Lique (2020) for rotational transitions due to H collisions and by Gianturco et al. (2021) for ro-vibrational transitions due to collisions with He atoms: rotational transitions with |ΔJ| = 1,2 and ro-vibrational transitions with |Δυ| = 1 and |ΔJ| ≤ 5| are favored in these collisions. For levels higher than (0,9) and transitions obeying the previous propensity rules, temperature-independent de-excitation rate coefficients of 10−10 cm3s−1 and 10−11 cm3s−1 were used, respectively. This crude prescription should be accurate to within a factor of 5 – 10. While accurate state-to-state rate coefficients at high temperatures are desirable, we note that in the context of NGC 7027, the excitation of HeH+ is dominated by electron collisions due to their much larger rate coefficients.
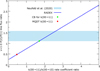 |
Fig. C.1 HeH+ line flux ratio predicted by RADEX for the two detected ro-vibrational lines (υ, J) = (1,1) → (0,2) [P(2)] and (1,0) → (0,1) [P(1)] as a function of the rate coefficient ratio for the excitation transitions (0,0) → (1,1) and (0,0) → (1,0). The hatched blue area represents the observed ratio. The red and green circles denote the predicted line ratio when using the CB (default) or MQDT rate coefficients for the excitation (0,0) → (1,1). See text for more details. |
C.3 Impact of propensity rules on the υ = 1 → 0 P(2)/P(1) line ratio
We plotted in Fig. C.1 the υ = 1 → 0 P(2)/P(1) line flux ratio, as predicted by RADEX, as a function of the rate coefficient ratio for the two fundamental excitations (0,0) → (1,1) and (0,0) → (1,0). At low electron density, line fluxes should be roughly proportional to fundamental excitation rate coefficients. In practice, we used the same physical conditions as in Sect. 2.2 (those listed in Table 5) with the same collisional data set except that the rate coefficient for the dipolar transition 0,0 → 1,1 (at 10 500 K) was varied from 2 × 10⁻¹⁰ cm3s−1 to 2 × 10⁻⁸ cm3s−1 in order to cover a rate coefficient ratio in the range 0 – 5. The default (CB) rate coefficient is 5.4 × 10⁻⁹ cm3s−1 while the MQDT value is 1.5 × 10⁻⁹ cm3s−1. The rate coefficient for the (dipole-forbidden) transition 0,0 → 1,0 was kept fixed at the default (MQDT) value of 3.2 × 10⁻⁹ cm3s−1. Thus, the rate coefficient ratio in our default collisional data set is 1.7, while it is 0.48 in the original MQDT data set of Čurík & Greene (2017), as employed by Neufeld et al. (2020). We can observe in Fig. C.1 that the RADEX predicted line flux ratio is a linear function of the rate coefficient ratio and that this latter should lie in the range 1.7 - 2.6 to reproduce the observational line ratio. This result nicely supports the above discussion where CB calculations were preferred to the MQDT calculations of Čurík & Greene (2017) in the case of dipolar transitions.
Appendix D MCMC fitting details
We employed a Bayesian approach to fit three observed HeH+ line fluxes noted in Table 7, to compare models with varying four RADEX parameters listed in Table 6, and then to calculate their probability distributions. This method of inference involves using prior data to sample posterior distributions. In practice, we used the MCMC approach to explore parameter space.
A logarithmic likelihood distribution with the formula below was used:
![$l = \sum\limits_i {\left[ { - \ln \left( {{\sigma _i}\sqrt {2\pi } } \right) - \frac{1}{2}\frac{{{{\left( {{x_i} - {\mu _i}} \right)}^2}}}{{\sigma _i^2}}} \right]} $](/articles/aa/full_html/2025/03/aa53173-24/aa53173-24-eq20.png)
where x is the observed spectral line flux, μ is the model line flux, and σ is the uncertainty in the observations.
The corner diagram resulting from the analysis of HeH+ line fluxes is shown in Fig. D.1. The diagonal plots represent the marginal distributions of each parameter, while the off-diagonal plots show the pairwise correlations. The correlation between N(HeH+) and Tkin and the electron density suggests that these parameters are closely linked in the model. For the RADEX-MCMC simulation, we assumed uniform priors spanning the ranges mentioned in the caption of the corner diagram. It is important to carefully consider the appropriateness of the chosen priors based on prior knowledge or physical constraints. In our case, we set the initial priors based on the result obtained from the CLOUDY model near the peak abundance of HeH+. The selected initial values were: Tkin = 10000 K, n(e) = 5 × 104 cm−3, n(H) = 5 × 104 cm−3, and N(HeH+) = 1012 cm−2. The MCMC simulation was performed using 48 walkers and 4096 iterations.
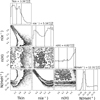 |
Fig. D.1 Exploring parameter space using RADEX-MCMC “corner plot” showing the distribution of Tkin, n(e−), n(H), and N(HeH+) (in the log10 scale) within the prior intervals [3:4.3], [4:6], [3:6], and [10:13], respectively, in the diagonal panels and the correlation between any pair of them (off-diagonal panels). The central dashed, vertical line in each diagonal panel shows the most likely parameters based on the χ2 likelihood (the other vertical lines show the 16% and 84% quantiles). The contours of the corner plot (2D plots) represent the 1 σ and 2σ levels at the 39.3% and 86.4% confidence levels. |
References
- Aller, L. H., & Czyzak, S. J. 1983, ApJS, 51, 211 [NASA ADS] [CrossRef] [Google Scholar]
- Amaral, P. H. R., Diniz, L. G., Jones, K. A., et al. 2019, ApJ, 878, 95 [NASA ADS] [CrossRef] [Google Scholar]
- Ayouz, M., & Kokoouline, V. 2019, Atoms, 7, 67 [NASA ADS] [CrossRef] [Google Scholar]
- Black, J. H. 1978, ApJ, 222, 125 [NASA ADS] [CrossRef] [Google Scholar]
- Black, J. H. 1983, IAU Symp., 103, 91 [Google Scholar]
- Black, J. H. 1987, Astrophys. Space Sci. Lib., 134, 731 [Google Scholar]
- Bublitz, J., Kastner, J. H., Hily-Blant, P., et al. 2023, ApJ, 942, 14 [Google Scholar]
- Chatzikos, M., Bianchi, S., Camilloni, F., et al. 2023, Rev. Mexicana Astron. Astrofis., 59, 327 [Google Scholar]
- Colbert, D. T., & Miller, W. H. 1992, J. Chem. Phys., 96, 1982 [NASA ADS] [CrossRef] [Google Scholar]
- Courtney, E. D. S., Forrey, R. C., McArdle, R. T., Stancil, P. C., & Babb, J. F. 2021, ApJ, 919, 70 [Google Scholar]
- Cox, P., Huggins, P. J., Maillard, J. P., et al. 2002, A&A, 384, 603 [NASA ADS] [CrossRef] [EDP Sciences] [Google Scholar]
- Čurík, R., & Greene, C. H. 2017, J. Chem. Phys., 147, 054307 [CrossRef] [Google Scholar]
- Čurík, R., Hvizdoš, D., & Greene, C. H. 2020, Phys. Rev. Lett., 124, 043401 [Google Scholar]
- Dabrowski, I., & Herzberg, G. 1977, Trans. New York Acad. Sci., 38, 14 [Google Scholar]
- Das, A., Sil, M., Bhat, B., et al. 2020, ApJ, 902, 131 [Google Scholar]
- Derlopa, S., Akras, S., Amram, P., et al. 2024, MNRAS, 530, 3327 [NASA ADS] [CrossRef] [Google Scholar]
- Desrousseaux, B., & Lique, F. 2020, J. Chem. Phys., 152, 074303 [NASA ADS] [CrossRef] [Google Scholar]
- Draine, B. T., & Bertoldi, F. 1996, ApJ, 468, 269 [Google Scholar]
- Draine, B. T., & Li, A. 2007, ApJ, 657, 810 [CrossRef] [Google Scholar]
- Esposito, F., Coppola, C. M., & De Fazio, D. 2015, J. Phys. Chem. A, 119, 12615 [Google Scholar]
- Faure, A., Halvick, P., Stoecklin, T., et al. 2017, MNRAS, 469, 612 [NASA ADS] [CrossRef] [Google Scholar]
- Ferland, G. J., Chatzikos, M., Guzmán, F., et al. 2017, Rev. Mexicana Astron. Astrofis., 53, 385 [Google Scholar]
- Flower, D. R., & Roueff, E. 1979, A&A, 72, 361 [NASA ADS] [Google Scholar]
- Foreman-Mackey, D., Hogg, D. W., Lang, D., & Goodman, J. 2013, PASP, 125, 306 [Google Scholar]
- Forer, J., Hvizdos, D., Ayouz, M., Greene, C. H., & Kokoouline, V. 2024, MNRAS, 527, 5238 [Google Scholar]
- Forrey, R. C., Babb, J. F., Courtney, E. D. S., McArdle, R. T., & Stancil, P. C. 2020, ApJ, 898, 86 [Google Scholar]
- Gianturco, F. A., Giri, K., Gonzâlez-Sânchez, L., et al. 2021, J. Chem. Phys., 155, 154301 [NASA ADS] [CrossRef] [Google Scholar]
- Glassgold, A. E., & Langer, W. D. 1974, ApJ, 193, 73 [NASA ADS] [CrossRef] [Google Scholar]
- Godard, B., & Cernicharo, J. 2013, A&A, 550, A8 [NASA ADS] [CrossRef] [EDP Sciences] [Google Scholar]
- Goodman, J., & Weare, J. 2010, Commun. Appl. Math. Comput. Sci., 5, 65 [Google Scholar]
- Guerrero, M. A., Ramos-Larios, G., Toalâ, J. A., Balick, B., & Sabin, L. 2020, MNRAS, 495, 2234 [NASA ADS] [Google Scholar]
- Güsten, R., Wiesemeyer, H., Neufeld, D., et al. 2019, Nature, 568, 357 [CrossRef] [Google Scholar]
- Hamilton, J. R., Faure, A., & Tennyson, J. 2016, MNRAS, 455, 3281 [NASA ADS] [CrossRef] [Google Scholar]
- Hasegawa, T., Volk, K., & Kwok, S. 2000, ApJ, 532, 994 [NASA ADS] [Google Scholar]
- Hogness, T. R., & Lunn, E. G. 1925, Phys. Rev., 26, 786 [Google Scholar]
- Indriolo, N., Geballe, T. R., Oka, T., & McCall, B. J. 2007, ApJ, 671, 1736 [NASA ADS] [CrossRef] [Google Scholar]
- Kálosi, Á., Grieser, M., von Hahn, R., et al. 2022, Phys. Rev. Lett., 128, 183402 [Google Scholar]
- Karpas, Z., Anicich, V., & Huntress, W. T. 1979, J. Chem. Phys., 70, 2877 [NASA ADS] [CrossRef] [Google Scholar]
- Khromov, G. S. 1989, Space Sci. Rev., 51, 339 [NASA ADS] [CrossRef] [Google Scholar]
- Latter, W. B., Dayal, A., Bieging, J. H., et al. 2000, ApJ, 539, 783 [NASA ADS] [CrossRef] [Google Scholar]
- Lau, R. M., Werner, M., Sahai, R., & Ressler, M. E. 2016, ApJ, 833, 115 [Google Scholar]
- Loreau, J., Palmeri, P., Quinet, P., Liévin, J., & Vaeck, N. 2010, J. Phys. B: At. Mol. Opt. Phys., 43, 065101 [Google Scholar]
- Manolopoulos, D. E., & Gray, S. K. 1995, J. Chem. Phys., 102, 9214 [NASA ADS] [CrossRef] [Google Scholar]
- Masson, C. R. 1989, ApJ, 336, 294 [NASA ADS] [Google Scholar]
- Meixner, M., McCullough, P., Hartman, J., Son, M., & Speck, A. 2005, AJ, 130, 1784 [Google Scholar]
- Moraga Baez, P., Kastner, J. H., Balick, B., Montez, R., & Bublitz, J. 2023, ApJ, 942, 15 [NASA ADS] [CrossRef] [Google Scholar]
- Neufeld, D. A., Goto, M., Geballe, T. R., et al. 2020, ApJ, 894, 37 [CrossRef] [Google Scholar]
- Neufeld, D. A., Godard, B., Bryan Changala, P., et al. 2021, ApJ, 917, 15 [NASA ADS] [CrossRef] [Google Scholar]
- Novotny, O., Wilhelm, P., Paul, D., et al. 2019, Science, 365, 676 [CrossRef] [Google Scholar]
- Pavanello, M., Bubin, S., Molski, M., & Adamowicz, L. 2005, J. Chem. Phys., 123, 104306 [NASA ADS] [CrossRef] [Google Scholar]
- Porter, R. L., Ferland, G. J., Storey, P. J., & Detisch, M. J. 2012, MNRAS, 425, L28 [NASA ADS] [Google Scholar]
- Porter, R. L., Ferland, G. J., Storey, P. J., & Detisch, M. J. 2013, MNRAS, 433, L89 [NASA ADS] [CrossRef] [Google Scholar]
- Roberge, W., & Dalgarno, A. 1982, ApJ, 255, 489 [NASA ADS] [CrossRef] [Google Scholar]
- Rouleau, F., & Martin, P. G. 1991, ApJ, 377, 526 [NASA ADS] [CrossRef] [Google Scholar]
- Santander-Garcia, M., Bujarrabal, V., & Alcolea, J. 2012, A&A, 545, A114 [NASA ADS] [CrossRef] [EDP Sciences] [Google Scholar]
- Schönberner, D., Balick, B., & Jacob, R. 2018, A&A, 609, A126 [NASA ADS] [CrossRef] [EDP Sciences] [Google Scholar]
- Sil, M., Das, A., Das, R., et al. 2024, A&A, 692, A264 [NASA ADS] [CrossRef] [EDP Sciences] [Google Scholar]
- Storey, P. J., & Hummer, D. G. 1995, MNRAS, 272, 41 [NASA ADS] [CrossRef] [Google Scholar]
- Tennyson, J., Yurchenko, S. N., Al-Refaie, A. F., et al. 2016, J. Mol. Spectr., 327, 73 [NASA ADS] [CrossRef] [Google Scholar]
- van der Tak, F. F. S., Black, J. H., Schöier, F. L., Jansen, D. J., & van Dishoeck, E. F. 2007, A&A, 468, 627 [NASA ADS] [CrossRef] [EDP Sciences] [Google Scholar]
- Waibel, H., Ruf, M. W., & Hotop, H. 1988, Z. fur Phys. D Atoms Mol. Clust., 9, 191 [Google Scholar]
- Weidmann, W. A., Mari, M. B., Schmidt, E. O., et al. 2020, A&A, 640, A10 [NASA ADS] [CrossRef] [EDP Sciences] [Google Scholar]
- Werner, H.-J., Knowles, P. J., Knizia, G., Manby, F. R., & Schütz, M. 2012, WIREs Comput. Mol. Sci., 2, 242 [Google Scholar]
- Zhang, Y., Liu, X. W., Luo, S. G., Péquignot, D., & Barlow, M. J. 2005, A&A, 442, 249 [NASA ADS] [CrossRef] [EDP Sciences] [Google Scholar]
- Zijlstra, A. A., van Hoof, P. A. M., & Perley, R. A. 2008, ApJ, 681, 1296 [NASA ADS] [CrossRef] [Google Scholar]
This reaction,  , is included in our network with a rate coefficient of 3.00 × 10⁻¹⁰ exp(−6717/T) cm3 s−1 (Black 1978).
All Tables
Initial gas-phase elemental abundances with respect to total hydrogen nuclei(a) used in the CLOUDY model.
Summary of the best-fit posterior physical parameters obtained from the RADEX-MCMC model with chemical pumping.
Comparison between the observed and the RADEX-MCMC best-fitted model parameters(a) predicted HeH+ line fluxes.
All Figures
|
Fig. 1 Top panel: equilibrium temperature and densities of H, H+, H2, |
| In the text | |
|
Fig. 2 Ro-vibrational population diagram of HeH+ (υ, J) as predicted by RADEX with and without considering chemical pumping for the bestfit parameters noted in Table 6. |
| In the text | |
|
Fig. 3 HeH+ line surface brightness variation with wavelength (in μm) as predicted by the best-fit RADEX-MCMC model parameters noted in Table 6. The left panel is without pumping, and the right panel is considering pumping. |
| In the text | |
|
Fig. C.1 HeH+ line flux ratio predicted by RADEX for the two detected ro-vibrational lines (υ, J) = (1,1) → (0,2) [P(2)] and (1,0) → (0,1) [P(1)] as a function of the rate coefficient ratio for the excitation transitions (0,0) → (1,1) and (0,0) → (1,0). The hatched blue area represents the observed ratio. The red and green circles denote the predicted line ratio when using the CB (default) or MQDT rate coefficients for the excitation (0,0) → (1,1). See text for more details. |
| In the text | |
|
Fig. D.1 Exploring parameter space using RADEX-MCMC “corner plot” showing the distribution of Tkin, n(e−), n(H), and N(HeH+) (in the log10 scale) within the prior intervals [3:4.3], [4:6], [3:6], and [10:13], respectively, in the diagonal panels and the correlation between any pair of them (off-diagonal panels). The central dashed, vertical line in each diagonal panel shows the most likely parameters based on the χ2 likelihood (the other vertical lines show the 16% and 84% quantiles). The contours of the corner plot (2D plots) represent the 1 σ and 2σ levels at the 39.3% and 86.4% confidence levels. |
| In the text | |
Current usage metrics show cumulative count of Article Views (full-text article views including HTML views, PDF and ePub downloads, according to the available data) and Abstracts Views on Vision4Press platform.
Data correspond to usage on the plateform after 2015. The current usage metrics is available 48-96 hours after online publication and is updated daily on week days.
Initial download of the metrics may take a while.