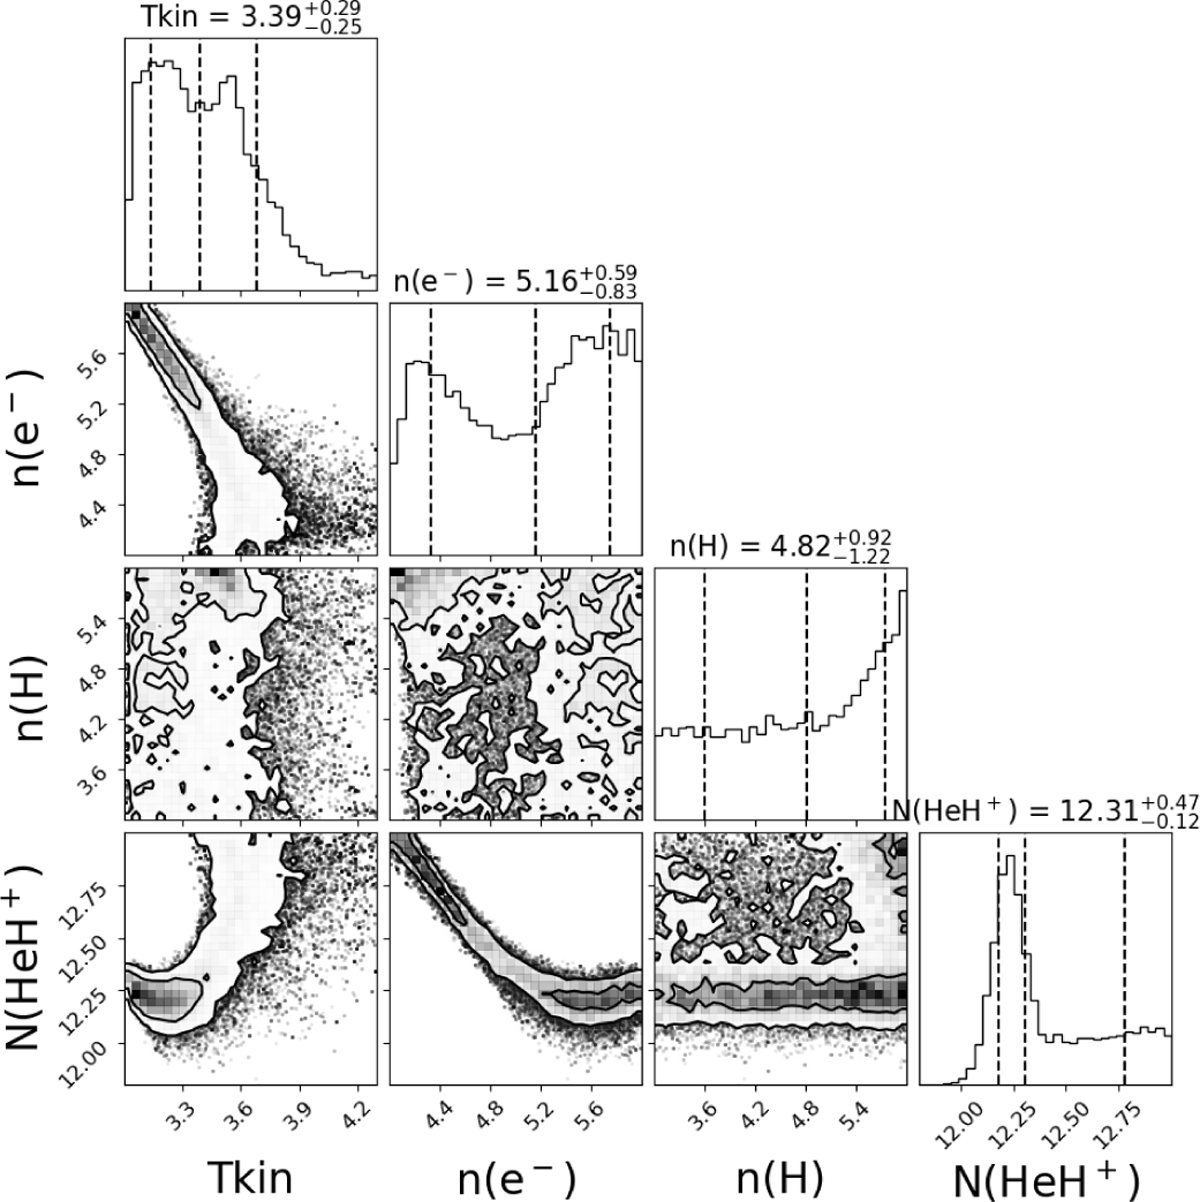
Fig. D.1
Download original image
Exploring parameter space using RADEX-MCMC “corner plot” showing the distribution of Tkin, n(e−), n(H), and N(HeH+) (in the log10 scale) within the prior intervals [3:4.3], [4:6], [3:6], and [10:13], respectively, in the diagonal panels and the correlation between any pair of them (off-diagonal panels). The central dashed, vertical line in each diagonal panel shows the most likely parameters based on the χ2 likelihood (the other vertical lines show the 16% and 84% quantiles). The contours of the corner plot (2D plots) represent the 1 σ and 2σ levels at the 39.3% and 86.4% confidence levels.
Current usage metrics show cumulative count of Article Views (full-text article views including HTML views, PDF and ePub downloads, according to the available data) and Abstracts Views on Vision4Press platform.
Data correspond to usage on the plateform after 2015. The current usage metrics is available 48-96 hours after online publication and is updated daily on week days.
Initial download of the metrics may take a while.