Fig. C.1
Download original image
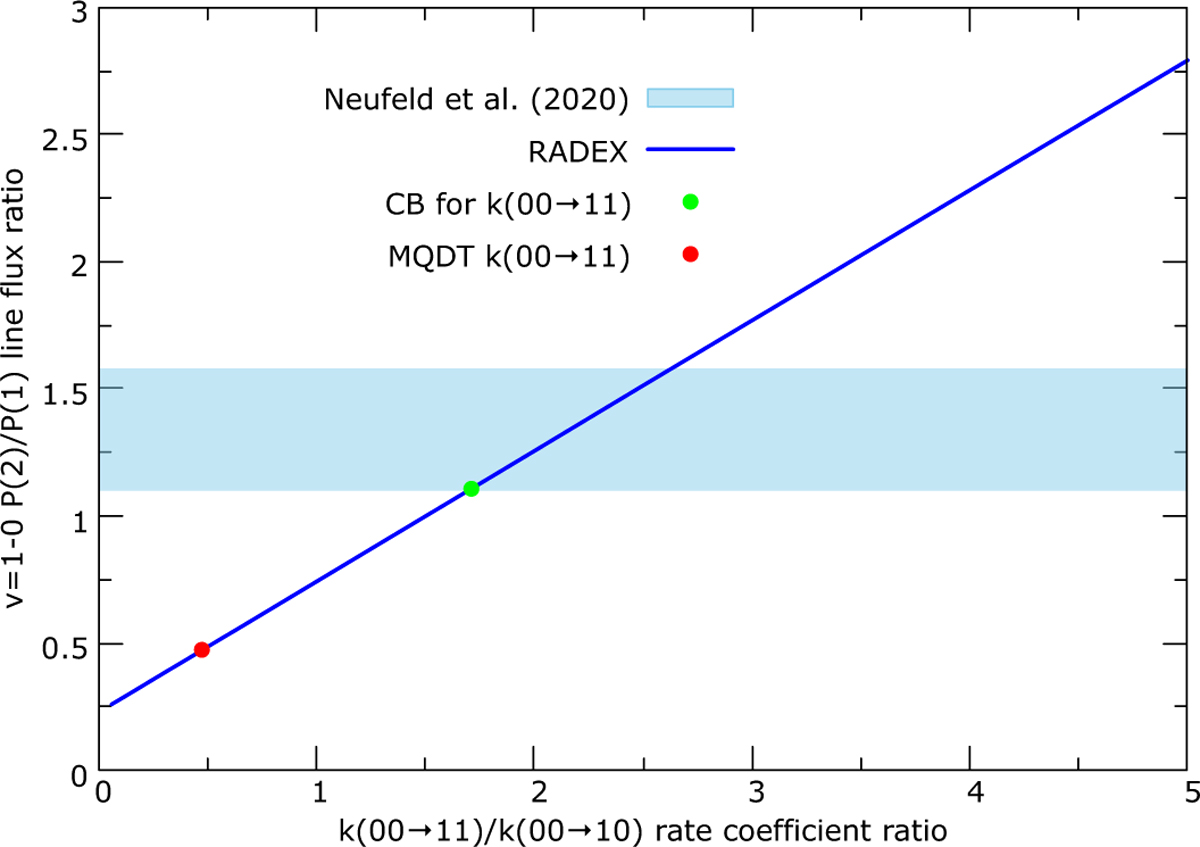
HeH+ line flux ratio predicted by RADEX for the two detected ro-vibrational lines (υ, J) = (1,1) → (0,2) [P(2)] and (1,0) → (0,1) [P(1)] as a function of the rate coefficient ratio for the excitation transitions (0,0) → (1,1) and (0,0) → (1,0). The hatched blue area represents the observed ratio. The red and green circles denote the predicted line ratio when using the CB (default) or MQDT rate coefficients for the excitation (0,0) → (1,1). See text for more details.
Current usage metrics show cumulative count of Article Views (full-text article views including HTML views, PDF and ePub downloads, according to the available data) and Abstracts Views on Vision4Press platform.
Data correspond to usage on the plateform after 2015. The current usage metrics is available 48-96 hours after online publication and is updated daily on week days.
Initial download of the metrics may take a while.