Fig. 2.
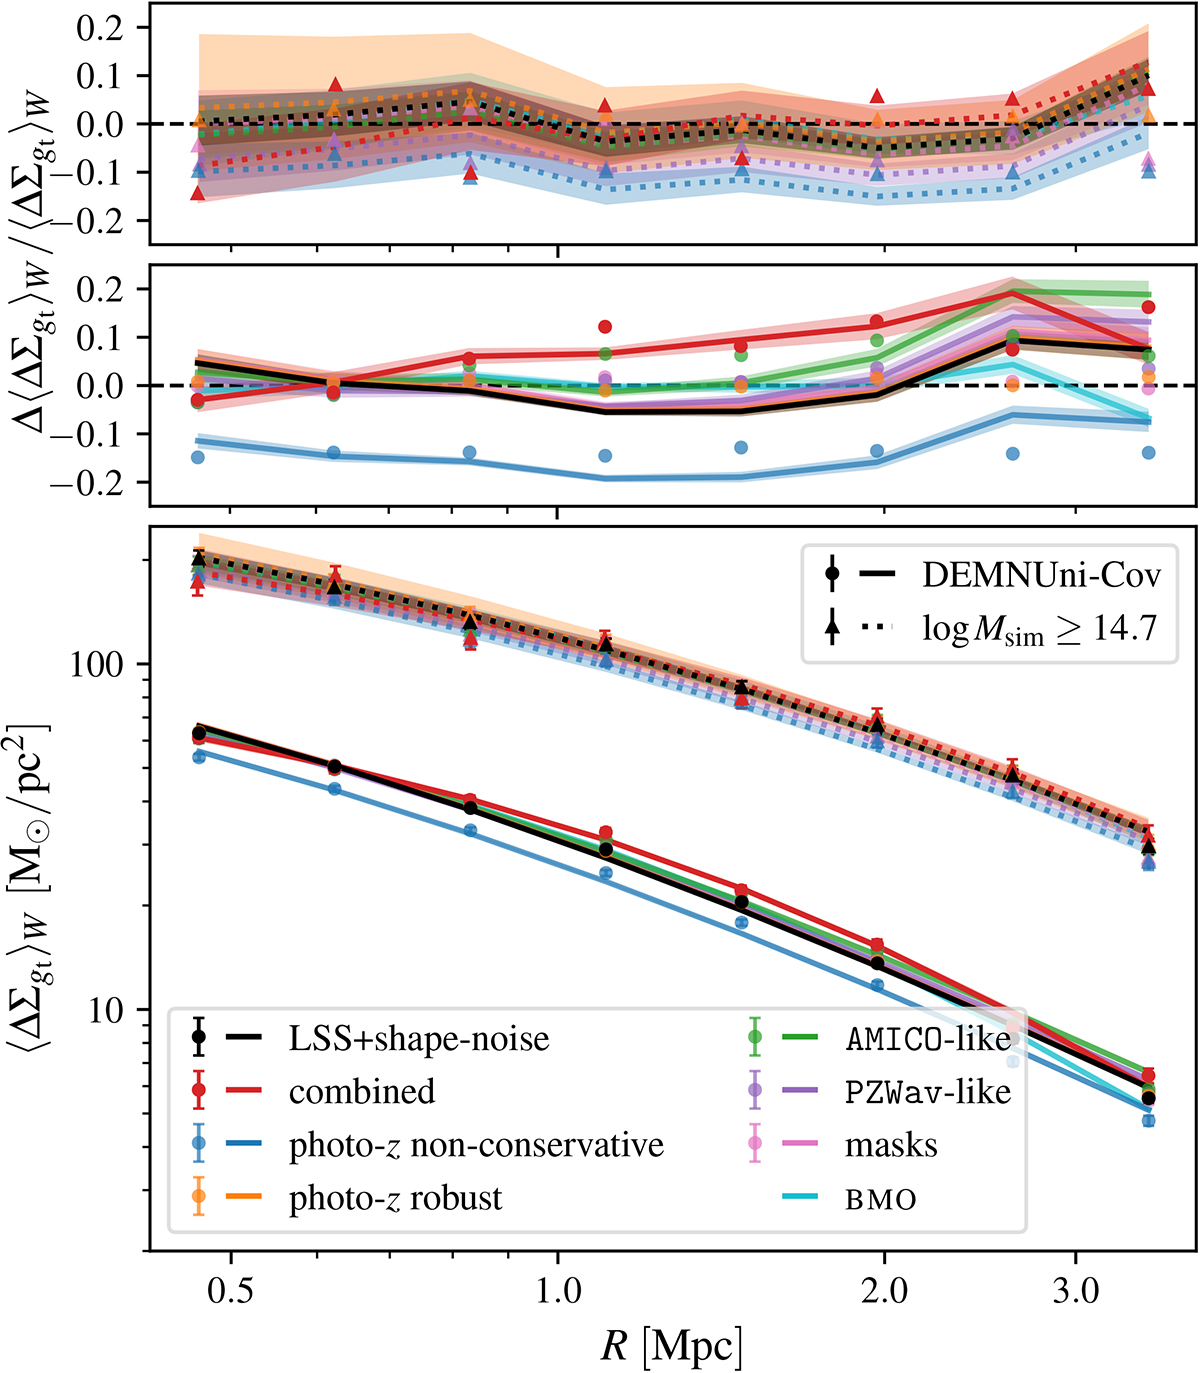
Download original image
Average excess surface density and maximum likelihood NFW / BMO density fitted models. The figure shows the density profiles for the LSS plus shape noise (Sect. 4), non-conservative photo-z selection (Sect. 5.1.1), robust photo-z selection (Sect. 5.1.2), AMICO-like sample (Sect. 5.2), PZWav-like sample (Sect. 5.2), masks (Sect. 5.3), BMO model (Sect. 6.1), and combined effects (Sect. 7). Signals are shown either for the full sample, or for the massive subsample at log Msim ≥ 14.7. The top panels show the relative change with respect to the fiducial shape and LSS noise shear data (points), and with respect to their models (lines).
Current usage metrics show cumulative count of Article Views (full-text article views including HTML views, PDF and ePub downloads, according to the available data) and Abstracts Views on Vision4Press platform.
Data correspond to usage on the plateform after 2015. The current usage metrics is available 48-96 hours after online publication and is updated daily on week days.
Initial download of the metrics may take a while.