| Issue |
A&A
Volume 695, March 2025
|
|
|---|---|---|
| Article Number | A113 | |
| Number of page(s) | 11 | |
| Section | Galactic structure, stellar clusters and populations | |
| DOI | https://doi.org/10.1051/0004-6361/202451517 | |
| Published online | 12 March 2025 | |
The Pristine survey
XXVI. Chemical abundances of subgiant stars of the extremely metal-poor stream C-19★
1
GEPI, Observatoire de Paris, Université PSL, CNRS,
5 Place Jules Janssen,
92190
Meudon, France
2
GEPI, Observatoire de Paris, Université PSL, CNRS,
77 Av. Denfert-Rochereau,
75014
Paris, France
3
UPJV, Université de Picardie Jules Verne,
33 rue St Leu,
80080
Amiens, France
4
Université de Strasbourg, CNRS, Observatoire astronomique de Strasbourg,
UMR 7550,
67000
Strasbourg, France
5
Université Côte d’Azur, Observatoire de la Côte d’Azur, CNRS, Laboratoire Lagrange,
06304
Nice, France
6
Instituto de Astrofísica de Canarias,
38205
La Laguna, Tenerife, Spain
7
Departamento de Astrofísica, Universidad de La Laguna,
38206
La Laguna, Tenerife, Spain
8
Kapteyn Astronomical Institute, University of Groningen,
Landleven 12,
9747
AD Groningen, The Netherlands
9
Dipartimento di Fisica e Astronomia, Università degli Studi di Bologna,
Via Gobetti 93/2,
40129
Bologna, Italy
10
INAF – Astrophysics and Space Science Observatory of Bologna,
Via Gobetti 93/3,
40129
Bologna, Italy
11
McWilliams Center for Cosmology, Department of Physics, Carnegie Mellon University,
Pittsburgh,
PA
15213 USA
12
Max Plank Institute for Astronomy (MPIA),
Königstuhl 17,
69117
Heidelberg, Germany
13
Department of Physics and Astronomy, University of Victoria,
Victoria,
BC,
V8P 5C2, Canada
14
DARK, Niels Bohr Institute, University of Copenhagen,
Jagtvej 128,
2200
Copenhagen, Denmark
★★ Corresponding author; This email address is being protected from spambots. You need JavaScript enabled to view it.
Received:
15
July
2024
Accepted:
14
December
2024
Abstract
Context. The C-19 stellar stream is the most metal-poor stream known to date. While its wth and velocity dispersion indicate a dwarf galaxy origin, its metallicity spread and abundance patterns are more similar to those of globular clusters (GCs). If it is indeed of GC origin, its extremely low metallicity ([Fe/H]=−3.4, estimated from giant stars) implies that these stellar systems can form out of gas that is as extremely poor in metals as this. Previously, only giant stream stars were observed spectroscopically, although the majority of stream stars are unevolved stars.
Aims. We pushed the spectroscopic observations to the subgiant branch stars (G ≈ 20) in order to consolate the chemical and dynamical properties of C-19.
Methods. We used the high-efficiency spectrograph X-shooter fed by the ESO 8.2m VLT telescope to observe 15 candate subgiant C-19 members. The spectra were used to measure radial velocities and to determine chemical abundances using the MyGIsFOS code.
Results. We developed a likelihood model that takes metallicity and radial velocities into account. We conclude that 12 stars are likely members of C-19, while 3 stars (S05, S12, and S13) are likely contaminants. When these 3 stars are excluded, our model implies a mean metallicity 〈[Fe/H]〉 = −3.1 ± 0.1, the mean radial velocity is 〈vr〉 = −192 ± 3km s−1, and the velocity dispersion is σvr = 5.9−5.9+3.6 km s−1. This all agrees within errors with previous studies. The A(Mg) of a sample of 15 C-19 members, including 6 giant stars, shows a standard deviation of 0.44 dex, and the mean uncertainty on Mg is 0.25 dex.
Conclusions. Our preferred interpretation of the current data is that C-19 is a disrupted GC. We cannot completely rule out the possibility that the GC could have belonged to a dwarf galaxy that contained more metal-rich stars, however. This scenario would explain the radial velocity members at higher metallicity, as well as the wth and velocity dispersion of the stream. In either case, a GC formed out of gas as poor in metals as these stars seems necessary to explain the existence of C-19. The possibility that no GC was associated with C-19 cannot be ruled out either.
Key words: stars: abundances / stars: Population II / Galaxy: abundances / Galaxy: formation / globular clusters: general / Galaxy: kinematics and dynamics
Based on observations made at ESO with X-shooter, programme 109.231F.001.
© The Authors 2025
 Open Access article, published by EDP Sciences, under the terms of the Creative Commons Attribution License (https://creativecommons.org/licenses/by/4.0), which permits unrestricted use, distribution, and reproduction in any medium, provided the original work is properly cited.
This article is published in open access under the Subscribe to Open model. This email address is being protected from spambots. You need JavaScript enabled to view it. to support open access publication.
1 Introduction
Stream C-19 was discovered by Ibata et al. (2021). Based on more spectra, some of which have a high resolution, Martin et al. (2022) interpreted it as a disrupted GC because of its very low metallicity dispersion and for a spread in Na abundances that is consistent with what is observed in bound GCs (Gratton et al. 2001), but not in dwarf galaxies (see e.g. Simon 2019; McConnachie & Venn 2020, and references therein) or among Galactic halo field stars (see e.g. Matteucci 2021, and references therein). C-19 is exceptional through its mean metallicity ([Fe/H]=−3.4), which is more metal poor by an order of magnitude than the most metal-poor GC known (Harris 1996). The formation of GCs is only poorly understood. Although many theories have been put forward (see e.g. Madau et al. 2020, and references therein), none has gained widespread consensus. The fact that no Galactic GC is observed below [Fe/H] = −2.5 was even interpreted as a floor below which GCs cannot form (see e.g. Kruijssen et al. 2019; Beasley et al. 2019). If C-19 is indeed a disrupted GC, this notion has to be abandoned or the level of the floor has to be pushed back by an order of magnitude.
While the abundance variations and metallicity spread of C-19 are consistent with a GC origin, its width (~200 pc) and velocity dispersion (~6 km s−1) are more naturally reproduced if the progenitor contained substantial amounts of dark matter, similar to a dwarf galaxy (Errani et al. 2022).
All the C-19 stars that were studied spectroscopically so far (Martin et al. 2022; Yuan et al. 2022; Viswanathan et al. 2025; Venn et al., in prep.) have been giants. In order to gain further insight into the nature of C-19 and to constrain its age from the study of the colour-magnitude diagram of its confirmed members, we decided to push the observations to the subgiant branch, which is at magnitude G ≈ 20. To do this, we used the high-efficiency spectrograph X-shooter on the ESO 8.2 m In this paper, we describe the analysis and the results of these observations.
2 Target selection, observations, and data reduction
Martin et al. (2022) selected candidate members in the core of the C-19 stellar stream using the algorithm STREAMFINDER (Ibata et al. 2021). The brightest candidates on the red giant branch were observed, and the observations were discussed in Martin et al. (2022). In Fig. 1 of the same paper, a set of candidates among subgiant and turn-off was presented as well. Our targets span the range 19.5 ≤ G ≤ 19.7. We estimated that we could obtain a useful spectrum in this magnitude range in a one- hour observation with X-shooter (Vernet et al. 2011) at the VLT. The 15 selected targets were observed in service mode between June 8, 2022, and October 17, 2022. Most observations had A quality, and only three had B quality. Each star was observed for a one-hour observing block in stare mode, which implies an integration time of about 3100 s. We used a 1.″3 slit in the UVB arm, 1.″5 slit in the VIS arm, and 5.″0 slit in the NIR arm. The signal-to-noise ratios (S/N) of all the NIR spectra were too low to be scientifically exploited, and the spectra are not discussed further. The UVB and VIS CCDs were binned 2 × 2. Because the slits we used were wide, this did not degrade the resolving power. The resolving power in the two arms is 4100 in the UVB and 5000 in the VIS. The signal-to-noise ratio of our spectra ranged from 15 to 50 at 487 nm, with a mean of 38. The spectra were reduced by us using the X-shooter pipeline (Goldoni et al. 2006). In Fig. 1 we show several spectral regions of the UBV and VIS arms. The Ca II K 393.3 nm line and the Mg Ib triplet lines are clearly visible, in particular, the Mg Ib 518.3 nm line. The S12 and S13 targets are apparently significantly richer in metals, from the Ca II K feature, and S05 also show a stronger Ca II feature than the other targets. The carbon band (G-band) at 430 nm appears to be difficult to detect because most of the targets are not enhanced in C. However, S12 seems to have a stronger G band. Finally, the S/N together with the resolving power make it difficult to detect the Li I doublet feature.
3 Data analysis
For each spectrum, we determined the radial velocity from the VIS spectrum. We used our own code for the template matching, using a stellar synthetic spectrum with parameters close to those of each star as a template. This was extracted from the synthetic grid that we used for the abundance analysis. In addition, we used a template for the telluric absorption lines computed by the TAPAS service (Bertaux et al. 2014)1. The observed spectrum was normalised using a spline through interactively defined continuum points. The normalised stellar spectrum and telluric absorption were then allowed to shift, each independent of the other, in order to minimise the χ2 function. The observed radial velocity was then obtained by subtracting the velocity of the telluric lines from the velocity of the stellar lines. The barycentric radial velocity of the star was finally obtained by adding the barycentric correction to the observed radial velocity. The radial velocities are provided in Table A.1. The formal error on the fit is smaller than 1.5 km s−1 for all stars except for S09, for which it is 7.3 km s−1. The pipeline corrects the wavelength scale for the instrument flexures, and our use of telluric lines should correct for the centring of the star on the slit. According the X-shooter manual2, the systematic wavelength accuracy is 7.5 km s−1 in the VIS arm. We estimated the total error on our measurements by adding this value linearly to the statistical error.
We note that when it is cross-correlated with a synthetic template, star S09 shows an asymmetry in its correlation function for the UVB and VIS spectra. This is reflected in its large velocity uncertainty. We suspect that this star is an SB2 binary, and our derived abundances should therefore also be considered with caution for this star.
We determined atmospheric parameters for all the stars using the Gaia photometry together with an assumed distance of 18 kpc, A(V) = 0.048 and an assumed mass of 0.8 M⊙. The method is iterative and was described in detail in Lombardo et al. (2021). In short: The effective temperature was derived from the GBP – GRP colour by interpolating in a grid of synthetic colours, then the surface gravity was derived from the Stefan-Boltzmann equation for the given effective temperature, observed G, and distance. At each step in the iteration, extinction coefficients were interpolated in a grid of synthetic coefficients. The resulting dereddened colours, along with the Gaia photometric errors, are provided in Table A.1. The effective temperatures and surface gravities are provided in Table A.2. The error on the effective temperatures is dominated by the photometric error on the GBP – GRP colour. While for our stars, the Gaia G magnitudes have a precision of a few milli-magnitudes, the colours have photometric errors of up to 0.076 magnitudes, which translates into errors in effective temperature of up to 300 K. We interpret this as a combined effect of the narrower bands and the fewer transits in GBP and GRP with respect to G. Had we used the calibration of Mucciarelli et al. (2021) to derive effective temperatures we would have derived temperatures that are 71 K cooler on average, with a standard deviation of 42 K. We consider this systematic error negligible with respect to the errors implied by the photometric errors.
The error in surface gravity is dominated by the distance estimate (see Sect. 4) and amounts to 0.12 dex from 18 kpc to 20.9 kpc. The error on G is negligible; the error on GBP – GRP, however, implies an error on log g in the range 0.04 to 0.08 dex. The errors on log g provided in Table A.2 were obtained by adding these two errors in quadrature.
Keeping the effective temperature and gravity fixed, we derived the chemical abundances of Fe and Mg using MyGIsFOS (Sbordone et al. 2014). The grid of theoretical spectra used with MyGIsFOS was computed from a grid of ATLAS 12 models (L. Sbordone, priv. comm.; Kurucz 2005), and the atomic data used were those of Heiter et al. (2021). The results are provided in Tables A.2 and A.3. The systematic uncertainties on the abundances due to the uncertainties in the atmospheric parameters were investigated by François et al. (2018) for star SDSS J154746+242953, whose atmospheric parameters are similar to those of our stars. Their investigation also used X-shooter spectra. For Mg, the effect of an error of 100 K in Teff is 0.1 dex, and for an error of 0.3 dex in log g it is −0.1 dex. A change of 0.5 km s−1 results in a change of −0.15 dex.
The 15 observed stars clearly show a sizeable spread in [Fe/H] that ranges from −3.4 to −1.7, which is at odds with the results obtained for the sample of giant stars in Martin et al. (2022), Yuan et al. (2022), and Viswanathan et al. (2025). This spread may be genuine, but may also be driven by the contaminants in the sample. In order to ensure that this result is solid, one of us (PFR) reanalysed the sample of stars using MARCS models and line-profile fitting using synthetic spectra computed with turbospectrum (Alvarez & Plez 1998; Plez 2012). This independent analysis confirmed the results presented in Table A.2.
Figure 2 shows the radial velocities of the stars in our sample. Overall, the sample overlaps in velocity with stream members that were confirmed by Martin et al. (2022) and Yuan et al. (2022). As mentioned above, however, the metallicities show a wider spread when taken at face value. One of the goals when we gathered this sample was to confirm the fairly large velocity dispersion of the C-19 stars and their uniform metallicities. This critically depends on distinguishing genuine C-19 members from halo contaminants. All stars were selected from the STREAMFINDER sample of C-19 and therefore have proper motions, distances, and positions in the colour-magnitude diagram that are by design consistent with them being members of the C-19 stream. We can only rely on the radial velocities and metallicities obtained from the X-shooter spectra to assess membership.
We started by building a generic likelihood model that is agnostic about the membership or contaminant status of each observed star. This model was defined over the range −350 < Vr < −160 km s−1 and −3.7 < [Fe/H] < −1.6, where all observed stars are located. It included a C-19 component, modelled as a normal function in velocity and metallicity space, and a contamination component, also modelled as a two-dimensional normal function in both dimensions. The likelihood is therefore
![Mathematical equation: $\eqalign{ & {\cal L}\left( {\left\{ {{V_{r,i}},\delta {V_{r,i}},{{[{\rm{Fe}}/{\rm{H}}]}_i},\delta {{[{\rm{Fe}}/{\rm{H}}]}_i}} \right\}\mid \eta ,\left\langle {{\upsilon _r}} \right\rangle ,{\sigma _{ur}},\langle [{\rm{Fe}}/{\rm{H}}]\rangle ,{\sigma _{[{\rm{Fe}}/{\rm{H}}]}}} \right) \cr & \,\,\,\,\, = \prod\limits_i {\left\{ {(1 - \eta ){\cal N}\left( {{V_{r,i}},\delta {V_{r,i}}\mid \left\langle {{\upsilon _r}} \right\rangle ,{\sigma _{\upsilon r}}} \right)} \right.} \cr & \,\,\,\,\,\left. { \times {\cal N}({{[{\rm{Fe}}/{\rm{H}}]}_i},\delta {{[{\rm{Fe}}/{\rm{H}}]}_i}\mid \left\langle {[{\rm{Fe}}} \right./{\rm{H}}]\rangle ,{\sigma _{[{\rm{Fe}}/{\rm{H}}]}}} \right) \cr & \,\,\, + \eta {\cal N}\left( {{V_{r,i}},\delta {V_{r,i}}\left\langle {{\upsilon _{r,{\rm{ cont }}}}} \right\rangle ,{\sigma _{\upsilon r,{\rm{ cont }}}}} \right) \cr & \,\,\,\left. { \times {\cal N}\left( {{{[{\rm{Fe}}/{\rm{H}}]}_i},\delta {{[{\rm{Fe}}/{\rm{H}}]}_i}\mid \left\langle {{{[{\rm{Fe}}/{\rm{H}}]}_{{\rm{cont }}}}} \right\rangle ,{\sigma _{[{\rm{Fe}}/{\rm{H}}],{\rm{ cont }}}}} \right)} \right\}. \cr} $](/articles/aa/full_html/2025/03/aa51517-24/aa51517-24-eq1.png)
Here, N is the normal function defined as

with  and A a normalisation constant such that the normal function integrates to unity for the range over which it is defined. The set {Vr,i, δVr,i, [Fe/H]i, δ[Fe/H]i} represents the set of X-shooter velocities and metallicities and the associated uncertainties, as listed in Tables A.1 and A.2. The parameters of interest are (η 〈vr〉, σvr, 〈[Fe/H]〉, σ[Fe/H]), which correspond to the contamination fraction, the velocity mean and dispersion, and the metallicity mean and dispersion, respectively.
To simplify the calculations and because the STREAMFINDER selection of potential C-19 members makes it very likely that any contaminant belongs to the halo, we fixed the parameters of the contamination part of the model to generic expectations of the velocity and metallicity distribution of halo contaminants: 〈vr,cont〉 = −180 km s−1 (which is equivalent to vgsr ~ 0 km s−1),  , 〈[Fe/H]cont〉 = −1.5, and σ[Fe/H],cont = 0.3. Since the model was only defined over a limited velocity and metallicity range, the metallicity parameters, while simplistic, mainly aimed to reproduce the slope of the halo metallicity distribution function in the regime of interest, [Fe/H] < −1.6.
We explored the parameter space with our own implementation of a Metropolis-Hastings algorithm (Metropolis et al. 1953; Hastings 1970), and we evaluated the combined posterior distribution on these five parameters assuming flat priors. The marginalised one- and two-dimensional probability distribution functions (PDFs) are shown in grey in Fig. 3. The model is ambivalent about the overall properties of C-19 based on the X-shooter sample, and this is reflected in particular in the poor constraints on the metallicity parameters. We note, however, that the model favours a non-negligible fraction of contaminants, which in most cases translates into an expectation of two to three contaminants in the sample of 15 stars observed with X-shooter. In particular, stars S05 (high-velocity offset and high metallicity), S12 (somewhat offset in velocity and high metallicity), and S13 (same diagnostic as S12) have high probabilities (>0.7) of being contaminant members for most evaluations of the likelihood in the MCMC chain. S06 is the only other star that is not unambiguously a C-19 member, but whose probability of being a contaminant is significantly lower (<0.3; somewhat offset in velocity and fairly high metallicity, but with a large uncertainty).
To better visualise the situation, we show in Fig. 4 [Fe/H] versus radial velocity for all the 15 stars observed with X-shooter. Inspired by these results, we also inferred the properties of the C- 19 members after removing the three likely contaminants (S05, S12, and S13) and for a model without contamination (η = 0). The resulting posterior PDFs are displayed in red in Fig. 3 and show properties that are better constrained, but also PDFs that are better behaved. In what follows, we base our discussion on these posterior PDFs, but we recognise that they are sensitive to our choice of removing the three likely contaminants.
The inference on the mean radial velocity of the X-shooter sample, 〈vr〉 = −192 ± 3 km s−1, agrees well with previous studies. The constraint on the velocity dispersion of the sample,  , is unfortunately,plagued by the large systematic uncertainty floor that stems from the X-shooter spectrograph. While it perfectly agrees with the previous estimate by Yuan et al. (2022,
  ), it does not lead to a better-constrained parameter.
For the metallicity part of the model, we inferred a mean metallicity 〈[Fe/H]〉 = −3.1 ± 0.1 and a dispersion that formally favours a non-zero dispersion, but is entirely consistent with zero: ![Mathematical equation: ${\sigma _{[{\rm{Fe}}/{\rm{H}}]}} = 0.09_{ - 0.09}^{ + 0.13}$](/articles/aa/full_html/2025/03/aa51517-24/aa51517-24-eq7.png) , or σ[Fe/H] < 0.35 at the 95% confidence level, to be compared with σ[Fe/H] < 0.18 at the 95% confidence level as determined by Martin et al. (2022) from a smaller sample of brighter stars.
, or σ[Fe/H] < 0.35 at the 95% confidence level, to be compared with σ[Fe/H] < 0.18 at the 95% confidence level as determined by Martin et al. (2022) from a smaller sample of brighter stars.
Overall, we confirm previous results from Martin et al. (2022), Yuan et al. (2022), and Viswanathan et al. (2025), but the new velocities and metallicities, taken independently from previous studies, do not lead to stronger constraints on the velocity and metallicity dispersions of C-19 stars.
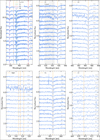 |
Fig. 1 X-shooter spectra of the targets in several spectral regions of the UBV and VIS arms. |
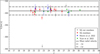 |
Fig. 2 Radial velocities of our program stars and the stars from Martin et al. (2022) and Yuan et al. (2022) plotted as a function of declination. The dashed lines indicate three σ shifts from the mean value (represented by the thick line). |
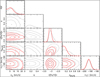 |
Fig. 3 Probability distribution functions for the five parameters of the inference on the properties of the combined velocity and metallicity distribution of C-19 members. The five parameters are the fraction of contaminants, η, and the mean and dispersion of the velocity (⟨vr⟩ and sigmavr) and metallicity (⟨[Fe/H]⟩ and σ[Fe/H]) parts of the model. The top panel of each column shows the one-dimensional marginalised probability distribution functions from which the favoured parameter models and related uncertainties are determined. The red contours and histograms show the same after the three likely contaminant stars are removed and the MW contamination is fixed to η = 0. |
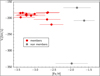 |
Fig. 4 [Fe/H] vs. radial velocity for all the observed stars. The likely member stars are shown in red, and the three likely contaminants are shown in grey. |
4 Colour-magnitude diagram, distance, and age
One of the goals of the observations was to constrain the age of C-19 from a study of the colour-magnitude diagram of its confirmed members. For this purpose, we adopted the pipeline of Kordopatis et al. (2023) to obtain an age estimation for the stars via the projection of different sets of parameters on α-enhanced BaSTI isochrones ([α/Fe]=0.4, Y=0.247) up to τ = 16 Ga. In Table A.4, the results of three different projections are considered, which were obtained using
Teff, log g and [Fel/H] (labelled τ1);
Teff, log g, [Fel/H] and absolute G0 assuming d=18 kpc (labelled τ2);
Teff, log g-0.12, [FeI/H] and absolute G0 assuming d=20.9 kpc (labelled τ3).
For τ3, the surface gravities are corrected by −0.12 to account for the larger adopted distance.
The ages as a function of Vr and [Fe/H] are shown in Fig. 5. Whereas the age values may change between the different projections, values consistently older than 11 Gyr are found for the bulk of the stars. Depending on the projection, three to five stars stand outside the age-Vr clump. Amongst these, stars S12 and S13 are always too young, and S04 appears to be too young in the τ2 and τ3 projections. Quite interestingly, star S04 is also at the edge of the metallicity distribution, although it has almost the same metallicity as S10. It would therefore not be possible to exclude it as member simply because of its metallicity.
In Fig. 6 we show the Gaia colour-magnitude diagram for all the C-19 members that were studied spectroscopically. The Gaia broad-band colours were corrected assuming the reddening from the maps of Schlafly & Finkbeiner (2011), and the extinction coefficients were interpolated in a grid of theoretical values (Mucciarelli et al. in preparation) during the process of parameter determination. As a comparison, we used the most metal-poor α-enhanced BASTI isochrones (Pietrinferni et al. 2021) available at [Fe/H]=−3.2. We chose the helium abundance Y=0.247 because the use of higher available He abundances had second- order effects on the subgiant and the red giant branch. We show three isochrones corresponding to the average age of the bulk of the subgiant (SG) stars in the different projections: 12.80 Ga (τ1), 14.23 Ga (τ2), and 11.90 Ga (τ3). For the preferred distance of 18 kpc, the implied age is 14.1 Ga, which is older than the age of the Universe  Ga Paradiso et al. 2023), as derived from the fluctuations of the cosmic microwave background, measured by the Planck mission (Planck Collaboration I 2016). When we instead consider the distance 20.9 kpc, which is preferred from the Gaia parallaxes (Martin et al. 2022) and measured photometric distances using Bayesian inference on photometry, parallax, and metallicity (Viswanathan et al. 2025), the implied age is 13.43 Ga, which is slightly younger than the age of the Universe.
5 Discussion
Our statistical analysis of the 15 stars in the X-shooter sample suggests that most of the observed metallicity spread is driven by the three halo contaminants (stars S05, S12, and S13). The resulting velocity and metallicity properties of the sample of 12 likely members yield results that are entirely consistent with those provided for C-19 by Martin et al. (2022) and Yuan et al. (2022). In particular, we derive  and σ[Fe/H] < 0.35 at the 95% confidence level.
We integrated the orbits for the 12 radial velocity members. The orbits of stars S12 and S13, regardless of the assumed distance, are clearly different from those of the other ten radial velocity members, which instead remain very close to each other. This is further evidence that S12 and S13 may indeed not belong to C-19. We conclude that the data support a single metallicity for the C-19 stream, with an unresolved metallicity dispersion. The analysis of the ages in Sect. 4 suggests that S04 may also be an interloper.
Further clues come from the [Fe/H]–[Mg/Fe] diagram shown in Fig. 7. For all the C-19 member stars, including those in Martin et al. (2022) and Yuan et al. (2022), we plot [Mg I/Fe I] versus [FeI/H] LTE abundances in order to be on the same scale as that of our SG stars. The use of NLTE corrections on [Mg I/Fe II] and [Fe II/H], when available, does not change the general picture. The majority of the stars of C-19 that were subject to a chemical analysis clearly belong to the metal-poor population (13 out of 16). Moreover, the metal-poor component has a sizeable dispersion in [Mg/Fe]. To better visualise the Mg abundances, we plot Fig. 9 A(Mg) only for the member subgiant stars and for the giant stars in Martin et al. (2022) and Yuan et al. (2022). When the whole sample is considered together (15 stars, nine SG, and six giants) the dispersion in A(Mg) is 0.44 dex, and the mean uncertainty on Mg is 0.25 dex. We interpret this as evidence that the dispersion in the Mg abundances among C-19 stars is higher than what can be expected based on observational uncertainties alone.
To further substantiate the evidence of intrinsic variation in Mg among the C-19 SG stars, we selected two pairs of stars with similar atmospheric parameters (S1/S11 and S8/S14; see Table A.2). The top panel of Fig. 8 displays a zoomed view around the strong Hβ line for these stars and reveals virtually identical profiles. The middle panel shows the spectra of the selected stars around the Mg I 518.3 nm line. Stars S1 and S11, as well as stars S8 and S14, exhibit virtually identical stellar parameters as observed, but differences may be noted in the strength of the Mg line. This further confirms the evidence for an intrinsic Mg spread in C-19, as already seen among giant stars.
Finally, we considered the probability distribution function of the Mg abundance for the nine C-19 members with a measured Mg, but we excluded S06, whose membership is questionable. In Fig. 10 we show the relevant corner plot. It clearly shows that a dispersion in Mg abundances is favoured. The result would be the same had we included S06. The dispersion in Mg is strongly supported by the dispersion found among giants (Martin et al. 2022; Yuan et al. 2022), and the data of the subgiants are consistent with this dispersion. Statistically, the additional dispersion is only detected at 1.3σ when we consider the subgiant sample alone. When we arbitrarily remove the two stars with the larger error on the Mg abundance, the dispersion on A(Mg) decreases to 0.56 dex and the mean error drops to 0.27 dex. This means that the detection would be at 2σ.
The Mg-Al anti-correlation, typical of GCs (see e.g. Gratton et al. 2001), is not always observed. In particular, it is not observed in the less massive clusters or in the most metalrich clusters (e.g. Pancino et al. 2017). The significant spread in the Mg abundances may suggest that the progenitor of C-19 was as massive as NGC 4833, which displays a well-developed Mg-Al anti-correlation (Pancino et al. 2017) and has a presentday mass of about 1.6 × 10⁵ M⊙ (Mandushev et al. 1991). For NGC 4833, the database called Fundamental parameters of Galactic globular clusters3 reports an initial mass of 106 M⊙. The present-day and the initial mass of NGC 4833 are much higher than the minimum mass of C-19 of 0.8 × 10⁴ M⊙ determined by Martin et al. (2022). It is noteworthy that the spread of Mg among the C-19 stars appears to be larger than that measured in the nearby halo stellar stream ED-2 (Dodd et al. 2023), which was suggested to have originated from a disrupted low-mass star cluster (Ceccarelli et al. 2024; Balbinot et al. 2024). In their study, Balbinot et al. (2024) inferred a plausible mass range for the cluster, which appears to be relatively narrow, between 2 × 10³ M⊙ and 5.2 × 10⁴ M⊙, similar to the current stellar mass of C-19. With a measured metallicity of [Fe/H]II = −2.46 ± 0.02, ED-2 is significantly richer in metals than C-19. The evidence for a prominent Mg-Al correlation in C-19, compared to the small scatter observed in Mg and Al in ED-2 (Ceccarelli et al. 2024; Balbinot et al. 2024), agrees with the notion that in clusters (or progenitors) with comparable masses, the amplitude of the Mg-Al anti-correlation is larger for more metal-poor systems.
Two of the stars in Yuan et al. (2022) have measured Al abundances. As discussed in that paper, they support the existence of an Mg-Al anti-correlation. All the measured Na abundances also support a dispersion in Na, as expected in a GC showing an NaO anti-correlation. Unfortunately, the quality of the X-shooter spectra does not allow us to measure Na in any of the SG stars. If it could be shown that the metal-poor component includes a dispersion in Na abundances, that would be a strong indication that the metal-poor component is indeed a GC. Arguing for a GC origin on the sole basis of a negligible metallicity dispersion is inconclusive because we know of ultra-faint dwarf galaxies with very small metallicity dispersions (see e.g. Vargas et al. 2013).
Concerning the radial velocities, Yuan et al. (2022) argued that the velocity dispersion of C-19 is significantly higher than that of streams that are firmly associated with disrupted GCs. Along the same lines, Errani et al. (2022) have argued that the width and velocity dispersion of C-19 are larger than what can be obtained by disrupting a GC, and they are similar to what is expected from disrupting dwarf galaxies. Since C-19 approaches a turning point in the orbit (see Fig. 11), its line-of-sight velocity dispersion may increase (e.g. Helmi & White 1999; Viswanathan et al. 2025), but the N -body simulations studied in Errani et al. (2022) suggest that on the specific orbit of C-19, this increase alone is not sufficient to explain the radial velocity dispersion of C-19 using a simple GC progenitor. Given the lower precision of our radial velocity measurements, we can only confirm the previously determined velocity dispersion. As mentioned above, the large dispersion in Mg abundances does suggest a high mass for the C-19 progenitor.
Our favourite interpretation still is that C-19 is a disrupted GC. This view is mainly supported by the spread in [Mg/Fe] abundances and, less strongly, also by the unresolved metallic- ity dispersion. We cannot completely rule out the possibility that C-19 is a disrupted galaxy, however. In this case, it should have contained a GC (to explain the dispersion in [Mg/Fe]), which would account for most of the confirmed C-19 members. The three higher-metallicity stars reported in this study and highlighted in Fig. 7 could then be interpreted as field stars of the parent galaxy. This scenario is also supported by the combined findings of Malhan et al. (2021, 2022), who suggested that the C-19 stream was accreted inside a (now disrupted) high-redshift dwarf galaxy that gave rise to the LMS-1/Wukong merger (Naidu et al. 2020). The stars of this galaxy possessed a wide metal- licity spread and reached higher values. This association may be questioned because although both streams have polar orbits, their orbital poles point towards different directions, as shown by comparing Fig. 11 in this work and Fig. 4 in Yuan et al. (2020).
Of the Local Group dwarf spheroidal galaxies, only Fornax (Wilson 1955) and Sgr (Ibata et al. 1994) host GCs. In Fornax, all the GCs are significantly poorer in metals than the field stars (see e.g. Larsen et al. 2012, and references therein). Sagittarius has the GC M54 at its centre, which is about 1 dex poorer in metals than the field stars among which it is embedded (Mucciarelli et al. 2017; Minelli et al. 2023). The metal-poor field population of Sgr (Bonifacio et al. 2006; Hansen et al. 2018; Sestito et al. 2024) is a minor component. In a scenario of inside-out galaxy formation, the field stars could then have a higher metallicity than the stars in a GC, having formed from gas already polluted by the supernovae that exploded in the GC. If instead the galaxy formed outside-in, a metal-poor GC may have formed in its halo and then spiralled to its centre due to dynamical friction. If the GC were the centre of the putative dwarf, then this would not help us to explain the width and dispersion of the stream. They would be more consistent with a GC that was disrupted in the gravitational potential of the dwarf before accretion, which implies that the GC was not at the centre of the dwarf. Although these scenarios may in principle account for a mass of the C-19 progenitor that is higher than what can be accounted for by a GC, the current sample does not support the notion that the field population can account for a mass higher than half of the GC. This is probably not sufficient to explain the observed dispersion in radial velocity. In any case, even these scenarios require that a GC can be formed at this extremely low metallicity.
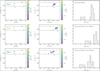 |
Fig. 5 Radial velocities as a function of metalicity and age and age histogram. Left: radial velocity vs. [Fe/H] colour-coded by age. Middle: radial velocity vs. age colour-coded by [Fe/H]. Right: age histogram. Each row shows results obtained with the projection of different parameters, as indicated in the top left corner of the histogram panels. |
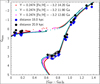 |
Fig. 6 Gaia colour-magnitude diagram of all the C-19 members studied spectroscopically. The absolute magnitudes are shown for two possible distances: 18 kpc (blue), and 20.9 kpc (black). The three non-member stars are highlighted in light grey (18 kpc) and grey (20.9 kpc). For comparison, three BASTI α-enhanced isochrones (Pietrinferni et al. 2021) of [Fe/H]= −3.2 of 14.20 Ga (red), 12.80 Ga (cyan), and 11.90 Ga (magenta) are shown. |
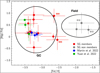 |
Fig. 7 [Fe/H]–[Mg/Fe] diagram for our programme stars and the stars from Martin et al. (2022) and Yuan et al. (2022) for which Mg abundances are available. |
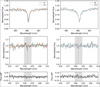 |
Fig. 8 Comparison of spectra for pairs of stars with similar atmospheric parameters (S1/S11 and S8/S14). The top panel displays a zoomed view around the strong Hβ line, revealing virtually identical profiles. The middle panel shows the spectra around the Mg Ib 518.3 nm line. The bottom panel shows the difference between the two spectra. Given the near-identical temperatures, gravities, and metallicities within each pair, the differences in the strengths of the Mg Ib 518.3 line are solely attributed to intrinsic variations in the Mg abundances. |
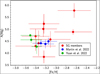 |
Fig. 9 [Fe/H]–A(Mg) diagram for our stars that are likely members of C-19 and the stars from Martin et al. (2022) and Yuan et al. (2022) for which Mg abundances are available. |
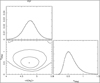 |
Fig. 10 Probability distribution function for the nine stars identified as C-19 members and a measured Mg abundance, excluding S06, whose membership is questionable. |
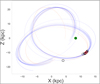 |
Fig. 11 Orbits of the C-19 in Yuan et al. (2022) (black circles and blue orbits) and stars S12 and S13 (orange) in galactocentric coordinates (the Sun is shown by the green circle). |
Acknowledgements
We are grateful to M. Bellazzini for his careful reading and critical assessment of our manuscript. P.B. is supported by the European Research Council through grant 835087 (SPIAKID). We gratefully acknowledge support from the French National Research Agency (ANR) funded project “Pristine” (ANR-18-CE31-0017). J.I.G.H. acknowledges financial support from the Spanish Ministry of Science, Innovation and Universities (MICIU) project PID2020-117493GB-I00. G.T. acknowledges support from the Agencia Estatal de Investigación del Ministerio de Ciencia en Innovación (AEI-MICIN) and the European Regional Development Fund (ERDF) under grant number PID2020-118778GB-I00/10.13039/501100011033 and the AEI under grant number CEX2019-000920-S. G.K. and F.G. gratefully acknowledge support from the French National Research Agency (ANR) funded project “MWDisc” (ANR-20- CE31-0004). E.S. acknowledges funding through VIDI grant “Pushing Galactic Archaeology to its limits” (with project number VI.Vidi.193.093) which is funded by the Dutch Research Council (NWO). This research has been partially funded from a Spinoza award by NWO (SPI 78-411). This research was supported by the International Space Science Institute (ISSI) in Bern, through ISSI International Team project 540 (The Early Milky Way). R.E. acknowledges support from the National Science Foundation (NSF) grants AST-2206046 and AST-1909584. This work has made use of data from the European Space Agency (ESA) mission Gaia (https://www.cosmos.esa.int/gaia), processed by the Gaia Data Processing and Analysis Consortium (DPAC, https://www.cosmos.esa.int/web/gaia/dpac/consortium). Funding for the DPAC has been provided by national institutions, in particular the institutions participating in the Gaia Multilateral Agreement. This research has made use of the SIMBAD database, operated at CDS, Strasbourg, France.
Appendix A Tables
This appendix contains the tables with all the data cited in the paper.
Identification and photometry of our program stars.
Stellar parameters for our program stars.
Magnesium and calcium abundance for our program stars.
Age determinations (in Ga) via isochrone projection of different parameters and their uncertainties.
References
- Alvarez, R., & Plez, B. 1998, A&A, 330, 1109 [NASA ADS] [Google Scholar]
- Balbinot, E., Dodd, E., Matsuno, T., et al. 2024, A&A, 687, L3 [NASA ADS] [CrossRef] [EDP Sciences] [Google Scholar]
- Beasley, M. A., Leaman, R., Gallart, C., et al. 2019, MNRAS, 487, 1986 [Google Scholar]
- Bertaux, J. L., Lallement, R., Ferron, S., Boonne, C., & Bodichon, R. 2014, A&A, 564, A46 [NASA ADS] [CrossRef] [EDP Sciences] [Google Scholar]
- Bonifacio, P., Zaggia, S., Sbordone, L., et al. 2006, in Chemical Abundances and Mixing in Stars in the Milky Way and its Satellites (Berlin: Springer), 232 [Google Scholar]
- Ceccarelli, E., Massari, D., Mucciarelli, A., et al. 2024, A&A, 684, A37 [NASA ADS] [CrossRef] [EDP Sciences] [Google Scholar]
- Dodd, E., Callingham, T. M., Helmi, A., et al. 2023, A&A, 670, L2 [NASA ADS] [CrossRef] [EDP Sciences] [Google Scholar]
- Errani, R., Navarro, J. F., Ibata, R., et al. 2022, MNRAS, 514, 3532 [NASA ADS] [CrossRef] [Google Scholar]
- François, P., Caffau, E., Bonifacio, P., et al. 2018, A&A, 620, A187 [NASA ADS] [CrossRef] [EDP Sciences] [Google Scholar]
- Goldoni, P., Royer, F., François, P., et al. 2006, SPIE Conf. Ser., 6269, 62692K [Google Scholar]
- Gratton, R. G., Bonifacio, P., Bragaglia, A., et al. 2001, A&A, 369, 87 [NASA ADS] [CrossRef] [EDP Sciences] [Google Scholar]
- Hansen, C. J., El-Souri, M., Monaco, L., et al. 2018, ApJ, 855, 83 [NASA ADS] [CrossRef] [Google Scholar]
- Harris, W. E. 1996, AJ, 112, 1487 [Google Scholar]
- Hastings, W. K. 1970, Biometrika, 57, 97 [Google Scholar]
- Heiter, U., Lind, K., Bergemann, M., et al. 2021, A&A, 645, A106 [EDP Sciences] [Google Scholar]
- Helmi, A., & White, S. D. M. 1999, MNRAS, 307, 495 [CrossRef] [Google Scholar]
- Ibata, R. A., Gilmore, G., & Irwin, M. J. 1994, Nature, 370, 194 [Google Scholar]
- Ibata, R., Malhan, K., Martin, N., et al. 2021, ApJ, 914, 123 [NASA ADS] [CrossRef] [Google Scholar]
- Kordopatis, G., Schultheis, M., McMillan, P. J., et al. 2023, A&A, 669, A104 [NASA ADS] [CrossRef] [EDP Sciences] [Google Scholar]
- Kruijssen, J. M. D., Pfeffer, J. L., Reina-Campos, M., Crain, R. A., & Bastian, N. 2019, MNRAS, 486, 3180 [Google Scholar]
- Kurucz, R. L. 2005, Memorie della Societá Astronomica Italiana Supplementi, 8, 14 [Google Scholar]
- Larsen, S. S., Strader, J., & Brodie, J. P. 2012, A&A, 544, L14 [NASA ADS] [CrossRef] [EDP Sciences] [Google Scholar]
- Lombardo, L., François, P., Bonifacio, P., et al. 2021, A&A, 656, A155 [NASA ADS] [CrossRef] [EDP Sciences] [Google Scholar]
- Madau, P., Lupi, A., Diemand, J., Burkert, A., & Lin, D. N. C. 2020, ApJ, 890, 18 [NASA ADS] [CrossRef] [Google Scholar]
- Malhan, K., Yuan, Z., Ibata, R. A., et al. 2021, ApJ, 920, 51 [NASA ADS] [CrossRef] [Google Scholar]
- Malhan, K., Ibata, R. A., Sharma, S., et al. 2022, ApJ, 926, 107 [NASA ADS] [CrossRef] [Google Scholar]
- Mandushev, G., Staneva, A., & Spasova, N. 1991, A&A, 252, 94 [NASA ADS] [Google Scholar]
- Martin, N. F., Venn, K. A., Aguado, D. S., et al. 2022, Nature, 601, 45 [NASA ADS] [CrossRef] [Google Scholar]
- Matteucci, F. 2021, A&A Rev., 29, 5 [NASA ADS] [CrossRef] [Google Scholar]
- McConnachie, A. W., & Venn, K. A. 2020, AJ, 160, 124 [Google Scholar]
- Metropolis, N., Rosenbluth, A. W., Rosenbluth, M. N., Teller, A. H., & Teller, E. 1953, J. Chem. Phys., 21, 1087 [Google Scholar]
- Minelli, A., Bellazzini, M., Mucciarelli, A., et al. 2023, A&A, 669, A54 [NASA ADS] [CrossRef] [EDP Sciences] [Google Scholar]
- Mucciarelli, A., Bellazzini, M., Ibata, R., et al. 2017, A&A, 605, A46 [NASA ADS] [CrossRef] [EDP Sciences] [Google Scholar]
- Mucciarelli, A., Bellazzini, M., & Massari, D. 2021, A&A, 653, A90 [NASA ADS] [CrossRef] [EDP Sciences] [Google Scholar]
- Naidu, R. P., Conroy, C., Bonaca, A., et al. 2020, ApJ, 901, 48 [Google Scholar]
- Pancino, E., Romano, D., Tang, B., et al. 2017, A&A, 601, A112 [NASA ADS] [CrossRef] [EDP Sciences] [Google Scholar]
- Paradiso, S., Colombo, L. P. L., Andersen, K. J., et al. 2023, A&A, 675, A12 [NASA ADS] [CrossRef] [EDP Sciences] [Google Scholar]
- Pietrinferni, A., Hidalgo, S., Cassisi, S., et al. 2021, ApJ, 908, 102 [NASA ADS] [CrossRef] [Google Scholar]
- Planck Collaboration I. 2016, A&A, 594, A1 [NASA ADS] [CrossRef] [EDP Sciences] [Google Scholar]
- Plez, B. 2012, Astrophysics Source Code Library [record ascl:1205.004] [Google Scholar]
- Sbordone, L., Caffau, E., Bonifacio, P., & Duffau, S. 2014, A&A, 564, A109 [NASA ADS] [CrossRef] [EDP Sciences] [Google Scholar]
- Schlafly, E. F., & Finkbeiner, D. P. 2011, ApJ, 737, 103 [Google Scholar]
- Sestito, F., Vitali, S., Jofre, P., et al. 2024, A&A, 689, A201 [NASA ADS] [CrossRef] [EDP Sciences] [Google Scholar]
- Simon, J. D. 2019, ARA&A, 57, 375 [NASA ADS] [CrossRef] [Google Scholar]
- Vargas, L. C., Geha, M., Kirby, E. N., & Simon, J. D. 2013, ApJ, 767, 134 [NASA ADS] [CrossRef] [Google Scholar]
- Vernet, J., Dekker, H., D’Odorico, S., et al. 2011, A&A, 536, A105 [NASA ADS] [CrossRef] [EDP Sciences] [Google Scholar]
- Viswanathan, A., Yuan, Z., Ardern-Arentsen, A., et al. 2025, A&A, 695, A112 [NASA ADS] [CrossRef] [EDP Sciences] [Google Scholar]
- Wilson, A. G. 1955, PASP, 67, 27 [NASA ADS] [CrossRef] [Google Scholar]
- Yuan, Z., Chang, J., Beers, T. C., & Huang, Y. 2020, ApJ, 898, L37 [Google Scholar]
- Yuan, Z., Martin, N. F., Ibata, R. A., et al. 2022, MNRAS, 514, 1664 [CrossRef] [Google Scholar]
All Tables
Age determinations (in Ga) via isochrone projection of different parameters and their uncertainties.
All Figures
|
Fig. 1 X-shooter spectra of the targets in several spectral regions of the UBV and VIS arms. |
| In the text | |
|
Fig. 2 Radial velocities of our program stars and the stars from Martin et al. (2022) and Yuan et al. (2022) plotted as a function of declination. The dashed lines indicate three σ shifts from the mean value (represented by the thick line). |
| In the text | |
|
Fig. 3 Probability distribution functions for the five parameters of the inference on the properties of the combined velocity and metallicity distribution of C-19 members. The five parameters are the fraction of contaminants, η, and the mean and dispersion of the velocity (⟨vr⟩ and sigmavr) and metallicity (⟨[Fe/H]⟩ and σ[Fe/H]) parts of the model. The top panel of each column shows the one-dimensional marginalised probability distribution functions from which the favoured parameter models and related uncertainties are determined. The red contours and histograms show the same after the three likely contaminant stars are removed and the MW contamination is fixed to η = 0. |
| In the text | |
|
Fig. 4 [Fe/H] vs. radial velocity for all the observed stars. The likely member stars are shown in red, and the three likely contaminants are shown in grey. |
| In the text | |
|
Fig. 5 Radial velocities as a function of metalicity and age and age histogram. Left: radial velocity vs. [Fe/H] colour-coded by age. Middle: radial velocity vs. age colour-coded by [Fe/H]. Right: age histogram. Each row shows results obtained with the projection of different parameters, as indicated in the top left corner of the histogram panels. |
| In the text | |
|
Fig. 6 Gaia colour-magnitude diagram of all the C-19 members studied spectroscopically. The absolute magnitudes are shown for two possible distances: 18 kpc (blue), and 20.9 kpc (black). The three non-member stars are highlighted in light grey (18 kpc) and grey (20.9 kpc). For comparison, three BASTI α-enhanced isochrones (Pietrinferni et al. 2021) of [Fe/H]= −3.2 of 14.20 Ga (red), 12.80 Ga (cyan), and 11.90 Ga (magenta) are shown. |
| In the text | |
|
Fig. 7 [Fe/H]–[Mg/Fe] diagram for our programme stars and the stars from Martin et al. (2022) and Yuan et al. (2022) for which Mg abundances are available. |
| In the text | |
|
Fig. 8 Comparison of spectra for pairs of stars with similar atmospheric parameters (S1/S11 and S8/S14). The top panel displays a zoomed view around the strong Hβ line, revealing virtually identical profiles. The middle panel shows the spectra around the Mg Ib 518.3 nm line. The bottom panel shows the difference between the two spectra. Given the near-identical temperatures, gravities, and metallicities within each pair, the differences in the strengths of the Mg Ib 518.3 line are solely attributed to intrinsic variations in the Mg abundances. |
| In the text | |
|
Fig. 9 [Fe/H]–A(Mg) diagram for our stars that are likely members of C-19 and the stars from Martin et al. (2022) and Yuan et al. (2022) for which Mg abundances are available. |
| In the text | |
|
Fig. 10 Probability distribution function for the nine stars identified as C-19 members and a measured Mg abundance, excluding S06, whose membership is questionable. |
| In the text | |
|
Fig. 11 Orbits of the C-19 in Yuan et al. (2022) (black circles and blue orbits) and stars S12 and S13 (orange) in galactocentric coordinates (the Sun is shown by the green circle). |
| In the text | |
Current usage metrics show cumulative count of Article Views (full-text article views including HTML views, PDF and ePub downloads, according to the available data) and Abstracts Views on Vision4Press platform.
Data correspond to usage on the plateform after 2015. The current usage metrics is available 48-96 hours after online publication and is updated daily on week days.
Initial download of the metrics may take a while.