Fig. 8
Download original image
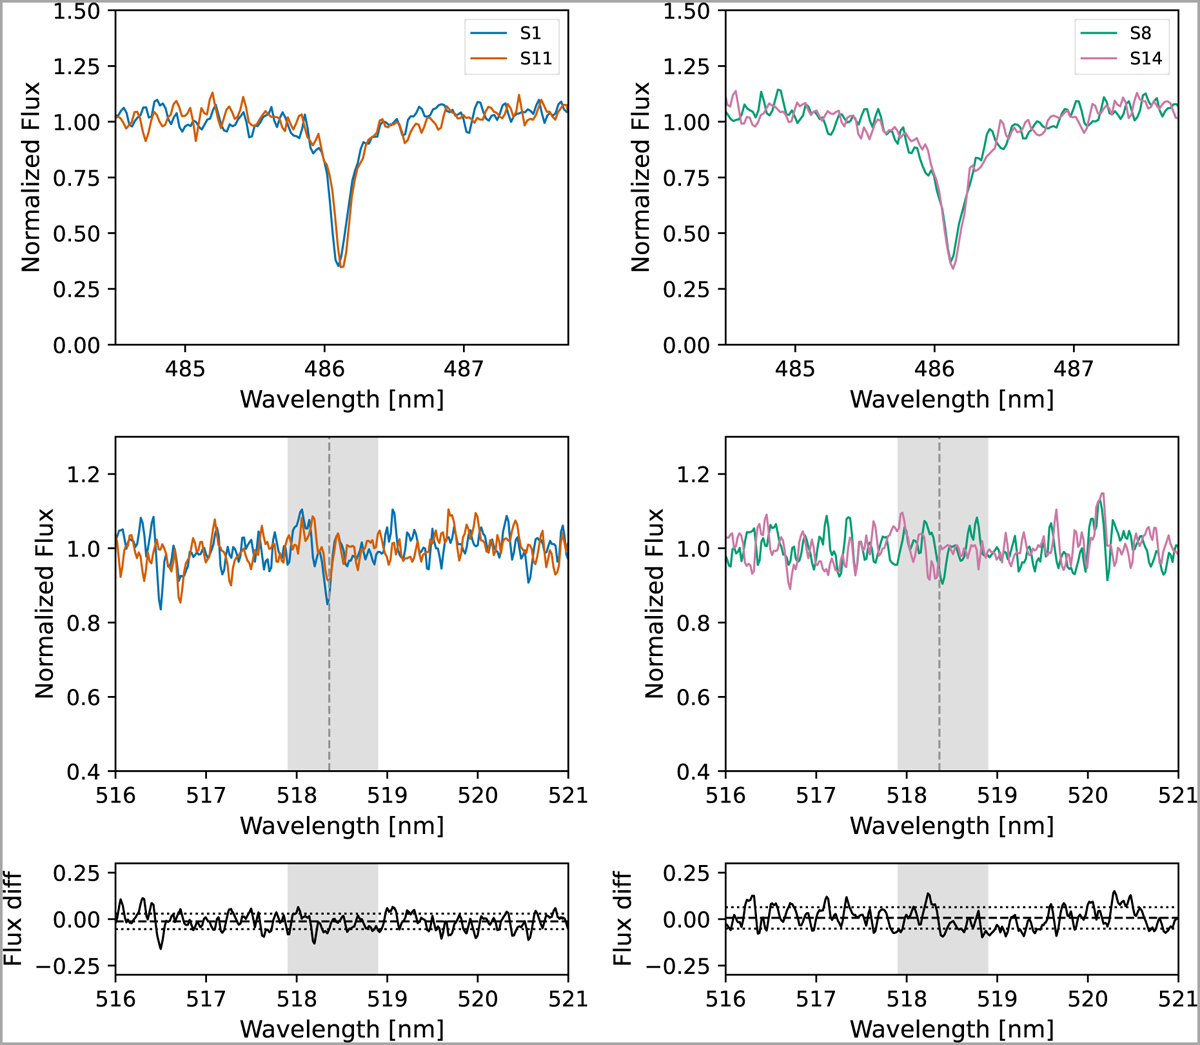
Comparison of spectra for pairs of stars with similar atmospheric parameters (S1/S11 and S8/S14). The top panel displays a zoomed view around the strong Hβ line, revealing virtually identical profiles. The middle panel shows the spectra around the Mg Ib 518.3 nm line. The bottom panel shows the difference between the two spectra. Given the near-identical temperatures, gravities, and metallicities within each pair, the differences in the strengths of the Mg Ib 518.3 line are solely attributed to intrinsic variations in the Mg abundances.
Current usage metrics show cumulative count of Article Views (full-text article views including HTML views, PDF and ePub downloads, according to the available data) and Abstracts Views on Vision4Press platform.
Data correspond to usage on the plateform after 2015. The current usage metrics is available 48-96 hours after online publication and is updated daily on week days.
Initial download of the metrics may take a while.