| Issue |
A&A
Volume 678, October 2023
|
|
|---|---|---|
| Article Number | A115 | |
| Number of page(s) | 9 | |
| Section | Galactic structure, stellar clusters and populations | |
| DOI | https://doi.org/10.1051/0004-6361/202347076 | |
| Published online | 12 October 2023 | |
ED-2: A cold but not so narrow stellar stream crossing the solar neighbourhood⋆
1
Kapteyn Astronomical Institute, University of Groningen, Landleven 12, 9747 AD Groningen, The Netherlands
2
Leiden Observatory, Leiden University, Niels Bohrweg 2, 2333 CA Leiden, The Netherlands
e-mail: eduardo.balbinot@gmail.com
3
Universidad de Granada, Departamento de Física Teórica y del Cosmos, Campus Fuente Nueva, Edificio Mecenas, 18071 Granada, Spain
Received:
2
June
2023
Accepted:
2
August
2023
Context. ED-2 is a stellar stream identified as a compact group in integrals-of-motion space in a local sample of halo stars from the third Gaia data release.
Aims. We investigate its nature and possible association with known halo substructures.
Methods. We explored the current properties of ED-2 members in phase-space and also analysed the expected distribution via orbit integration. In addition, we studied the metallicity of ED-2 using APOGEE DR17 and LAMOST DR8 (and re-calibrated DR3).
Results. ED-2 forms a compact group in the x − z (or R − z) plane, showing a pancake-like structure as it crosses the solar neighbourhood. Dynamically, it is most similar to the globular clusters NGC 3201 and NGC 6101 and to the stellar streams Ylgr and Phlegethon. However, its orbit is sufficiently different for none of these objects to likely be the ED-2 progenitor. We also find ED-2 to be quite metal poor: all of its stars have [Fe/H]≤ − 2.42, with a median [Fe/H] = −2.60−0.21+0.20. At this low metallicity, it is unlikely that ED-2 stems from any known globular cluster. Instead, ED-2 seems to be in a similar category as the recently discovered Phoenix and C-19 stellar streams. We find that ED-2 members are scattered across the whole sky, which is due to its current orbital phase. We predict that as this object moves to its next apocentre, it will acquire an on-sky morphology that is similar to that of cold stellar streams. Finally, because ED-2 is nearing pericentre, we predict that additional members found below the plane will have high radial velocities of close to ∼500 km s−1 in the present-day direction of the globular cluster NGC 6101.
Key words: Galaxy: halo / Galaxy: kinematics and dynamics
Movie associated to Fig. 6 is available at https://www.aanda.org.
© The Authors 2023
 Open Access article, published by EDP Sciences, under the terms of the Creative Commons Attribution License (https://creativecommons.org/licenses/by/4.0), which permits unrestricted use, distribution, and reproduction in any medium, provided the original work is properly cited.
This article is published in open access under the Subscribe to Open model. Subscribe to A&A to support open access publication.
1. Introduction
Stellar streams can be defined as groups of stars that were stripped from a parent galaxy or stellar system (e.g., a globular cluster) by their host galaxy. These objects are of interest because they provide insights into the evolution and dynamics of galaxies such as the Milky Way (e.g., Küpper et al. 2015; Koposov et al. 2010). In the past, cold stellar streams have typically been identified through their spatial coherence on the sky (e.g., Ibata et al. 1994; Grillmair & Dionatos 2006; Balbinot et al. 2016), where they form thin bands stars due to their nearly identical orbits.
Until recently, many of the streams were identified in large photometric surveys, such as the Sloan Digital Sky Survey (SDSS; Abbott et al. 2019). The largest of these streams is the Sagittarius stream (Ibata et al. 1994). The search for stellar streams has continued in the last decades, and fainter (e.g., Palomar 5; Odenkirchen et al. 2001) and more distant (e.g., Orphan; Belokurov et al. 2007) streams were found using the increasingly more abundant photometric survey data.
The advent of the Gaia mission has allowed the discovery of new streams through the use of kinematic data. For example, the identification of several large substructures associated with different accretion events was possible through their distinct energy and angular momentum distributions (for a recent review, see Helmi 2020). These structures often do not show the same degree of spatial cohesion as their more distant counterparts. Nonetheless, using the most recent data release of Gaia (DR3; Gaia Collaboration 2021b), lower overdensities have now been identified (Dodd et al. 2023; Tenachi et al. 2022), presumably stemming from objects comparable to the progenitors of the more distant spatially coherent streams (Tenachi et al. 2022). Furthermore, algorithms such as STREAMFINDER have been successful at identifying nearby narrower streams, which is a direct consequence of one of the hypotheses of the algorithm (Malhan & Ibata 2018; Ibata et al. 2021).
We focus on a structure called ED-2, which is quite compact in the integrals-of-motion space (i.e., energy and angular momenta; IoM hereafter) and was identified by Dodd et al. (2023) using Gaia DR3 and a combination of ground-based surveys. ED-2 forms a retrograde group, and it occupies a region in IoM that has been associated with the Sequoia accretion event in the literature (Koppelman et al. 2019; Myeong et al. 2019). A small fraction of its members has been identified by Yuan et al. (2020) as members of the Sequoia accretion event. However, Dodd et al. (2023) reported ED-2 as an independent group that is compact in velocity as well, more specifically, in vϕ and vz. This is indicative that this structure is not phase mixed in the solar neighbourhood.
In this paper, we aim to investigate the origins of ED-2 and study its metallicity distribution, and we search for additional members of this stream. The paper is organized as follows. In Sect. 2 we present the discovery data for ED-2 and investigate possible associations with known globular clusters (GCs) and other stellar streams. In Sect. 3 we present an approach to selecting ED-2 members via photometric selections in combination with Gaia DR3 astrometry. In Sect. 4 we discuss possible formation scenarios for ED-2 and present our general results.
2. ED-2 in 6D
ED-2 was identified in Dodd et al. (2023) as a highly retrograde structure with a tight distribution in energy and angular momenta. The authors reported 32 members with radial velocities within their 2.5 kpc sample. They also find that ED-2 forms a compact cluster in all velocity components, suggesting that this structure is not phase mixed and that its stars stream together through the solar neighbourhood.
We expanded the initial membership of 32 stars to 48 by examining the dendrogram of the ED-2 cluster produced by the first step of the single-linkage-based method used in Dodd et al. (2023). By relaxing the selection threshold on the dendrogram, it is possible include more stars in the cluster. As ED-2 is also tightly grouped in velocity space, we removed several stars with incompatible velocities, and any additional members are very likely to be part of the structure. This produced a list of 48 high-confidence members.
Yuan et al. (2020) have found a cluster similar to ED-2 in the very metal-poor sample (VMP) of Li et al. (2018a), consisting of nine stars, four of which are in common with the sample from Dodd et al. (2023). Yuan et al. (2020) considered the cluster (named DTG-5 in their work) to be associated with Sequoia (Koppelman et al. 2019; Myeong et al. 2019). Based on the high-degree of similarity to ED-2, and because it is now clear that the latter is independent of Sequoia, we refer to both simply as ED-2 throughout.
In Fig. 1 we show the members of ED-2 in a colour–magnitude diagram using Gaia DR31. The distances to ED-2 members were computed by inverting the parallax after applying the zero-point correction by Lindegren et al. (2021). We note that this distance-estimate method is reliable for distances ≲5 kpc and for parallax uncertainties smaller than 20%, as is the case for ED-2 members. The figure shows that ED-2 members form a very well defined sequence in the colour–magnitude diagram, and it is consistent with a single stellar population with a metallicity of [Fe/H]= − 2.0. This estimate is based on the slope of the red giant branch (RGB) when it is visually compared to a MIST v1.2 isochrone (Choi et al. 2016). The age of ED-2 is not well constrained because the main-sequence turn-off (MSTO) is not well populated, but we find that to simultaneously reproduce the colour of the RGB and main sequence, a log10(age/yr) = 10.20 is necessary. In the same figure, we also show a MIST isochrone shifted by 0.05 to the blue and 0.03 to the red to define a photometric selection of additional tentative members (dashed lines).
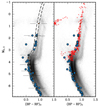 |
Fig. 1. Gaia DR3 CMDs showing ED-2 6D members as blue circles. In the left panel, the dashed lines were constructed using a log10(age/yr) = 10.20 and [Fe/H]= − 2.0 MIST v1.2 isochrone. In the right panel, we show bright, uncrowded, high-probability (> 0.99) members of NGC 6101 (Vasiliev & Baumgardt 2021) with red pluses (see Sect. 2.2). In both panels, the background shows a linear scale density of halo stars selected according to Eq. (1). The orange dots show the VMP cluster from Yuan et al. (2020). In the left panel, symbols marked by the horizontal lines indicate stars that have spectroscopic metallicities (see Fig. 3). |
In Fig. 1 we also show a sample of stars with ϖ/σϖ > 5 and 1/ϖ < 3 kpc, with high tangential velocities, where
where μα*, δ are the proper motion components, k is a conversion factor, and ϖ is the parallax. This preferentially selects stars on halo-like orbits (see e.g., Gaia Collaboration 2021a). We note that ED-2 members, and as a consequence, the two isochrones we used to identify additional members, are bluer than the blue sequence first reported by Gaia Collaboration (2018, see also Koppelman et al. 2019; Gaia Collaboration 2021a), and they are typically associated with the accreted halo component. This is in favour of ED-2 being more metal poor than the accreted halo. Most ED-2 members that do not fall within our CMD selection are located in regions of the sky with E(B − V)⪆0.15 and/or |b|< 20°. Hence, these are unlikely to have reliable colours and magnitudes, regardless of the extinction-correction prescription adopted. In our case, they were over-corrected for extinction2. In the same figure, we also show (with pluses) a selection of stars from the globular cluster NGC 6101, which is discussed in more detail in Sect. 2.2.
In Fig. 2 we show the 3D spatial distribution of ED-2 members before and after the colour-magnitude selection described above. Additionally, we highlight the members from the VMP cluster found by Yuan et al. (2020). We note that three of the VMP members disagree with the bulk of ED-2 members and have negative values of vx and lower values of vz. We mark them as outliers. We find that in the x − z plane, ED-2 forms a tight sequence. We estimated the stream width by running a principal component analysis (PCA) decomposition in 3D position space. When computing the standard deviation in each principal axis, we find that ED-2 is distributed in a slightly oval pancake shape, with dispersions of 750 pc, 650 pc, and 130 pc. We note that when we propagated the uncertainty in distance, we found that the typical position uncertainty is smaller than 25 pc. This suggests that ED-2 forms a pancake-like structure that extends very little spatially (dispersion of 130 pc), approximately along the y-axis. We also show in Fig. 2 a small portion of the orbits of ED-2 members, which also reveal preferential alignment in the x − z plane, with a higher density of overlapping orbits at negative z. The orbits were integrated in the MWPOTENTIAL potential from GALA (Price-Whelan 2017) for 20 Myr. We note that the orbit followed by ED-2 members is not exactly aligned with the stream itself. It resembles an elongated co-moving group of stars more than a typical stellar stream. This type of morphology-orbit misalignment has been observed for cold streams that have been perturbed by large satellites (Shipp et al. 2021), but a misalignment like this can also arise when a stream approaches a sharp turning point in its orbit. This seems to be the case for ED-2 because it is close to pericentre (at ∼6 kpc) and its velocity vector is aligned with the predicted orbit integrated in the MWPOTENTIAL. We find no different orbit or morphology between the CMD selected sample and the original one from Dodd et al. (2023), except that stars near the plane tend to fall outside our CMD selection. This can be explained by improper extinction correction, as explained earlier. Finally, we observe a very clear trend in the y − vx plane, where ED-2 forms a very tight sequence in velocity. We performed a PCA analysis in velocity space to determine its dispersion. We find that the lowest velocity dispersion has an amplitude of ∼7.4 km s−1. Because the typical velocity uncertainty is ∼5 km s−1 amongst ED-2 members and the PCA decomposition does not take any velocity gradients that might be present into account, the true velocity dispersion of ED-2 is likely lower than our estimate.
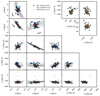 |
Fig. 2. Cartesian heliocentric positions and velocities for ED-2 members. The grey symbols mark members that fall outside our narrow photometric selection (see Fig. 1). The red dots show the VMP cluster from Yuan et al. (2020). The lines show a small portion of the orbits of ED-2 members, integrated in a MWPOTENTIAL potential for 20 Myr. The blue arrow indicates the approximate direction in which the stars move. ED-2 form a tight sequence in the x − z and vx − y panels. We find that three objects of Yuan et al. (2020) are outliers in vx (outside the plot range) and vz, which are unlikely to belong to ED-2. In the three top left panels, the arrows indicate the mean projected velocity vector. The three top right panels show the original Dodd et al. (2023) membership (orange) and the expanded membership we adopted in this work (blue). We only show these two samples in the velocity sub-space because this was the sub-space we used to find new members of ED-2 (see Sect. 2). |
2.1. Metallicity
Some of the ED-2 members are bright enough to have metallicities measured by ground-based surveys. We find that 22 of these have metallicities, with 21 in LAMOST DR8 low- and medium-resolution spectra (LRS and MRS) and one in APOGEE DR17. In Table 1 we show the summary of the parameters for these targets. We also list the mean signal-to-noise ratio (S/N) of the spectra. For the case of LAMOST LRS, the S/N was computed in the u, g, r, i, z bands, and the value in the table is the highest S/N in any of the bands. The LAMOST DR8 metallicities are shown in parentheses. In the same table, we also indicate the stars that fall within our CMD selection from Fig. 1 and those that are velocity outliers (see Fig. 2).
Summary of the ED-2 members with spectroscopic metallicities.
Additionally, we also took the metallicities from Li et al. (2018b), who reanalysed LAMOST DR3 LRS spectra to derive more accurate metallicities for low-metallicity stars. We find that all but one ED-2 member have metallicities in this catalogue. We chose to use the Li et al. (2018b) metallicities when available, as shown in Table 1. We note that these rederived metallicites were shown by Li et al. (2022) to be reliable when compared to higher-resolution spectra. However, the authors found that the typical LAMOST uncertainty were severely underestimated and indicated that an uncertainty of 0.26 dex is more realistic.
In Fig. 3 we show the [Fe/H] distribution as a function of magnitude using the rederived metallicities from Li et al. (2018b), except for one star that is not in that catalogue. In the bottom panel, we show a kernel density estimate (KDE), built by stacking the individual distributions (assumed to be normally distributed), after removing velocity outliers (see Fig. 2). The dispersion of each individual measurement was computed using a fixed value of 0.26 dex (see the discussion above), with the exception of the single APOGEE stars, for which we used the quoted uncertainty. Finally, we show the metallicity from Gaia DR3 XP spectra derived via label transfer by Andrae et al. (2023; labelled XGBoost). These metallicities are less reliable, although for bright (sub-)giants stars, they seem to agree quite well with the metallicity distributions derived from the spectra. For this latter sample, we assumed a metallicity uncertainty of 0.35 dex. We also adopted a G < 16 and MG < 5 quality cut, which removed low-S/N stars and low-mass main-sequence stars, which have less reliable spectrophotometric metallicities.
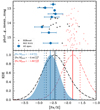 |
Fig. 3. Metallicity distribution for ED-2. Top panel: [Fe/H] distribution as a function of observed G-band magnitude for the spectroscopic members listed in Table 1 using the Li et al. (2018b) catalogue based on LAMOST and APOGEE data where available. We also show the spectro-photometric metallicities from Andrae et al. (2023) after the quality cuts described in Sect. 2.1. We show the same for members of NGC 6101. Bottom panel: KDE of the [Fe/H] distribution from spectroscopy and Andrae et al. (2023). The median (solid) and 25th and 75th percentiles (dashed) are shown as vertical lines, matching the colour scheme of the two samples in the top panel. We note the good agreement between the spectroscopic and spectrophotometric metallicities for ED-2 members. |
The resulting KDE shows a clear peak, with a median at ![$ [\text{ Fe} / \text{ H}] = -2.60^{+0.20}_{-0.21} $](/articles/aa/full_html/2023/10/aa47076-23/aa47076-23-eq3.gif) , where the uncertainty is assumed to be the dispersion around the median computed at the 25 and 75 percentiles of the cumulative KDE. We find no difference in the median metallicity when considering only stars that fall within the CMD selection shown in Fig. 1. We also find that the Andrae et al. (2023) metallicities agree well with the spectroscopic ones, with a median
, where the uncertainty is assumed to be the dispersion around the median computed at the 25 and 75 percentiles of the cumulative KDE. We find no difference in the median metallicity when considering only stars that fall within the CMD selection shown in Fig. 1. We also find that the Andrae et al. (2023) metallicities agree well with the spectroscopic ones, with a median ![$ [\text{ Fe} / \text{ H}] = -2.44^{+0.32}_{-0.30} $](/articles/aa/full_html/2023/10/aa47076-23/aa47076-23-eq4.gif) .
.
We note that all the spectroscopic members of ED-2 that have high or medium spectra and/or have rederived metallicities by Li et al. (2018b), have [Fe/H]< − 2.42. This is consistent with our finding based on the CMD distribution, where ED-2 members are found to be bluer than the blue sequence of the halo, which peaks at a metallicity of [Fe/H]∼ − 1.2 (Conroy et al. 2019). The median metallicity of ED-2 is below the metallicity floor of MW GCs (Harris 1996; Marín-Franch et al. 2009) and the upper limit of its metallicity only overlaps with a few GCs, such as Messier 92, NGC 2298, NGC 2419, NGC 4372, NGC 5053, and NGC 6101 (Harris 1996, 2010 revision).
2.2. Association with known structures
2.2.1. Globular clusters
We investigated possible associations of ED-2 with other known structures in the Galaxy. First, we sampled 1000 initial conditions for each of the 159 globular clusters (GCs hereafter) in the Baumgardt & Hilker (2018, 2022 revision) and integrated their orbits for 3 Gyr forward and backward in the MWPOTENTIAL using GALA (Price-Whelan 2017).
Because of the low degree of phase mixing seen in ED-2, if it is the stellar stream from a disrupting GC, we expect the progenitor GC to cross the solar neighbourhood at some point in its orbit. From the simulated GC orbits described above, we therefore selected only those that approach the Sun closer than 5 kpc. We further narrowed down the list of possible progenitors by selecting those that are nearest to ED-2 in IoM space. The top panel in Fig. 4 shows the z-component of the angular momentum (Lz) vs. total energy (Etot; computed using the same potential as for the GC orbits) for the GCs in our sample whose orbits cross the solar neighbourhood. We note that the high-energy retrograde region of this diagram is typically devoid of GCs, with the exception of NGC 6101, and NGC 3201. The latter has a somewhat large Etot uncertainty. We also show the distribution of  , which is a quantity that is conserved approximately, in the bottom panel of the same figure. For NGC 3201 and NGC 6101, we show a violin plot in which the width is proportional to the amount of time for which each cluster orbit has a given value of L⊥. These values were sampled from the orbit simulations described previously in this section. For ED-2 stars, we show the same, but we did not sample from the uncertainties of each star, but took the distribution of all ED-2 orbits. From this, we conclude that ED-2 does not overlap with any known GC in this space.
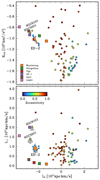 |
Fig. 4. ED-2 in IoM space. Top: Lz vs. Etot showing GCs (circles) coloured by their orbital eccentricity. ED-2 is shown as dark blue circles, while the squares show known retrograde streams (see the legend; Bonaca et al. 2021). Bottom: same as above, but for Lz vs. L⊥. Additionally, we show the distribution of L⊥ as a violin plot (shaded regions), estimated from the orbits of NGC 3201, NGC 6101, and ED-2. As a comparison, we also show the original ED-2 members identified by Dodd et al. (2023; orange circles) overlaid on our extended sample (see Sect. 2 and Fig. 2). |
In addition to the orbital mismatch, NGC 3201 ([Fe/H]= − 1.59) and NGC 6101 ([Fe/H]= − 1.98; Harris 1996) are both more metal rich than ED-2. Although NGC 3201 shows the highest degree of kinematic association with ED-2, we conclude from its metallicity that it is unlikely to be the progenitor of ED-2. This cluster has also been associated with the Gjoll stream (Hansen et al. 2020). In the case of NGC 6101, the metallicity is marginally consistent with ED-2, although it has been poorly studied thus far. Dalessandro et al. (2015) reported a [Fe/H]= − 2.25 based on isochrone fitting, while spectroscopic estimates indicate a value of −1.98 (Zinn & West 1984; Carretta et al. 2009). Geisler et al. (1995) used CaT lines and reported a value of [Fe/H]= − 1.863. Cohen et al. (2011) reported that the RR Lyrae period distribution and morphology of the horizontal branch (HB) are consistent with the spectroscopic metallicity estimate.
We further investigated this preliminary assessment by creating a sample of high membership probability NGC 6101 stars. We adopted the method of Vasiliev & Baumgardt (2021)4 and defined the sample with a membership probability higher than 0.99 and that are more than 3.6′ from the cluster centre (to avoid crowding issues in the Gaia XP spectra). In Fig. 1 we show the distribution of these stars in colour–magnitude diagram with pluses. We adopted the distance modulus and extinction value from Dalessandro et al. (2015). At a first glance, it would seem that ED-2 agrees well with the stellar population of NGC 6101, although the ED2 RGB stars appear to be slightly bluer. To confirm this, in Fig. 3 we show the Andrae et al. (2023) metallicity for NGC 6101 members (in red) for observed G-band magnitudes brighter than 16. All of these stars are RGB stars at the distance of NGC 6101. We note that the median metallicity of this sample is  , and it is significantly offset from both the median spectroscopic and the metallicity for ED-2 derived in Sect. 2.1 using the estimates of Andrae et al. (2023).
Although Fig. 5 suggests that the expected orbit of ED-2 crosses the present-day position of NGC 6101 quite well (in distance and on the sky), its radial velocity is offset by about 100 km s−1 (Harris 1996 reported 366 km s−1 for NGC 6101), and this mismatch is expected given their different IoM locations (see Fig. 4). Therefore, based on the dynamical and stellar population differences, we conclude that NGC 6101 is unlikely to be the progenitor of ED-2.
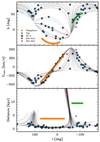 |
Fig. 5. Galactic b, heliocentric velocity (Vhelio), and distance as a function of galactic l from top to bottom. ED-2 members are shown in blue, and the grey lines show their predicted orbits. We show the Phlegethon and Ylgr streams (see legend) when data are available. The red (purple) star marks the location of NGC 6101 (NGC 3201). We note that NGC 6101 has an excellent match in distance, but only approximately aligns with the ED-2 orbit (integrated for 25 Myr and shown in grey) in the other two panels. |
2.2.2. Stellar streams
The census of stellar streams in the MW is rapidly growing (e.g., Shipp et al. 2018; Ibata et al. 2019), and currently, more than 100 streams have been claimed (see Mateu et al. 2018, for a recent compilation). Some of these streams may cross the solar neighbourhood and may give rise to IoM groups such as ED-2.
We took a set of retrograde streams from Bonaca et al. (2021). We note that not all these streams have spectroscopic measurements of their radial velocity. Some are predicted values based on the STREAMFINDER algorithm. Nonetheless, when we inspect their (sometimes tentative) location of the streams in IoM space, we find three possible associations with ED-2, namely Phlegethon (Ibata et al. 2018), Ylgr (Ibata et al. 2019), and GD-1 (Grillmair & Dionatos 2006), based on their energy and Lz. We note, however, that they appear to be offset in L⊥, as shown in Fig. 4.
GD-1 has been well studied, also spectroscopically, and its orbit is known to not cross the solar neighbourhood (Koposov et al. 2010), which is a reflection of its much larger L⊥ at its energy. Information on Phlegeton is more limited. Martin et al. (2022) reported a metallicity of −1.98 ± 0.05 using narrow-band photometry in the CaHK band, and Ibata et al. (2018) predicted the stream orbit based on two SEGUE DR10 (Yanny et al. 2009) member stars. Figure 5 shows that the track of Phlegethon is slightly offset from that of the ED-2 stars orbits and is located at a larger distance (3.8 kpc compared to ∼1 kpc at the same sky location). Similarly, although there is overlap between the track of the Ylgr stream with ED-2 stars, at its sky position, Ylgr is at a distance of 9.5 kpc (Riley & Strigari 2020), whereas ED-2 is well within 3 kpc. We note that Ylgr has no confirmed spectroscopic members, so the radial velocity is predicted, and hence, so is it location in IoM space.
Based on the mismatch between distance, velocity, position, and metallicity, we conclude that neither Phlegethon nor Ylgr (nor GD-1) are likely to be the progenitor of ED-2. It is nonetheless interesting that these retrograde structures are all abnormally metal poor. It is tempting to suggest that they may have been part of a larger group of objects born in a similar environment.
3. Orbit and predicted velocity
Unlike the more distant cold streams known thus far in the Galaxy, ED-2 is not a very narrow stream in comparison. This is partly due to its crossing of the solar volume. We can estimate its properties beyond the solar neighbourhood using the ensemble of orbits of its member stars. Because the ED-2 orbit is nearing pericentre, we expect that any additional members found at smaller galactocentric distances will have very high radial velocities. Additionally, as a stream approaches pericentre, it reaches its maximum density (smallest physical size), which may make it easier to detect (Helmi & White 1999; Balbinot & Gieles 2018).
Because the stream is so close to the Sun, the distribution of the line-of-sight velocities of its members spans a wide range from −400 to 400 km s−1. Figure 5 shows that as the stars move away from the Sun, the predicted line-of-sight velocity reaches values of ∼500 km s−1 for l ∼ 100° and l ∼ −50° (when the stars lie at distances greater than 5 and 10 kpc from the Sun, respectively).
To demonstrate how ED-2 morphology would resemble that of a cold stellar stream when in different orbital phases, we show in Fig. 6 the expected on-sky distribution of its members stars at the present time and at 25 and 250 Myr in the future. We note that initially, ED-2 members converge towards the present-day position of NGC 6101 (as discussed in Sect. 2.2). However, at its next apocentre, it resembles a thinner structure in the direction of the MW bulge (but behind it, as shown in the small insets of Fig. 6).
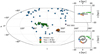 |
Fig. 6. All-sky galactic coordinate of the present day (blue), and at 25 (orange), and 250 (green) Myr in the future position of ED-2 members evolved in a MW-like potential. The present-day locations of NGC 6101 and NGC 3201 are also shown. In the two insets, we show the x − y and x − z projections. A schematic representation of the MW disk and bulge is also given. An animated version of this figure is available online. |
4. Discussion
We presented an extensive analysis of the newly discovered ED-2 stream. We find that the stream forms a tight pancake-like structure, with the least dispersion in the x − z plane. Its stellar population is consistent with an old, single, metal-poor stellar population with a metallicity of ![$ [\text{ Fe} / \text{ H}]=-2.60^{+0.20}_{-0.21} $](/articles/aa/full_html/2023/10/aa47076-23/aa47076-23-eq7.gif) , based on the reanalysis of ED-2 members in LAMOST DR3 by Li et al. (2018a), but also on a high S/N APOGEE member with [Fe/H]= − 2.50 ± 0.085, and a medium-resolution LAMOST DR8 star with [Fe/H]= − 2.45 ± 0.023. This estimate is based on a population of six ED-2 members with spectroscopic metallicities that were selected from the original sample of Dodd et al. (2023), with two additional members from Yuan et al. (2020) that were selected after velocity outliers were removed. Finally, we find a good agreement between the spectroscopic metallicity and the Gaia XP derived metallicities (Andrae et al. 2023).
, based on the reanalysis of ED-2 members in LAMOST DR3 by Li et al. (2018a), but also on a high S/N APOGEE member with [Fe/H]= − 2.50 ± 0.085, and a medium-resolution LAMOST DR8 star with [Fe/H]= − 2.45 ± 0.023. This estimate is based on a population of six ED-2 members with spectroscopic metallicities that were selected from the original sample of Dodd et al. (2023), with two additional members from Yuan et al. (2020) that were selected after velocity outliers were removed. Finally, we find a good agreement between the spectroscopic metallicity and the Gaia XP derived metallicities (Andrae et al. 2023).
We closely inspected the possible association with retrograde stellar streams, namely Phlegethon and Ylgr. We find that despite sharing a similar orbit to ED-2, the Phlegethon is much more distant and localised on the sky, additionally its metallicity, if low, is not as low as ED-2. The second stream, Ylgr, has no radial velocity or metallicity measurements, but we find that in the regions of the sky in which the expected orbit of ED-2 intersects the location of Ylgr, there is a large distance mismatch between these two streams. Other retrograde stellar streams were also considered as progenitors, but were ruled out because their orbits do not cross the solar neighbourhood or because previous studies linked them to known progenitors.
The orbit of ED-2 is not consistent with any known GCs, although we find some similarities with the orbits of NGC 3201 and NGC 6101, clusters that are typically associated with the Sequoia accretion event (Massari et al. 2019; Callingham et al. 2022). Upon further inspection, we find neither of these GCs to have fully consistent orbits with the dynamics of ED-2 members. Additionally, we find that ED-2 is more metal poor than these two GCs. Gaia-derived metallicities for high-confidence NGC 6101 members seem to favour a [Fe/H]∼ − 1.8 metallicity value for this cluster, in agreement with spectroscopic estimates. This strongly suggests that no known GC is the progenitor of ED-2. Instead, ED-2 seems to be in the same class of progenitor-less stellar streams that have been recently discovered, such as C-19 (Martin et al. 2022) and the Phoenix stream (Balbinot et al. 2016; Wan et al. 2020).
We find that ED-2 resembles a shell or elongated pancake-like structure that is nearing pericentre. We estimate that ED-2 is a relatively cold stream, with a thickness of 130 pc and a velocity dispersion of 7.4 km s−1. We note that due to PM and parallax uncertainties, both the size and especially the velocity dispersion are likely overestimated (given the 5 km s−1 velocity error typical of its members). The morphology of ED-2 is expected at its orbital phase, where streams are compressed (and their velocity dispersions enhanced; see Helmi & White 1999). From orbital integrations, we find that ED-2 would resemble a thinner stream if it were observed at apocentre. Based on its characteristics, a likely scenario is that it had a GC or ultra-faint dwarf galaxy progenitor.
Recently, Mikkola et al. (2023) showed that ED-2 is expected to contain roughly 180 members within 3 kpc from the Sun. However, we are lacking radial velocity measurements to be able to find these additional members. Our orbit integrations predict a distinct line-of-sight signature beyond the solar neighbourhood. In particular, we expect that new members in the direction of NGC 6101 (i.e., closer to the Galaxy centre and below its plane) have line-of-sight velocities close to 500 km s−1.
Future spectroscopic surveys, such as WEAVE and 4MOST, will thus likely allow the identification of more ED-2 members. Furthermore, higher-resolution spectroscopic observations of the stream will enable a robust classification of its progenitor as a GC or ultra-faint dwarf galaxy based on its internal metallicity spread (Willman & Strader 2012) and light-element abundance spreads (Bragaglia et al. 2017).
Movie
Movie 1 associated with Fig. 6 (Figure6) Access here
We adopted the official Gaia cross match with the survey, available at https://gea.esac.esa.int/archive/
We note that throughout this paper, we corrected all our photometric data for extinction using the Schlegel et al. (1998) dust maps and a Cardelli et al. (1989) extinction curve assuming RV = 3.1.
We note that this metallicity estimate is not on the same scale as in Carretta et al. (2009).
We note that the APOGEE DR17 spectral library is truncated at [Fe/H]= − 2.5 (see https://www.sdss4.org/dr17/irspec/apogee-libraries/). Thus, the metallicity for this star could be an overestimate.
Acknowledgments
The authors would like to thank the anonymous reviewer for their comments and suggestions that helped improve this manuscript. We acknowledge support from a Spinoza prize from the Netherlands Organisation for Scientific Research (NWO). The authors would like to thank Zhen Yuan for sharing the list of potential ED-2 stars. E.B. thanks Ivan Cabrera-Ziri for the discussion on the chemistry of NGC 6101. T.R.L. acknowledges support from Juan de la Cierva fellowship (IJC2020-043742-I), financed by MCIN/AEI/10.13039/501100011033. We have made use of data from the European Space Agency (ESA) mission Gaia (https://www.cosmos.esa.int/gaia), processed by the Gaia Data Processing and Analysis Consortium (DPAC, https://www.cosmos.esa.int/web/gaia/dpac/consortium). Funding for the DPAC has been provided by national institutions, in particular the institutions participating in the Gaia Multilateral Agreement. Non-public data underlying this article will be shared on reasonable request to the authors. The full list of ED-2 members used in this work is available in the appendix. The following software packages were used in this publication: Astropy (Astropy Collaboration 2013, 2018), dustmaps (Green 2018), IPython (Pérez & Granger 2007), matplotlib (Hunter 2007), numpy (Walt 2011), scipy (Jones et al. 2001), vaex (Breddels & Veljanoski 2018).
References
- Abbott, T., Kron, R., Wang, M. Y., et al. 2019, Minor Planet Electronic Circulars, 2019–J52 [Google Scholar]
- Andrae, R., Rix, H.-W., & Chandra, V. 2023, ApJS, 267, 8 [NASA ADS] [CrossRef] [Google Scholar]
- Astropy Collaboration (Robitaille, T. P., et al.) 2013, A&A, 558, A33 [NASA ADS] [CrossRef] [EDP Sciences] [Google Scholar]
- Astropy Collaboration (Price-Whelan, A. M., et al.) 2018, AJ, 156, 123 [Google Scholar]
- Balbinot, E., & Gieles, M. 2018, MNRAS, 474, 2479 [NASA ADS] [CrossRef] [Google Scholar]
- Balbinot, E., Yanny, B., Li, T. S., et al. 2016, ApJ, 820, 58 [CrossRef] [Google Scholar]
- Baumgardt, H., & Hilker, M. 2018, MNRAS, 478, 1520 [Google Scholar]
- Belokurov, V., Evans, N. W., Irwin, M. J., et al. 2007, ApJ, 658, 337 [Google Scholar]
- Bonaca, A., Naidu, R. P., Conroy, C., et al. 2021, ApJ, 909, L26 [NASA ADS] [CrossRef] [Google Scholar]
- Bragaglia, A., Carretta, E., D’Orazi, V., et al. 2017, A&A, 607, A44 [NASA ADS] [CrossRef] [EDP Sciences] [Google Scholar]
- Breddels, M. A., & Veljanoski, J. 2018, A&A, 618, A13 [NASA ADS] [CrossRef] [EDP Sciences] [Google Scholar]
- Callingham, T. M., Cautun, M., Deason, A. J., et al. 2022, MNRAS, 513, 4107 [NASA ADS] [CrossRef] [Google Scholar]
- Cardelli, J. A., Clayton, G. C., & Mathis, J. S. 1989, ApJ, 345, 245 [Google Scholar]
- Carretta, E., Bragaglia, A., Gratton, R., D’Orazi, V., & Lucatello, S. 2009, A&A, 508, 695 [NASA ADS] [CrossRef] [EDP Sciences] [Google Scholar]
- Choi, J., Dotter, A., Conroy, C., et al. 2016, ApJ, 823, 102 [Google Scholar]
- Cohen, R. E., Sarajedini, A., Kinemuchi, K., & Leiton, R. 2011, ApJ, 727, 9 [NASA ADS] [CrossRef] [Google Scholar]
- Conroy, C., Naidu, R. P., Zaritsky, D., et al. 2019, ApJ, 887, 237 [NASA ADS] [CrossRef] [Google Scholar]
- Dalessandro, E., Ferraro, F. R., Massari, D., et al. 2015, ApJ, 810, 40 [NASA ADS] [CrossRef] [Google Scholar]
- Dodd, E., Callingham, T. M., Helmi, A., et al. 2023, A&A, 670, L2 [NASA ADS] [CrossRef] [EDP Sciences] [Google Scholar]
- Gaia Collaboration (Babusiaux, C., et al.) 2018, A&A, 616, A10 [NASA ADS] [CrossRef] [EDP Sciences] [Google Scholar]
- Gaia Collaboration (Antoja, T., et al.) 2021a, A&A, 649, A8 [EDP Sciences] [Google Scholar]
- Gaia Collaboration (Brown, A. G. A., et al.) 2021b, A&A, 650, C3 [EDP Sciences] [Google Scholar]
- Geisler, D., Piatti, A. E., Claria, J. J., & Minniti, D. 1995, AJ, 109, 605 [NASA ADS] [CrossRef] [Google Scholar]
- Green, G. 2018, J. Open Source Softw., 3, 695 [NASA ADS] [CrossRef] [Google Scholar]
- Grillmair, C. J., & Dionatos, O. 2006, ApJ, 643, L17 [Google Scholar]
- Hansen, T. T., Riley, A. H., Strigari, L. E., et al. 2020, ApJ, 901, 23 [NASA ADS] [CrossRef] [Google Scholar]
- Harris, W. E. 1996, AJ, 112, 1487 [Google Scholar]
- Helmi, A. 2020, ARA&A, 58, 205 [Google Scholar]
- Helmi, A., & White, S. D. M. 1999, MNRAS, 307, 495 [CrossRef] [Google Scholar]
- Hunter, J. D. 2007, Comput. Sci. Engi., 9, 90 [Google Scholar]
- Ibata, R. A., Gilmore, G., & Irwin, M. J. 1994, Nature, 370, 194 [Google Scholar]
- Ibata, R. A., Malhan, K., Martin, N. F., & Starkenburg, E. 2018, ApJ, 865, 85 [NASA ADS] [CrossRef] [Google Scholar]
- Ibata, R. A., Malhan, K., & Martin, N. F. 2019, ApJ, 872, 152 [Google Scholar]
- Ibata, R., Malhan, K., Martin, N., et al. 2021, ApJ, 914, 123 [NASA ADS] [CrossRef] [Google Scholar]
- Jones, E., Oliphant, T., Peterson, P., et al. 2001, SciPy: Open Source Scientific Tools for Python [Google Scholar]
- Koposov, S. E., Rix, H.-W., & Hogg, D. W. 2010, ApJ, 712, 260 [Google Scholar]
- Koppelman, H. H., Helmi, A., Massari, D., Price-Whelan, A. M., & Starkenburg, T. K. 2019, A&A, 631, L9 [NASA ADS] [CrossRef] [EDP Sciences] [Google Scholar]
- Küpper, A. H. W., Balbinot, E., Bonaca, A., et al. 2015, ApJ, 803, 80 [Google Scholar]
- Li, G.-W., Yanny, B., & Wu, Y. 2018a, ApJ, 869, 122 [NASA ADS] [CrossRef] [Google Scholar]
- Li, H., Tan, K., & Zhao, G. 2018b, ApJS, 238, 16 [CrossRef] [Google Scholar]
- Li, H., Aoki, W., Matsuno, T., et al. 2022, ApJ, 931, 147 [NASA ADS] [CrossRef] [Google Scholar]
- Lindegren, L., Klioner, S. A., Hernández, J., et al. 2021, A&A, 649, A2 [EDP Sciences] [Google Scholar]
- Malhan, K., & Ibata, R. A. 2018, MNRAS, 477, 4063 [Google Scholar]
- Marín-Franch, A., Aparicio, A., Piotto, G., et al. 2009, ApJ, 694, 1498 [Google Scholar]
- Martin, N. F., Ibata, R. A., Starkenburg, E., et al. 2022, MNRAS, 516, 5331 [NASA ADS] [CrossRef] [Google Scholar]
- Massari, D., Koppelman, H. H., & Helmi, A. 2019, A&A, 630, L4 [NASA ADS] [CrossRef] [EDP Sciences] [Google Scholar]
- Mateu, C., Read, J. I., & Kawata, D. 2018, MNRAS, 474, 4112 [Google Scholar]
- Mikkola, D., McMillan, P. J., & Hobbs, D. 2023, MNRAS, 519, 1989 [Google Scholar]
- Myeong, G. C., Vasiliev, E., Iorio, G., Evans, N. W., & Belokurov, V. 2019, MNRAS, 488, 1235 [Google Scholar]
- Odenkirchen, M., Grebel, E. K., Rockosi, C. M., et al. 2001, ApJ, 548, L165 [Google Scholar]
- Pérez, F., & Granger, B. E. 2007, Comput. Sci. Eng., 9, 21 [Google Scholar]
- Price-Whelan, A. M. 2017, J. Open Source Softw., 2, 388 [NASA ADS] [CrossRef] [Google Scholar]
- Riley, A. H., & Strigari, L. E. 2020, MNRAS, 494, 983 [NASA ADS] [CrossRef] [Google Scholar]
- Schlegel, D. J., Finkbeiner, D. P., & Davis, M. 1998, ApJ, 500, 525 [Google Scholar]
- Shipp, N., Drlica-Wagner, A., Balbinot, E., et al. 2018, ApJ, 862, 114 [Google Scholar]
- Shipp, N., Erkal, D., Drlica-Wagner, A., et al. 2021, ApJ, 923, 149 [NASA ADS] [CrossRef] [Google Scholar]
- Tenachi, W., Oria, P.-A., Ibata, R., et al. 2022, ApJ, 935, L22 [NASA ADS] [CrossRef] [Google Scholar]
- Vasiliev, E., & Baumgardt, H. 2021, MNRAS, 505, 5978 [NASA ADS] [CrossRef] [Google Scholar]
- Walt, S. V. D., Colbert, S. C., & Varoquaux, G., 2011, Comput. Sci. Eng., 13, 22 [Google Scholar]
- Wan, Z., Lewis, G. F., Li, T. S., et al. 2020, Nature, 583, 768 [Google Scholar]
- Willman, B., & Strader, J. 2012, AJ, 144, 76 [Google Scholar]
- Yanny, B., Rockosi, C., Newberg, H. J., et al. 2009, AJ, 137, 4377 [Google Scholar]
- Yuan, Z., Myeong, G. C., Beers, T. C., et al. 2020, ApJ, 891, 39 [NASA ADS] [CrossRef] [Google Scholar]
- Zinn, R., & West, M. J. 1984, ApJS, 55, 45 [Google Scholar]
Appendix A: List of members
Here we list all the members of ED-2 used in this work. We give only their Gaia DR3 source_id values, and we note that we also include the velocity outliers that were removed in Sect 2.
Gaia DR3 source_id for ED-2 members used in this work
All Tables
All Figures
|
Fig. 1. Gaia DR3 CMDs showing ED-2 6D members as blue circles. In the left panel, the dashed lines were constructed using a log10(age/yr) = 10.20 and [Fe/H]= − 2.0 MIST v1.2 isochrone. In the right panel, we show bright, uncrowded, high-probability (> 0.99) members of NGC 6101 (Vasiliev & Baumgardt 2021) with red pluses (see Sect. 2.2). In both panels, the background shows a linear scale density of halo stars selected according to Eq. (1). The orange dots show the VMP cluster from Yuan et al. (2020). In the left panel, symbols marked by the horizontal lines indicate stars that have spectroscopic metallicities (see Fig. 3). |
| In the text | |
|
Fig. 2. Cartesian heliocentric positions and velocities for ED-2 members. The grey symbols mark members that fall outside our narrow photometric selection (see Fig. 1). The red dots show the VMP cluster from Yuan et al. (2020). The lines show a small portion of the orbits of ED-2 members, integrated in a MWPOTENTIAL potential for 20 Myr. The blue arrow indicates the approximate direction in which the stars move. ED-2 form a tight sequence in the x − z and vx − y panels. We find that three objects of Yuan et al. (2020) are outliers in vx (outside the plot range) and vz, which are unlikely to belong to ED-2. In the three top left panels, the arrows indicate the mean projected velocity vector. The three top right panels show the original Dodd et al. (2023) membership (orange) and the expanded membership we adopted in this work (blue). We only show these two samples in the velocity sub-space because this was the sub-space we used to find new members of ED-2 (see Sect. 2). |
| In the text | |
|
Fig. 3. Metallicity distribution for ED-2. Top panel: [Fe/H] distribution as a function of observed G-band magnitude for the spectroscopic members listed in Table 1 using the Li et al. (2018b) catalogue based on LAMOST and APOGEE data where available. We also show the spectro-photometric metallicities from Andrae et al. (2023) after the quality cuts described in Sect. 2.1. We show the same for members of NGC 6101. Bottom panel: KDE of the [Fe/H] distribution from spectroscopy and Andrae et al. (2023). The median (solid) and 25th and 75th percentiles (dashed) are shown as vertical lines, matching the colour scheme of the two samples in the top panel. We note the good agreement between the spectroscopic and spectrophotometric metallicities for ED-2 members. |
| In the text | |
|
Fig. 4. ED-2 in IoM space. Top: Lz vs. Etot showing GCs (circles) coloured by their orbital eccentricity. ED-2 is shown as dark blue circles, while the squares show known retrograde streams (see the legend; Bonaca et al. 2021). Bottom: same as above, but for Lz vs. L⊥. Additionally, we show the distribution of L⊥ as a violin plot (shaded regions), estimated from the orbits of NGC 3201, NGC 6101, and ED-2. As a comparison, we also show the original ED-2 members identified by Dodd et al. (2023; orange circles) overlaid on our extended sample (see Sect. 2 and Fig. 2). |
| In the text | |
|
Fig. 5. Galactic b, heliocentric velocity (Vhelio), and distance as a function of galactic l from top to bottom. ED-2 members are shown in blue, and the grey lines show their predicted orbits. We show the Phlegethon and Ylgr streams (see legend) when data are available. The red (purple) star marks the location of NGC 6101 (NGC 3201). We note that NGC 6101 has an excellent match in distance, but only approximately aligns with the ED-2 orbit (integrated for 25 Myr and shown in grey) in the other two panels. |
| In the text | |
|
Fig. 6. All-sky galactic coordinate of the present day (blue), and at 25 (orange), and 250 (green) Myr in the future position of ED-2 members evolved in a MW-like potential. The present-day locations of NGC 6101 and NGC 3201 are also shown. In the two insets, we show the x − y and x − z projections. A schematic representation of the MW disk and bulge is also given. An animated version of this figure is available online. |
| In the text | |
Current usage metrics show cumulative count of Article Views (full-text article views including HTML views, PDF and ePub downloads, according to the available data) and Abstracts Views on Vision4Press platform.
Data correspond to usage on the plateform after 2015. The current usage metrics is available 48-96 hours after online publication and is updated daily on week days.
Initial download of the metrics may take a while.