| Issue |
A&A
Volume 696, April 2025
|
|
|---|---|---|
| Article Number | A179 | |
| Number of page(s) | 9 | |
| Section | Galactic structure, stellar clusters and populations | |
| DOI | https://doi.org/10.1051/0004-6361/202554092 | |
| Published online | 23 April 2025 | |
The Bulge Cluster Origin (BulCO) survey at the ESO-VLT: Probing the early history of the Milky Way assembly. Design and first results in Liller 1★
1 Dipartimento di Fisica e Astronomia, Università degli Studi di Bologna, Via Gobetti 93/2, 40129 Bologna, Italy
2 INAF, Osservatorio di Astrofisica e Scienza dello Spazio di Bologna, Via Gobetti 93/3, 40129 Bologna, Italy
3 European Southern Observatory, Karl-Schwarzschild-Strasse 2, 85748 Garching bei Munchen, Germany
4 Excellence Cluster ORIGINS, Boltzmann-Strasse 2, 85748 Garching Bei Munchen, Germany
5 Institute for Astronomy, University of Edinburgh, Royal Observatory, Blackford Hill, Edinburgh, EH93HJ, UK
6 Department of Physics and Astronomy, UCLA, 430 Portola Plaza, Box 951547, Los Angeles, CA 90095-1547, USA
★★ Corresponding author: This email address is being protected from spambots. You need JavaScript enabled to view it.
Received:
10
February
2025
Accepted:
17
March
2025
Abstract
We present the scientific goals and the very first results of the Bulge Cluster Origin (BulCO) survey. This survey has been specifically designed to perform an unprecedented chemical screening of stellar systems orbiting the Milky Way bulge, with the aim to unveil their true origin. It takes advantage of the improved performances of the spectrograph CRIRES+ operating at the ESO Very Large telescope in the near-infrared domain. Due to the complex evolutionary history of the Milky Way, a variety of relics tracing different phenomena is expected to populate the bulge: Globular clusters formed in situ or accreted from outside the Galaxy, nuclear star clusters of cannibalized structures, and possibly a few remnants of the proto-bulge formation process (the so-called bulge fossil fragments). The signatures of the different origins are imprinted in the chemical properties of these stellar systems because specific abundance patterns provide authentic chemical DNA tests that unequivocally trace the enrichment process, and therefore, the environment in which the stellar population formed. Thus, each system can provide a new piece of information on the bulge formation and evolutionary history. As first results of the survey, we discuss the α−element and iron abundances of a sample of stars that was observed in the stellar system Liller 1, which is proposed to be a bulge fossil fragment. By combining this dataset with a recently published sample of high- to medium-resolution spectra, we show that the overall chemical properties of the stellar populations in Liller1 prove its tight link with the Galactic bulge and provide new constraints on its star formation history.
Key words: techniques: spectroscopic / Galaxy: bulge / Galaxy: formation / globular clusters: individual: Liller 1
Based on observations collected at the Very Large Telescope of the European Southern Observatory at Cerro Paranal (Chile) under Large Program 110.24A4 (PI:Ferraro).
© The Authors 2025
 Open Access article, published by EDP Sciences, under the terms of the Creative Commons Attribution License (https://creativecommons.org/licenses/by/4.0), which permits unrestricted use, distribution, and reproduction in any medium, provided the original work is properly cited.
This article is published in open access under the Subscribe to Open model. This email address is being protected from spambots. You need JavaScript enabled to view it. to support open access publication.
1 Introduction
The Λ-cold dark matter cosmological model (e.g., White & Rees 1978; Davis et al. 1985) predicts that cosmic structures assemble bottom-up through hierarchical merging processes, and it successfully explains the existence and observed properties of massive galaxies and galaxy clusters. The unprecedented exploration of the Milky Way (MW) performed by the Gaia mission identified several kinematical structures (e.g., Gaia-Enceladus, the Helmi stream, and Sequoia) that are associated with past accretion events in the MW halo (see, e.g., Helmi 2020). They suggest that only ∼50% of the surveyed globular clusters (GCs) has an in situ origin, while the remaining fraction was accreted from outside or has a still unclear nature (Massari et al. 2019). In this respect, the most famous remnant of a remote merging event found in the Galactic halo is ω Centauri.
Despite its original classification as a GC, this stellar system has been found to host multi-iron subpopulations (Norris et al. 1996; Pancino et al. 2000; Origlia et al. 2003; Ferraro et al. 2004; Johnson & Pilachowski 2010; Bellini et al. 2017; Mészáros et al. 2021; Alvarez Garay et al. 2022, 2024b), and its properties suggest that it is the remnant of a nuclear star cluster of an accreted dwarf galaxy (Bekki & Freeman 2003; Romano et al. 2007). Because of its prohibitive density and reddening conditions, no comparably conclusive results are available for the Galactic bulge. However, it is reasonable to expect that this region of the Galaxy also experienced accretion events that left detectable signatures imprinted in its population of old stellar systems. According to what is observed at high-redshift in the so-called chain and clumpy galaxies (Elmegreen et al. 2009; Genzel et al. 2011; Tacchella et al. 2015), the entire assembly process of a galaxy starts from the bulge through the merging of local clumps of stars and gas (Immeli et al. 2004; Elmegreen et al. 2008; Bournaud & Elmegreen 2009). Although most of these massive clumps are predicted to dissolve and form the spheroid, a few of them might survive the total disruption (Bournaud 2016) and might still be present in the inner regions of the host galaxy, where they might appear to be massive GCs. In contrast to genuine GCs, however, these fossil relics are expected to host multi-iron and multi-age subpopulations that share the same chemical patterns as bulge field stars (see below). Two stellar systems with these properties were recently identified in the MW bulge and are thus promising to be bulge fossil fragments (BFFs), that is, the fossil records of its hierarchical assembly process: Terzan 5 (Ferraro et al. 2009, 2016; Origlia et al. 2011, 2013, 2019; Massari et al. 2014; Romano et al. 2023; Crociati et al. 2024) and Liller 1 (Ferraro et al. 2009, 2021; Pallanca et al. 2021a; Crociati et al. 2023; Alvarez Garay et al. 2024a; Fanelli et al. 2024). In addition to BFFs that trace the very first phases of the bulge formation process, and in addition to in situ formed genuine GCs, a variety of other objects mapping different phenomena are expected to populate the bulge and appear as old stellar systems: accreted genuine GCs that formed in an external galaxy and were brought into the bulge by an accretion event, and possibly nuclear star clusters of cannibalized structures. The signatures of different origins are imprinted in the physical and chemical properties of these stellar systems. In this framework, we are leading a project to fully characterize bulge stellar systems by combining high-resolution and multi-wavelength photometric and spectroscopic observations, proper motion (PM) membership selection, and an accurate correction for the effects of differential reddening (see Massari et al. 2012; Cadelano et al. 2023; Deras et al. 2023; Libralato et al. 2022; Pallanca et al. 2021a,b, 2023; Saracino et al. 2015, 2016, 2019).
The BulCO survey is part of this comprehensive effort. Taking advantage of the pioneering experience of our group in the near-infrared (NIR) spectroscopy of dense star clusters (see Origlia et al. 1997, 2002, 2003, 2005, 2008; Origlia & Rich 2004) and of the improved performances of the CRyogenic high-resolution InfraRed Echelle Spectrograph (CRIRES+; Kaeufl et al. 2004; Dorn et al. 2014, 2023) at the ESO Very Large Telescope (VLT), the BulCO survey performs an unprecedented high-resolution chemical screening of the stellar populations hosted in a selected sample of systems that are traditionally cataloged as bulge GCs (e.g., Harris 1996). Chemical tagging is a key tool for the determination of the nature and origin of the stellar systems orbiting the Galactic Bulge. The characteristic dynamical timescales in the Bulge are so short that dynamical friction and other processes could have cleared out the kinematic signatures imprinted in the original orbit of each system, while the chemical properties permanently flag the cluster origin independently of the accretion epoch. The abundances of iron, iron-peak, CNO, and other α- and light-elements will be measured and used as chemical DNA tests to distinguish the true nature and origin of each target. We will thus reconstruct the evolutionary history of the Bulge. The atmospheres of the stars that we observe today preserve the memory of the chemical composition of the interstellar medium (ISM) from which they formed, and the chemical abundances of the ISM vary in time if more than one burst of star formation occurs owing to the ejecta of each stellar generation. Thus, stars that formed at different times and in environments with different star formation rates (SFRs) have different chemical compositions and, by analyzing the chemistry of each stellar population, we can unequivocally trace the enrichment process of the ISM. Different abundance patterns are expected depending on the stellar polluters, the enrichment timescale, and the SFR, and a few specific abundance patterns are so distinctive that they can be used as DNA tests of the stellar population origin. More specifically, (1) BFFs are expected to host multi-iron and multi-age subpopulations with the same chemical patterns as the bulge stars, (2) nuclear star clusters of accreted galaxies should show an iron spread (e.g., Neumayer et al. 2020), together with α−element patterns and iron-peak element abundances that are substantially different from the Bulge environment, and (3) genuine GCs are predicted to be homogeneous in iron and show peculiar correlations and anticorrelations between pairs of light elements (e.g. Carretta et al. 2009, 2010; Milone et al. 2017). Among the latter, in situ formed and accreted GCs can be distinguished through their α- and iron-peak element abundances (Minelli et al. 2021; Mucciarelli et al. 2021; Ceccarelli et al. 2024).
The aim of this paper is to present and describe the BulCO survey and discuss the first set of results for a sample of stars observed in Liller 1, which is one of the two candidate BFFs known so far. Section 2 provides an overview of the survey. In Section 3 we describe the observations and the adopted data-reduction procedures. The results are presented in Section 4, and Section 5 is devoted to the discussion and conclusion.
Main properties of the 17 star clusters selected as targets of the BulCO survey.
2 The BulCO survey
The BulCO survey is a 255-hour Large Program at the ESO-VLT that is specifically designed to take advantage of the improved performances of the CRIRES+ spectrograph.
The selected clusters − Seventeen stellar systems that are traditionally classified as GCs in the MW bulge were selected as spectroscopic targets for the BulCO survey with the specific aim of decoding their chemical DNA and unveil their true origin and nature. The main properties of the selected targets are listed in Table 1, and their position in Galactic longitude and latitude is shown in Figure 1. The list includes star clusters that are currently thought to belong to different categories: the two most metal-rich and (as far as we know) mono-metallic GCs in the MW (NGC 6553 and NGC 6528), the two most massive bulge stellar systems (NGC 6388 and NGC 6441; based on a few spectra, they are thought to be accreted systems; Minelli et al. 2021; but see also Carretta & Bragaglia 2023; Massari et al. 2023), NGC 6656 (a largely debated GC that is thought to harbor multi-iron subpopulations; Marino et al. 2009; Mucciarelli et al. 2015), the two currently known BFF candidates (Terzan 5 and Liller 1), and a representative sample of stellar systems in the inner bulge that still remains almost chemically unexplored. The orbital properties of some objects in this sample are consistent with an accreted origin (Massari et al. 2019; Callingham et al. 2022; namely, Terzan 1, Terzan 2, Terzan 6, Terzan 10, Palomar 6, UKS1, Djorgovski 2, NGC 6304, NGC 6316, and NGC 6380).
The observational strategy − To select the spectroscopic target stars in each of the 17 clusters, we made use of the large photometric dataset collected by our group over the years in the NIR and optical bands (see Ferraro et al. 2000, 2009, 2021; Valenti et al. 2005, 2007; Pallanca et al. 2021a; Lanzoni et al. 2007, 2010, 2013). This was complemented by ongoing Hubble Space Telescope (HST) and Gemini observations, as well as archive images retrieved from the Gemini, VLT, and HST repositories. Whenever possible, relative PMs were computed by using multi-epoch HST images (see Libralato et al. 2022) or by combining HST and adaptive-optics-assisted ground-based images (see examples in Ferraro et al. 2016, 2021; Dalessandro et al. 2016, 2022). We also took advantage of PM measurements from Gaia DR3 (Gaia Collaboration 2016, 2023) and of the accurate radial velocities obtained from the ongoing spectroscopic survey MIKiS (Ferraro et al. 2018) and archive data.
This allowed us to select at least 20 giant stars in each cluster for a grand total of 420 spectroscopic targets that are likely members of the systems based on their PM and radial velocity. All the observations were planned with the 0.4′′ wide slit, thus providing an overall spectral resolution R ∼ 50 000. For each giant, observations in at least two of the following three gratings were foreseen: J1226, H1582, and K2166. These gratings sample a large number of unblended spectral lines that are individually listed below.
The J1226 grating covers the 1116–1356 nm spectral region. This allows us to measure the abundance of iron (Fe), iron-peak elements such as zinc (Zn), vanadium (V), chromium (Cr), cobalt (Co), nickel (Ni), and manganese (Mn), α-elements such as calcium (Ca), silicon (Si), magnesium (Mg), and titanium (Ti), and other light elements such as carbon (C), nitrogen (N), sodium (Na), aluminum (Al), and potassium (K).
The H1582 grating (sampling △λ = 1484–1854 nm) allows us to measure the oxygen (O) and 12C+13C abundances from a few dozen OH and CO molecular lines, as well as the abundances of sulfur (S), cerium (Ce), V, Fe, Cr, Mn, Ni, Co, C, Mg, Si, Ca, Ti, Na, Al, and N (from a few dozen CN molecular lines).
The K2166 grating (covering △λ = 1921–2472 nm) allows us to identify about 12 Fe lines, a few dozen CN molecular lines providing the N abundance, and ∼25 lines of α-elements such as Mg, Si, Ca, Ti, Na, and Al.
Thus, the selected gratings offer the opportunity of measuring all the element abundances and abundance ratios necessary to constrain the cluster origin, enrichment timescales, and stellar nucleosynthesis. In this respect, the following chemical diagnostics are especially relevant:
The [Fe/H] distribution within each cluster is crucial to immediately distinguish whether the system is a potential BFF (showing multi-iron subpopulations, as in Terzan 5 and Liller 1; see Massari et al. 2014; Origlia et al. 2011; Crociati et al. 2023; Fanelli et al. 2024), the nuclear star cluster of an accreted galaxy (with a broad iron distribution that peaks at significantly lower metallicity, as in the case of ω Centauri; see Norris et al. 1996; Johnson & Pilachowski 2010), or a GC (with single-iron population).
The [α/Fe] abundance ratios provide crucial information on the relative contribution and timescale of the ISM enrichment from supernovae type II and type Ia (SNeII and SNeIa, respectively), and they can also provide additional constraints to an in situ (bulge) versus an external (other Galactic components or extragalactic) formation scenario.
The [iron-peak/Fe] abundance ratios of a few iron-peak elements such as V and Zn were also found to be powerful diagnostics of the SFR in the environment in which stars formed. These elements are mainly produced by high-mass (>20 M⊙) stellar progenitors via hypernovae, SNeII, and electron-capture SNe (Romano et al. 2010; Kobayashi et al. 2020, however, see Palla 2021 about the uncertain contribution to V synthesis by SNeIa). Hence, the [V/Fe] and [Zn/Fe] ratios are expected to be lower in galaxies with a low SFR (i.e., with a smaller contribution from massive stars) than in high SFR systems (Jeˇrábková et al. 2018), allowing a solid distinction between GCs that formed in situ and those that were accreted (Minelli et al. 2021).
The O, Na, Al, Mg, and K abundance distributions within each cluster can probe whether there has been self-enrichment in light elements that produced the typical (anti-) correlations observed in GCs (e.g., Carretta et al. 2009, 2010; Mucciarelli et al. 2012).
CO and OH molecular lines are also crucial thermometers for properly estimating the stellar surface temperature needed for the chemical analysis.
The [C/N] and 12C/13C abundance ratios are powerful tracers of the mixing and extramixing processes during the red giant branch evolution.
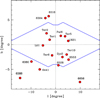 |
Fig. 1 Position in Galactic longitude (l) and latitude (b) of the 17 star clusters (large red circles) selected as targets of the BulCO survey. They are all observed in the direction of the Galactic bulge. For reference, the blue lines represent the outline of the inner bulge as traced at 3.5 μm by COBE/DIRBE (Weiland et al. 1994). |
Coordinates, K-band magnitude, atmospheric parameters, radial velocity, and chemical abundances of the observed stars in Liller 1.
3 First results in Liller 1
3.1 Observations and data reduction
Liller 1 is the second massive stellar system in the Galactic bulge found to host at least two distinct populations with remarkably different ages (after Terzan 5; Ferraro et al. 2009, 2016): 12 Gyr for the oldest component, and just 1–2 Gyr for the youngest one (Ferraro et al. 2021). The star formation history reconstructed for this stellar system through the comparison with synthetic color-magnitude diagrams (Dalessandro et al. 2022) suggests a first prolonged initial burst, followed by a (low-rate) continuous star formation activity characterized by two additional events, predicting that Liller 1 stars probably have a metallicity distribution with two prominent peaks, one peak at subsolar and the other at supersolar metallicity. Following these photometric studies, a number of spectroscopic investigations were performed to obtain a detailed chemical characterization of the hosted sub-populations. The first spectroscopic campaigns, performed at low and medium spectral resolution by using the ESO-VLT Multi Unit Spectroscopic Explorer (MUSE) in Wide Field Mode (Crociati et al. 2023) and X-shooter (Alvarez Garay et al. 2024a), respectively, fully confirmed the expectation. They reported a clear bimodal distribution with a subsolar and a supersolar component. Then, Fanelli et al. (2024, hereafter F24) discussed the spectroscopic screening of 21 giants from high-resolution (R ∼ 25 000) spectra secured at the Keck telescope with the Near-Infrared Spectrograph (NIRSPEC), and suggested the possible presence of an additional component at intermediate metallicities. We present the spectroscopic analysis of 12 stars observed in Liller 1 in the context of the BulCO survey: These are the spectra at the highest spectral resolution (R ∼ 50 000) obtained so far in this stellar system. The results directly illustrate the quality of the data that we expect to secure in the next years and introduce the science that can be performed with the BulCO survey.
The CRIRES+ data we discuss here were acquired between April 2023 and July 2024 under favorable sky conditions of clearness and seeing. Each star was observed through the H1582 and K2166 gratings. The data reduction was performed by using the pipeline CR2RES version 1.4.1. After the standard dark and flat-field corrections, each spectrum was sky-subtracted by using nod pairs, calibrated in wavelength using arc lamps, and then extracted using the optimum extraction method. This approach minimizes the loss of spectral resolution, maximizes the signal-to-noise ratio, and efficiently identifies local outliers or defects. The signal-to-noise ratio per resolution element of the final spectra was always ≥40.
Table 2 lists the coordinates, K-band magnitudes (from Valenti et al. 2010; Ferraro et al. 2021), and physical properties of the 12 targets. Their position in the plane of the sky with respect to the center of the system (RA = 17h33m24.56s, Dec = −33°23′22.40′′; Saracino et al. 2015) is shown in panel a of Figure 2, and their location in the NIR color-magnitude diagram (CMD) is plotted in panel b. The selected stars clearly are luminous giants and are at least 1.5 magnitudes brighter than the red clump. They are all located in the central region of Liller 1 (at r < 37′′, corresponding to approximately one half-mass radius, rh = 30.5′′; see Saracino et al. 2015). To assess the membership of the observed stars via PMs, we took advantage of the detailed analysis recently presented by Ferraro et al. (2021) and Dalessandro et al. (2022), where high-resolution HST images were combined with ground-based images acquired over a time baseline of 6.3 years with the Gemini Multi-Conjugate Adaptive Optics System (GeMS) at the Gemini South telescope. Seven stars (namely, 100760, 300614, 300682, 300727, 400778, 400829, and 400887) out of the 12 targets have measured PMs. Their position in the vector-point diagram is shown in panel c of Fig. 2. For the sake of comparison, the figure also shows the PM distribution of the surrounding stars brighter than K = 16 (gray dots). The bulge field stars clearly trace a prominent (almost diagonal) distribution that mainly extends at positive values of △μα cos δ and △μδ (see also Figure 2 in Dalessandro et al. 2022), while the member stars of Liller 1 draw a well-defined clump centered at (0,0). The red circle in the figure has a radius of 0.7 mas yr−1, corresponding to three times the average PM error in this magnitude range. The 7 spectroscopic targets with measured PM are all located within it, as expected for likely cluster members. Unfortunately, the 4 brightest targets (namely, 300094, 300315, 387099, and 400065) are highly saturated in the HST images, and the next brightest target (namely, 300553) lies exactly in the gaps of the GeMS detector. No PM can therefore be measured for them. On the other hand, no Gaia PM measurement (Gaia Collaboration 2016, 2023) is available for them.
However, their central position (in a region in which member stars are largely dominant with respect to field interlopers; see, e.g., Figure 1 in Ferraro et al. 2021), their position in the CMD (well aligned along the red giant branch of Liller 1) and their measured radial velocities (see next section) guarantee that they are also high-probability cluster members.
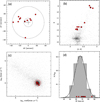 |
Fig. 2 Spectroscopic targets (red squares) observed in Liller 1. Panel a: position of the targets in the plane of the sky with respect to the cluster center (marked with a cross). For the sake of reference, the two dashed circles mark the distances at 10′′ and 37′′ from the center. Panel b: target positions in the NIR CMD. Panel c: vector-point diagram of relative PMs determined from HST and adaptive optics observations. The red circle delimits the stars considered as likely cluster members in Dalessandro et al. (2022). Panel d: radial velocity of the 12 targets compared to the overall distribution of 244 stars measured in previous studies (Crociati et al. 2023; Alvarez Garay et al. 2024a; Fanelli et al. 2024). |
3.2 Atmospheric parameters and spectral analysis
First-guess values of the surface temperature (Teff) and gravity (log g) of the spectroscopic targets were estimated photometrically from the projection of each star onto the closest isochrone in the CMD. Following Ferraro et al. (2021) and Dalessandro et al. (2022), two PARSEC isochrones (Girardi et al. 2002; Marigo et al. 2017) that properly match the old and metal-poor and the young and metal-rich components of Liller 1 were used: the former isochrone has an age of 12 Gyr and a metallicity [Fe/H] = −0.3, and the latter has an age of 2 Gyr and [Fe/H] = +0.3. The comparison was performed in the differential reddening-corrected CMD, adopting a distance modulus (m-M)0 = 14.65 and an average color excess E(B − V) = 4.52 (see Pallanca et al. 2021a; Ferraro et al. 2021). The first-guess values of Teff and log g were then spectroscopically fine-tuned by requiring the simultaneous fit of the observed OH and CO molecular lines and band heads. The photometric and spectroscopic estimates agree well within the errors. Temperatures in the 3400–4300 K range (with uncertainties of ±100 K), and surface gravities in the log g = 0.25−2.00 interval (with a ±0.3 uncertainty) were estimated. In addition, for all the observed stars, a microturbulence velocity of 2 ± 0.3 km s−1, which is typical of giant stars of similar temperatures and metallicities, was assumed (see also Alvarez Garay et al. 2024a; Fanelli et al. 2024, and references therein).
The synthetic spectra we used to measure the radial velocities and chemical abundances of the target stars were computed by adopting the list of atomic lines from the VALD3 compilation (Ryabchikova & Pakhomov 2015), the molecular lines from the website of B. Plez1, MARCS atmosphere models (Gustafsson et al. 2008), and the radiative transfer code TURBOSPECTRUM under LTE approximation (Alvarez & Plez 1998; Plez 2012). We generated multiple grids of synthetic spectra with fixed stellar parameters (appropriate to each star) and varied the metallicity from −1.0 dex to +0.5 dex in steps of 0.25 dex, with both solar-scaled and some enhancement of [α/Fe] (+0.3 dex) and [N/Fe] (+0.5 dex) and a corresponding depletion of [C/Fe] (−0.3 dex) for a proper computation of the molecular equilibria. Solar-scaled [X/Fe] values were adopted for the other elements. The synthetic spectra computed at the nominal CRIRES+ resolution (R ∼ 50 000) were convoluted with a Gaussian function with an FWHM that varied between 9 and 12 km s−1, depending on the star, to account for some additional spectral broadening due to macroturbulence. They thus optimally matched the observed spectra.
For the sake of illustration, Figure 3 shows a small region of the normalized observed spectra in the H and K bands obtained for star 300553. The most relevant absorption lines of the main elements are also marked.
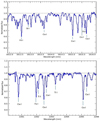 |
Fig. 3 Region of the normalized spectra in the H (upper panel) and K (lower panel) bands obtained for star 300553. The most relevant lines for a few main elements are also marked. |
3.3 Radial velocities and chemical abundances
The radial velocities of the targets were measured by means of a cross-correlation between the observed and synthetic spectra. The resulting values (see Table 2) range between 60 and 85 km s−1, with a typical uncertainty of ∼0.5 km s−1. As shown in Fig. 2d, the radial velocities of the spectroscopic targets (red squares) agree well with the velocity distribution of the 244 stars that we already measured in Liller1 (gray histogram), which is described by a Gaussian function that peaks at 66.7 km s−1 with a dispersion of σ = 8.7 km s−1 (solid line in the figure). The systemic velocity of Liller1 obtained from the entire sample we investigated so far (66.9 ± 0.5 km s−1) exceeds the value of 60.4±2.4 km s−1 quoted in Baumgardt & Hilker (2018), which was based on 64 cluster members with measured radial velocities from the literature.
The chemical abundances of a first set of key elements (namely Fe, Ca, Mg, and Si) that were determined via spectral synthesis for each selected star are listed in Table 2, where only the formal errors are reported. However, the global error of each abundance ratio amounts to 0.1–0.15 dex, mainly due to the uncertainties on the atmospheric parameters. Interestingly, despite the small number of stars, the sample discussed here contains all the main features of the metallicity distribution detected in Liller 1 by previous investigations (see Crociati et al. 2023; Alvarez Garay et al. 2024a; F24). The majority of the stars (7 out of 12) have subsolar metallicity, and the remaining 5 stars are supersolar. In addition, the metal-poor component shows enhanced [Ca/Fe], [Mg/Fe], and [Si/Fe] abundance ratios, and the metal-rich component displays solar-scaled values.
4 Discussion and conclusions
As first result of the BulCO survey that is currently ongoing at the ESO-VLT, this paper presented a high-resolution spectroscopic study in the H and K bands of 12 giant stars that we observed in the bulge complex system Liller 1. To illustrate the results in the context of the current knowledge of the chemical properties of the system best, we discuss in the following the entire sample of stars for which the abundances of Fe, Ca, Mg, and Si were measured from high- and medium-resolution spectra. As mentioned above, F24 presented the chemical abundances of 21 giants observed at R ∼ 25 000 with NIRSPEC at Keck, while Alvarez Garay et al. (2024a) determined the abundances of almost the same chemical elements in 27 giants observed at R ∼ 8000 with X-shooter at ESO-VLT, 9 of which are in common with F24. This means that for a total sample of 51 stars that were observed at high and intermediate resolution, the abundances of these elements are available. In addition, Crociati et al. (2023) measured the Fe abundance of 53 stars from the calcium triplet lines detected in MUSE spectra (R ∼ 3100).
Figure 4 summarizes the current knowledge about the iron distribution in Liller 1. The results of our analysis were merged with those of F24 and Alvarez Garay et al. (2024a) in the top panel because these spectra have the highest spectral resolution. All the datasets clearly show a well-defined bimodal distribution. The dominant component includes approximately 71% of the measured stars, it peaks at [Fe/H] = −0.36 ± 0.03 and has a 1σ dispersion of 0.15±0.02. The supersolar component counts the remaining 29% of the population and shows a peak at [Fe/H] = +0.24 ± 0.02 and 1σ = 0.10 ± 0.02. Thus, the multiple stellar components with different iron abundances that were predicted on the basis of the photometric properties of Liller 1 (Ferraro et al. 2021; Dalessandro et al. 2022) are now solidly confirmed by multi-instrument spectroscopic campaigns. This result agrees well with the expectations from the star formation history of the system determined in the context of a self-enrichment scenario (Dalessandro et al. 2022), where ∼70% of the total mass of the system is formed in the first major burst, and the remaining 30% is assembled over the subsequent lifetime of the stellar system.
The chemical patterns measured in the [α/Fe]−[Fe/H] diagram allowed us to characterize these multi-iron subpopulations in greater depth and to obtain key indications about their possible formation scenarios. The abundance patterns in this diagram are so distinctive that they can be used as a DNA test of the stellar population origin because α-elements (e.g., Ca, Mg, and Si) are mainly synthesized by massive stars and released to the ISM over a short timescale (107 yr) by the explosion of core-collapse SNeII. While a small amount of iron is also produced by SNeII, the large majority is instead ejected by SNIa thermonuclear explosions that occur over longer timescales (e.g., Matteucci & Recchi 2001). This later injection of iron implies that the [α/Fe] ratio, initially set and kept nearly constant by SNeII, starts to decrease rapidly when the first generation of SNeIa explodes. This produces the characteristic knee in the [α/Fe]-[Fe/H] diagram. The knee therefore flags the value of [Fe/H] that the ISM achieved (due to the action of SNeII alone) at the epoch of the first SNIa explosions. This implies that the [α/Fe]−[Fe/H] pattern is a powerful indicator of the SFR in the environment in which stars formed: the higher the SFR, the higher the contribution of SNeII to the chemical enrichment before the bulk of SNeIa explode, and thus, the high the metallicity of the knee in the diagram. The [α/Fe]−[Fe/H] diagram obtained for the total sample is plotted in Figure 5. All the available datasets clearly show that the stellar components with different iron content also have different levels of [α/Fe] enhancement, with the most metal-poor subpopulation being enhanced (on average, by a factor of 2–3) in [Ca/Fe], [Mg/Fe], and [Si/Fe], and the supersolar subpopulation having about solar-scaled values. This testifies that they formed from differently enriched ISM: The main component, with subsolar iron and [α/Fe] enhancement, formed (likely at an early epoch) from gas enriched by SNeII, while the component with supersolar iron and solar-scaled [α/Fe] was generated (likely at much later epochs) from gas that was also enriched by SNeIa on a longer timescale. Interestingly, a few stars were also detected in between the main metal-poor and metal-rich subgroups. They display an intermediate iron content (−0.2 <[Fe/H]< +0.1 dex) and also an intermediate enhancement in [Ca/Fe], [Mg/Fe], and [Si/Fe]. This very important feature also provides insights into the formation history of Liller 1. The star formation history reconstructed from the analysis of the CMD (Dalessandro et al. 2022) predicts that Liller 1 has been active in forming stars for its entire lifetime, with three main episodes. A first, broad event occurred 12–13 Gyr ago, followed by a long tail of star formation activity at a lower rate, with an intermediate (6–8 Gyr ago) and a very recent (2 Gyr ago) burst. This would clearly have favored the formation of a broad distribution in metallicity and α-elements, and it would have retained memory not only of the main star formation episodes, but also of the overall (low-rate) activity, which is now observable in the presence of a few stars with intermediate values of [Fe/H] and [α/Fe].
With the data in hand, we proceeded with our investigation and preliminarily compared the chemical DNA of Liller1 with that of the Galactic bulge. For each target shown in Fig. 5, we determined the average abundance of the three analyzed α-elements (Ca, Mg, and Si), and compared its dependence on [Fe/H] with the pattern obtained from high-resolution optical and NIR spectroscopy of about 150 bulge field stars (Johnson et al. 2014). The latter abundances were placed on the Magg et al. (2022) solar reference. The result is plotted in Figure 6 (left panel) and reveals an astonishing similarity: the two distributions follow exactly the same pattern. This is fully confirmed by a simple statistical analysis. According to the method that was applied by Origlia et al. (2025), for example, we modeled the bulge distribution using a locally weighted scatterplot smoothing2 (LOWESS) function (green line in the left panel of Fig. 6), which is a nonparametric regression technique to obtain an optimal median curve. The right panel of the same figure plots the distribution of the distances of the bulge stars (gray histogram) and Liller 1 stars (orange histogram) from the LOWESS curve. The vast majority of the Liller1 stars is included within 3σ from the bulge distributions, 77% of them lie within 2σ, and 49% are located within 1σ only. This clearly shows the full compatibility of the two samples. As is well known, the abundance pattern defined by Galactic bulge stars in the [α/Fe]−[Fe/H] diagram is unique in the local Universe because it is characterized by a knee at a metallicity [Fe/H] ∼ −0.3 that is significantly higher than those observed in the MW halo and disk ([Fe/H] ∼ −1.0) and in local dwarf galaxies ([Fe/H] ∼ −1.5; see, e.g., Figure 4 in Matteucci & Brocato 1990, Figure 11 in Tolstoy et al. 2009, and Figure 6 in Kobayashi & Taylor 2023). This clearly shows an environment that experienced a particularly intense SFR, and because it is unique in the local Universe, this pattern can be considered as the chemical DNA of the MW bulge. The results shown in Fig. 6 therefore unequivocally demonstrate that Liller 1 is tightly related to the central region of our Galaxy.
Although this analysis was performed on a limited number of stars (51, which include the entire sample of abundances obtained so far from high- and medium-resolution spectroscopy, however), it already allows us to shed new light on the formation process of Liller 1. The evidence that Liller 1 shares the same chemical DNA as the Galactic bulge solidly locates the birth place of this stellar system in the MW core, and it definitely excludes any scenario invoking an accretion of a satellite from outside the bulge. This is also supported by the reconstructed orbit (as computed from Gaia PMs and line-of-sight velocities by Baumgardt & Hilker 2018)3, which confirms that Liller 1 spent all its life confined within the bulge. In addition, the increasing evidence of a continuous (instead of a double-peaked) distribution of Liller 1 stars in the [α/Fe]−[Fe/H] diagram challenges the scenarios invoking a merger of two GCs4 (Khoperskov et al. 2018; Mastrobuono-Battisti et al. 2019; Pfeffer et al. 2021) or the accretion of a giant molecular cloud by a genuine globular (McKenzie & Bekki 2018; Bastian & Pfeffer 2022), beacuse these events are thought to occur only once at most in a cluster lifetime. Instead, the difference in the α−enhancement observed for the multi-iron subpopulations is suggestive of a self-enrichment scenario, which is also supported by the fact that the most metal-rich component is more centrally concentrated than the most metal-poor component (Ferraro et al. 2021; Dalessandro et al. 2022; Crociati et al. 2023). Within the variety of fossil relics that are expected to populate the bulge, the photometric and spectroscopic pieces of evidence collected so far all seem to concur in suggesting that Liller 1 is the remnant of a much more massive stellar system that formed in situ at the epoch of the Galaxy assembly and shared a common evolutionary history with the bulge itself (a possible BFF).
Intriguingly, in the case of Terzan 5, all the photometric, kinematic, and chemical properties observed so far also provided robust evidence of a bulge in situ formation and evolution (see Origlia et al. 2025 and references therein). Thus, two possible BFFs have been discovered in the Galactic bulge so far. Because of their initially high mass, these primordial systems were able to retain the SN ejecta and experience an almost continuous low-rate star formation, with a few more intense bursts from which iron-enriched stars with different α−enhancement originated. A chemical enriching model (similar to the model discussed for Terzan 5 by Romano et al. 2023) specifically designed for Liller 1 is foreseen, with the goal to determine the properties that the progenitor of this system should have had in order to originate its currently observed characteristics. A more detailed chemical screening of the stars in Liller 1 is of paramount importance to shed light on these topics. This is one of the aims of the ongoing BulCO survey, which is expected to acquire R = 50 000 resolution spectra for a total of more than 50 giant stars in Liller 1 in the next months. This sample will provide the definitive shape of the distribution in the [α/Fe]−[Fe/H] diagram, and it will also characterize the currently underpopulated region around solar metallicity. Furthermore, chemical abundances for elements originating from different nucleosynthetic paths will be available. This will remove some important degeneracies that plague chemical evolution models. The conditions will therefore be ideal to unravel the formation history of Liller 1 in the context of the Milky Way bulge assembly.
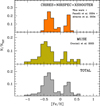 |
Fig. 4 Metallicity distribution of the stars of Liller 1 obtained from recent surveys. Top panel: results of this work (from CRIRES+ at VLT), F24 (from NIRSPEC at Keck), and those of Alvarez Garay et al. (2024a, from X-shooter at VLT). Central panel: iron distribution obtained from MUSE at VLT by Crociati et al. (2023). Bottom panel: [Fe/H] distribution of the total sample obtained by combining the different datasets and counting 105 stars. |
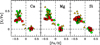 |
Fig. 5 [Ca/Fe], [Mg/Fe], and [Si/Fe] as a function of [Fe/H] for the 51 stars of Liller 1 measured so far. The values obtained from different surveys at high and medium spectral resolution are shown with different symbols. The red squares represent the 12 stars observed with CRIRES+ that we presented in this paper, the yellow triangles show the NIRSPEC sample (F24), and the green circles show the X-shooter sample (Alvarez Garay et al. 2024a). For reference, the dashed vertical and horizontal lines mark the solar values. |
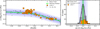 |
Fig. 6 Behavior of the average α−element abundance ratio [<Ca,Mg,O>/Fe] as a function of the metallicity ([Fe/H]) for the 51 stars observed so far in Liller 1 (large orange squares), compared with the distribution observed for bulge field stars (small gray circles, from Johnson et al. 2014). The green line traces the LOWESS median line of the bulge star distribution, and the 1, 2, and 3 σ regions are also plotted with a different color shading. The right panel shows the distribution of the distances from the LOWESS median line measured for the bulge field stars (gray histogram) and the Liller 1 stars (orange histogram). The Gaussian function reproducing the bulge distribution is also shown as a black curve. |
Acknowledgements
This work is part of the project Cosmic-Lab at the Physics and Astronomy Department “A. Righi” of the Bologna University (http://www.cosmic-lab.eu/Cosmic-Lab/Home.html). C.F. and L.O. acknowledge the financial support by INAF within the VLT-MOONS project. A.M. and D.R. acknowledge support from the project “LEGO – Reconstructing the building blocks of the Galaxy by chemical tagging” (PI: A. Mucciarelli) granted by the Italian MUR through contract PRIN 2022LLP8TK_001.
References
- Alvarez, R., & Plez, B. 1998, A&A, 330, 1109 [NASA ADS] [Google Scholar]
- Alvarez Garay, D. A., Mucciarelli, A., Lardo, C., Bellazzini, M., & Merle, T. 2022, ApJ, 928, L11 [NASA ADS] [CrossRef] [Google Scholar]
- Alvarez Garay, D. A., Fanelli, C., Origlia, L., et al. 2024a, A&A, 686, A198 [NASA ADS] [CrossRef] [EDP Sciences] [Google Scholar]
- Alvarez Garay, D. A., Mucciarelli, A., Bellazzini, M., Lardo, C., & Ventura, P. 2024b, A&A, 681, A54 [NASA ADS] [CrossRef] [EDP Sciences] [Google Scholar]
- Bastian, N., & Pfeffer, J. 2022, MNRAS, 509, 614 [Google Scholar]
- Baumgardt, H., & Hilker, M. 2018, MNRAS, 478, 1520 [Google Scholar]
- Bekki, K., & Freeman, K. C. 2003, MNRAS, 346, L11 [Google Scholar]
- Bellini, A., Milone, A. P., Anderson, J., et al. 2017, ApJ, 844, 164 [NASA ADS] [CrossRef] [Google Scholar]
- Bournaud, F. 2016, Astrophys. Space Sci. Lib., 418, 355 [NASA ADS] [CrossRef] [Google Scholar]
- Bournaud, F. & Elmegreen, B. G. 2009, ApJ, 694, L158 [CrossRef] [Google Scholar]
- Cadelano, M., Pallanca, C., Dalessandro, E., et al. 2023, A&A, 679, L13 [NASA ADS] [CrossRef] [EDP Sciences] [Google Scholar]
- Callingham, T. M., Cautun, M., Deason, A. J., et al. 2022, MNRAS, 513, 4107 [NASA ADS] [CrossRef] [Google Scholar]
- Carretta, E., & Bragaglia, A. 2023, A&A, 677, A73 [NASA ADS] [CrossRef] [EDP Sciences] [Google Scholar]
- Carretta, E., Bragaglia, A., Gratton, R. G., et al. 2009, A&A, 505, 117 [NASA ADS] [CrossRef] [EDP Sciences] [Google Scholar]
- Carretta, E., Bragaglia, A., Gratton, R. G., et al. 2010, A&A, 516, A55 [NASA ADS] [CrossRef] [EDP Sciences] [Google Scholar]
- Ceccarelli, E., Mucciarelli, A., Massari, D., Bellazzini, M., & Matsuno, T. 2024, A&A, 691, A226 [NASA ADS] [CrossRef] [EDP Sciences] [Google Scholar]
- Crociati, C., Valenti, E., Ferraro, F. R., et al. 2023, ApJ, 951, 17 [NASA ADS] [CrossRef] [Google Scholar]
- Crociati, C., Cignoni, M., Dalessandro, E., et al. 2024, A&A, 691, A311 [NASA ADS] [CrossRef] [EDP Sciences] [Google Scholar]
- Dalessandro, E., Saracino, S., Origlia, L., et al. 2016, ApJ, 833, 111 [NASA ADS] [CrossRef] [Google Scholar]
- Dalessandro, E., Crociati, C., Cignoni, M., et al. 2022, ApJ, 940, 170 [NASA ADS] [CrossRef] [Google Scholar]
- Davis, M., Efstathiou, G., Frenk, C. S., & White, S. D. M. 1985, ApJ, 292, 371 [Google Scholar]
- Deras, D., Cadelano, M., Ferraro, F. R., Lanzoni, B., & Pallanca, C. 2023, ApJ, 942, 104 [CrossRef] [Google Scholar]
- Dorn, R. J., Anglada-Escude, G., Baade, D., et al. 2014, The Messenger, 156, 7 [NASA ADS] [Google Scholar]
- Dorn, R. J., Bristow, P., Smoker, J. V., et al. 2023, A&A, 671, A24 [NASA ADS] [CrossRef] [EDP Sciences] [Google Scholar]
- Elmegreen, B. G., Bournaud, F., & Elmegreen, D. M. 2008, ApJ, 688, 67 [NASA ADS] [CrossRef] [Google Scholar]
- Elmegreen, B. G., Elmegreen, D. M., Fernandez, M. X., & Lemonias, J. J. 2009, ApJ, 692, 12 [CrossRef] [Google Scholar]
- Fanelli, C., Origlia, L., Rich, R. M., et al. 2024, A&A, 690, A139 [NASA ADS] [CrossRef] [EDP Sciences] [Google Scholar]
- Ferraro, F. R., Montegriffo, P., Origlia, L., & Fusi Pecci, F. 2000, AJ, 119, 1282 [NASA ADS] [CrossRef] [Google Scholar]
- Ferraro, F. R., Sollima, A., Pancino, E., et al. 2004, ApJ, 603, L81 [NASA ADS] [CrossRef] [Google Scholar]
- Ferraro, F. R., Dalessandro, E., Mucciarelli, A., et al. 2009, Nature, 462, 483 [Google Scholar]
- Ferraro, F. R., Massari, D., Dalessandro, E., et al. 2016, ApJ, 828, 75 [NASA ADS] [CrossRef] [Google Scholar]
- Ferraro, F. R., Mucciarelli, A., Lanzoni, B., et al. 2018, ApJ, 860, 50 [NASA ADS] [CrossRef] [Google Scholar]
- Ferraro, F. R., Pallanca, C., Lanzoni, B., et al. 2021, Nat. Astron., 5, 311 [Google Scholar]
- Gaia Collaboration (Prusti, T., et al.) 2016, A&A, 595, A1 [NASA ADS] [CrossRef] [EDP Sciences] [Google Scholar]
- Gaia Collaboration (Vallenari, A., et al.) 2023, A&A, 674, A1 [NASA ADS] [CrossRef] [EDP Sciences] [Google Scholar]
- Genzel, R., Newman, S., Jones, T., et al. 2011, ApJ, 733, 101 [Google Scholar]
- Girardi, L., Bertelli, G., Bressan, A., et al. 2002, A&A, 391, 195 [NASA ADS] [CrossRef] [EDP Sciences] [Google Scholar]
- Gustafsson, B., Edvardsson, B., Eriksson, K., et al. 2008, A&A, 486, 951 [NASA ADS] [CrossRef] [EDP Sciences] [Google Scholar]
- Harris, W. E. 1996, AJ, 112, 1487 [Google Scholar]
- Helmi, A. 2020, ARA&A, 58, 205 [Google Scholar]
- Immeli, A., Samland, M., Gerhard, O., & Westera, P. 2004, A&A, 413, 547 [CrossRef] [EDP Sciences] [Google Scholar]
- Jeˇrábková, T., Hasani Zonoozi, A., Kroupa, P., et al. 2018, A&A, 620, A39 [NASA ADS] [CrossRef] [EDP Sciences] [Google Scholar]
- Johnson, C. I., & Pilachowski, C. A. 2010, ApJ, 722, 1373 [NASA ADS] [CrossRef] [Google Scholar]
- Johnson, C. I., Rich, R. M., Kobayashi, C., Kunder, A., & Koch, A. 2014, AJ, 148, 67 [Google Scholar]
- Kaeufl, H.-U., Ballester, P., Biereichel, P., et al. 2004, SPIE Conf. Ser., 5492, 1218 [NASA ADS] [Google Scholar]
- Khoperskov, S., Mastrobuono-Battisti, A., Di Matteo, P., & Haywood, M. 2018, A&A, 620, A154 [NASA ADS] [CrossRef] [EDP Sciences] [Google Scholar]
- Kobayashi, C., & Taylor, P. 2023, arXiv e-prints [arXiv:2302.07255] [Google Scholar]
- Kobayashi, C., Karakas, A. I., & Lugaro, M. 2020, ApJ, 900, 179 [Google Scholar]
- Lanzoni, B., Dalessandro, E., Ferraro, F. R., et al. 2007, ApJ, 668, L139 [NASA ADS] [CrossRef] [Google Scholar]
- Lanzoni, B., Ferraro, F. R., Dalessandro, E., et al. 2010, ApJ, 717, 653 [Google Scholar]
- Lanzoni, B., Mucciarelli, A., Origlia, L., et al. 2013, ApJ, 769, 107 [NASA ADS] [CrossRef] [Google Scholar]
- Libralato, M., Bellini, A., Vesperini, E., et al. 2022, ApJ, 934, 150 [NASA ADS] [CrossRef] [Google Scholar]
- Magg, E., Bergemann, M., Serenelli, A., et al. 2022, A&A, 661, A140 [NASA ADS] [CrossRef] [EDP Sciences] [Google Scholar]
- Marigo, P., Girardi, L., Bressan, A., et al. 2017, ApJ, 835, 77 [Google Scholar]
- Marino, A. F., Milone, A. P., Piotto, G., et al. 2009, A&A, 505, 1099 [CrossRef] [EDP Sciences] [Google Scholar]
- Massari, D., Mucciarelli, A., Dalessandro, E., et al. 2012, ApJ, 755, L32 [NASA ADS] [CrossRef] [Google Scholar]
- Massari, D., Mucciarelli, A., Ferraro, F. R., et al. 2014, ApJ, 795, 22 [NASA ADS] [CrossRef] [Google Scholar]
- Massari, D., Koppelman, H. H., & Helmi, A. 2019, A&A, 630, L4 [NASA ADS] [CrossRef] [EDP Sciences] [Google Scholar]
- Massari, D., Aguado-Agelet, F., Monelli, M., et al. 2023, A&A, 680, A20 [NASA ADS] [CrossRef] [EDP Sciences] [Google Scholar]
- Mastrobuono-Battisti, A., Khoperskov, S., Di Matteo, P., & Haywood, M. 2019, A&A, 622, A86 [NASA ADS] [CrossRef] [EDP Sciences] [Google Scholar]
- Matteucci, F., & Brocato, E. 1990, ApJ, 365, 539 [CrossRef] [Google Scholar]
- Matteucci, F., & Recchi, S. 2001, ApJ, 558, 351 [NASA ADS] [CrossRef] [Google Scholar]
- McKenzie, M., & Bekki, K. 2018, MNRAS, 479, 3126 [CrossRef] [Google Scholar]
- Mészáros, S., Masseron, T., Fernández-Trincado, J. G., et al. 2021, MNRAS, 505, 1645 [Google Scholar]
- Milone, A. P., Piotto, G., Renzini, A., et al. 2017, MNRAS, 464, 3636 [Google Scholar]
- Minelli, A., Mucciarelli, A., Massari, D., et al. 2021, ApJ, 918, L32 [NASA ADS] [CrossRef] [Google Scholar]
- Mucciarelli, A., Bellazzini, M., Ibata, R., et al. 2012, MNRAS, 426, 2889 [Google Scholar]
- Mucciarelli, A., Lapenna, E., Massari, D., et al. 2015, ApJ, 809, 128 [NASA ADS] [CrossRef] [Google Scholar]
- Mucciarelli, A., Massari, D., Minelli, A., et al. 2021, Nat. Astron., 5, 1247 [NASA ADS] [CrossRef] [Google Scholar]
- Neumayer, N., Seth, A., & Böker, T. 2020, A&A Rev., 28, 4 [NASA ADS] [CrossRef] [Google Scholar]
- Norris, J. E., Freeman, K. C., & Mighell, K. J. 1996, ApJ, 462, 241 [NASA ADS] [CrossRef] [Google Scholar]
- Origlia, L., & Rich, R. M. 2004, AJ, 127, 3422 [Google Scholar]
- Origlia, L., Ferraro, F. R., Fusi Pecci, F., & Oliva, E. 1997, A&A, 321, 859 [NASA ADS] [Google Scholar]
- Origlia, L., Rich, R. M., & Castro, S. 2002, AJ, 123, 1559 [Google Scholar]
- Origlia, L., Ferraro, F. R., Bellazzini, M., & Pancino, E. 2003, ApJ, 591, 916 [Google Scholar]
- Origlia, L., Valenti, E., & Rich, R. M. 2005, MNRAS, 356, 1276 [NASA ADS] [CrossRef] [Google Scholar]
- Origlia, L., Valenti, E., & Rich, R. M. 2008, MNRAS, 388, 1419 [NASA ADS] [Google Scholar]
- Origlia, L., Rich, R. M., Ferraro, F. R., et al. 2011, ApJ, 726, L20 [CrossRef] [Google Scholar]
- Origlia, L., Massari, D., Rich, R. M., et al. 2013, ApJ, 779, L5 [NASA ADS] [CrossRef] [Google Scholar]
- Origlia, L., Mucciarelli, A., Fiorentino, G., et al. 2019, ApJ, 871, 114 [NASA ADS] [CrossRef] [Google Scholar]
- Origlia, L., Ferraro, F. R., Fanelli, C., et al. 2025, arXiv e-prints [arXiv:2503.17258] [Google Scholar]
- Palla, M. 2021, MNRAS, 503, 3216 [Google Scholar]
- Pallanca, C., Ferraro, F. R., Lanzoni, B., et al. 2021a, ApJ, 917, 92 [NASA ADS] [CrossRef] [Google Scholar]
- Pallanca, C., Lanzoni, B., Ferraro, F. R., et al. 2021b, ApJ, 913, 137 [NASA ADS] [CrossRef] [Google Scholar]
- Pallanca, C., Leanza, S., Ferraro, F. R., et al. 2023, ApJ, 950, 138 [NASA ADS] [CrossRef] [Google Scholar]
- Pancino, E., Ferraro, F. R., Bellazzini, M., Piotto, G., & Zoccali, M. 2000, ApJ, 534, L83 [NASA ADS] [CrossRef] [Google Scholar]
- Pfeffer, J., Lardo, C., Bastian, N., Saracino, S., & Kamann, S. 2021, MNRAS, 500, 2514 [Google Scholar]
- Plez, B. 2012, Astrophysics Source Code Library [record ascl:1205.004] [Google Scholar]
- Romano, D., Matteucci, F., Tosi, M., et al. 2007, MNRAS, 376, 405 [Google Scholar]
- Romano, D., Karakas, A. I., Tosi, M., & Matteucci, F. 2010, A&A, 522, A32 [NASA ADS] [CrossRef] [EDP Sciences] [Google Scholar]
- Romano, D., Ferraro, F. R., Origlia, L., et al. 2023, ApJ, 951, 85 [NASA ADS] [CrossRef] [Google Scholar]
- Ryabchikova, T., & Pakhomov, Y. 2015, Balt. Astron., 24, 453 [Google Scholar]
- Saracino, S., Dalessandro, E., Ferraro, F. R., et al. 2015, ApJ, 806, 152 [NASA ADS] [CrossRef] [Google Scholar]
- Saracino, S., Dalessandro, E., Ferraro, F. R., et al. 2016, ApJ, 832, 48 [Google Scholar]
- Saracino, S., Dalessandro, E., Ferraro, F. R., et al. 2019, ApJ, 874, 86 [Google Scholar]
- Tacchella, S., Lang, P., Carollo, C. M., et al. 2015, ApJ, 802, 101 [NASA ADS] [CrossRef] [Google Scholar]
- Tolstoy, E., Hill, V., & Tosi, M. 2009, ARA&A, 47, 371 [Google Scholar]
- Valenti, E., Ferraro, F. R., & Origlia, L. 2007, AJ, 133, 1287 [Google Scholar]
- Valenti, E., Origlia, L., & Ferraro, F. R. 2005, MNRAS, 361, 272 [NASA ADS] [CrossRef] [Google Scholar]
- Valenti, E., Ferraro, F. R., & Origlia, L. 2010, MNRAS, 402, 1729 [NASA ADS] [CrossRef] [Google Scholar]
- Weiland, J. L., Arendt, R. G., Berriman, G. B., et al. 1994, ApJ, 425, L81 [NASA ADS] [CrossRef] [Google Scholar]
- White, S. D. M., & Rees, M. J. 1978, MNRAS, 183, 341 [Google Scholar]
Fundamental parameters of Galactic globular clusters, https://people.smp.uq.edu.au/HolgerBaumgardt/globular/
This scenario is also strongly disfavored by the fact that not a single GC as metal-rich as the supersolar population of Liller 1 is known in our Galaxy, since all Galactic GCs have [Fe/H]< 0 (see, e.g., Harris 1996).
All Tables
Coordinates, K-band magnitude, atmospheric parameters, radial velocity, and chemical abundances of the observed stars in Liller 1.
All Figures
|
Fig. 1 Position in Galactic longitude (l) and latitude (b) of the 17 star clusters (large red circles) selected as targets of the BulCO survey. They are all observed in the direction of the Galactic bulge. For reference, the blue lines represent the outline of the inner bulge as traced at 3.5 μm by COBE/DIRBE (Weiland et al. 1994). |
| In the text | |
|
Fig. 2 Spectroscopic targets (red squares) observed in Liller 1. Panel a: position of the targets in the plane of the sky with respect to the cluster center (marked with a cross). For the sake of reference, the two dashed circles mark the distances at 10′′ and 37′′ from the center. Panel b: target positions in the NIR CMD. Panel c: vector-point diagram of relative PMs determined from HST and adaptive optics observations. The red circle delimits the stars considered as likely cluster members in Dalessandro et al. (2022). Panel d: radial velocity of the 12 targets compared to the overall distribution of 244 stars measured in previous studies (Crociati et al. 2023; Alvarez Garay et al. 2024a; Fanelli et al. 2024). |
| In the text | |
|
Fig. 3 Region of the normalized spectra in the H (upper panel) and K (lower panel) bands obtained for star 300553. The most relevant lines for a few main elements are also marked. |
| In the text | |
|
Fig. 4 Metallicity distribution of the stars of Liller 1 obtained from recent surveys. Top panel: results of this work (from CRIRES+ at VLT), F24 (from NIRSPEC at Keck), and those of Alvarez Garay et al. (2024a, from X-shooter at VLT). Central panel: iron distribution obtained from MUSE at VLT by Crociati et al. (2023). Bottom panel: [Fe/H] distribution of the total sample obtained by combining the different datasets and counting 105 stars. |
| In the text | |
|
Fig. 5 [Ca/Fe], [Mg/Fe], and [Si/Fe] as a function of [Fe/H] for the 51 stars of Liller 1 measured so far. The values obtained from different surveys at high and medium spectral resolution are shown with different symbols. The red squares represent the 12 stars observed with CRIRES+ that we presented in this paper, the yellow triangles show the NIRSPEC sample (F24), and the green circles show the X-shooter sample (Alvarez Garay et al. 2024a). For reference, the dashed vertical and horizontal lines mark the solar values. |
| In the text | |
|
Fig. 6 Behavior of the average α−element abundance ratio [<Ca,Mg,O>/Fe] as a function of the metallicity ([Fe/H]) for the 51 stars observed so far in Liller 1 (large orange squares), compared with the distribution observed for bulge field stars (small gray circles, from Johnson et al. 2014). The green line traces the LOWESS median line of the bulge star distribution, and the 1, 2, and 3 σ regions are also plotted with a different color shading. The right panel shows the distribution of the distances from the LOWESS median line measured for the bulge field stars (gray histogram) and the Liller 1 stars (orange histogram). The Gaussian function reproducing the bulge distribution is also shown as a black curve. |
| In the text | |
Current usage metrics show cumulative count of Article Views (full-text article views including HTML views, PDF and ePub downloads, according to the available data) and Abstracts Views on Vision4Press platform.
Data correspond to usage on the plateform after 2015. The current usage metrics is available 48-96 hours after online publication and is updated daily on week days.
Initial download of the metrics may take a while.