Fig. 6
Download original image
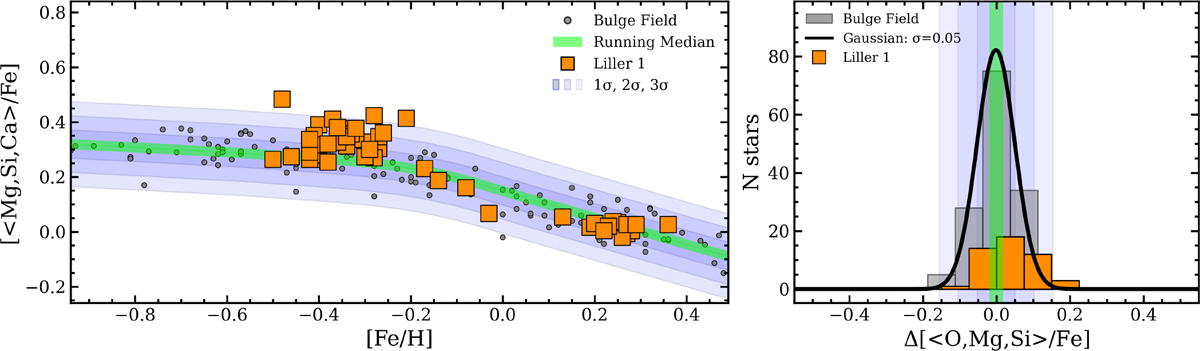
Behavior of the average α−element abundance ratio [<Ca,Mg,O>/Fe] as a function of the metallicity ([Fe/H]) for the 51 stars observed so far in Liller 1 (large orange squares), compared with the distribution observed for bulge field stars (small gray circles, from Johnson et al. 2014). The green line traces the LOWESS median line of the bulge star distribution, and the 1, 2, and 3 σ regions are also plotted with a different color shading. The right panel shows the distribution of the distances from the LOWESS median line measured for the bulge field stars (gray histogram) and the Liller 1 stars (orange histogram). The Gaussian function reproducing the bulge distribution is also shown as a black curve.
Current usage metrics show cumulative count of Article Views (full-text article views including HTML views, PDF and ePub downloads, according to the available data) and Abstracts Views on Vision4Press platform.
Data correspond to usage on the plateform after 2015. The current usage metrics is available 48-96 hours after online publication and is updated daily on week days.
Initial download of the metrics may take a while.