| Issue |
A&A
Volume 697, May 2025
|
|
|---|---|---|
| Article Number | A19 | |
| Number of page(s) | 9 | |
| Section | Galactic structure, stellar clusters and populations | |
| DOI | https://doi.org/10.1051/0004-6361/202452110 | |
| Published online | 30 April 2025 | |
The manifest link between Terzan 5 and the Galactic bulge
1
INAF, Osservatorio di Astrofisica e Scienza dello Spazio di Bologna,
Via Gobetti 93/3,
40129
Bologna,
Italy
2
Dipartimento di Fisica e Astronomia, Università degli Studi di Bologna,
Via Gobetti 93/2,
40129
Bologna,
Italy
★ Corresponding author: This email address is being protected from spambots. You need JavaScript enabled to view it.
Received:
4
September
2024
Accepted:
21
March
2025
Abstract
We address the chemical link between Terzan 5 (hereafter Ter5) and the Galactic bulge, as probed by the observed distributions of [α/Fe] abundance ratios with varying [Fe/H] and by suitable statistical tests to evaluate their significance. We also present a comprehensive review of the kinematic and evolutionary properties of Ter5, based on all the available observational signatures and the scenarios proposed so far in the literature for the formation and evolution of Ter5, as well as on the recent modelling of its star formation and chemical enrichment history. This analysis confirms the complex nature of this massive stellar system, with robust evidence of in situ bulge formation and of a subsequent evolution that cannot be simply explained by a single merging and/or accretion event of two globulars or a globular and a giant molecular cloud, as has been proposed in the literature, but it requires a more complex star formation likely accompanied by some self-enrichment.
Key words: techniques: spectroscopic / stars: abundances / stars: late-type / Galaxy: bulge / infrared: stars
© The Authors 2025
 Open Access article, published by EDP Sciences, under the terms of the Creative Commons Attribution License (https://creativecommons.org/licenses/by/4.0), which permits unrestricted use, distribution, and reproduction in any medium, provided the original work is properly cited.
This article is published in open access under the Subscribe to Open model. This email address is being protected from spambots. You need JavaScript enabled to view it. to support open access publication.
1 Introduction
The formation and early evolution of the Galactic bulge and, more generally, of galaxy bulges is a topic largely debated in the literature. Early (gas and stars) merging, friction of massive clumps, and proto-disc evaporation (e.g. Immeli et al. 2004; Dekel et al. 2009), and/or dynamical interactions with the central disc and bar (e.g. Gerhard & Martinez-Valpuesta 2012; Saha & Gerhard 2013) have been proposed in the literature. High-redshift observations of so-called ‘clumpy or chain galaxies’ (e.g. Elmegreen et al. 2009; Genzel et al. 2011; Tacchella et al. 2015) show the existence of massive clumps of gas and stars that plausibly provide the ‘set of initial conditions’ for the assembling process of galactic spheroids. In fact, numerical simulations (e.g. Immeli et al. 2004; Elmegreen et al. 2008; Bournaud & Elmegreen 2009; Bournaud 2016) show that such massive clumps (with masses of 108−109 M⊙) can form from violent disc instabilities in gas-rich galaxies, and/or by the clustering of smaller, seed clumps of 107−108 M⊙ (e.g. Behrendt et al. 2016) in a bottom-up scenario. They eventually migrate to the centre and coalesce in a dissipative way to generate the bulge. These models naturally provide short timescales (a few 108 years) for the bulge assembly, with intense star formation and chemical enrichment by type II supernova (SN) ejecta, leading to a metal-rich and α-enhanced stellar population, in agreement with the chemical abundances measured in the Galactic bulge (e.g. Johnson et al. 2014). In such a scenario, it is possible that some fragments from the pristine massive clumps survive the total disruption and evolve as independent stellar systems with the appearance of the massive globular clusters (GCs) in the inner regions of the host galaxy. At odds with genuine GCs, however, these fossil relics are expected to host multi-iron and multi-age sub-populations, because their progenitors could have been massive enough to retain the iron-enriched ejecta of SN explosions and likely experienced multiple bursts of star formation. Clearly, finding stellar systems with the predicted properties in the Galactic bulge would not only be of paramount importance for our understanding of the history of the Milky Way (MW), but would also provide a unique window on the formation of spheroids in general. Of course, the best systems to investigate for this purpose are bulge GCs.
Bulge GCs are remarkable in that they are massive and old, yet have survived in a dynamically harsh environment. Among all Galactic GCs, they are the least studied so far, especially because of the prohibitive conditions of high and differential reddening, combined with high stellar crowding, which are found along their line of sight. Over the last few decades, we have been engaged in a long-term project aiming to characterize the structure, age, kinematics, and detailed chemical composition of bulge GCs using VLT, Keck, Gemini, and HST instrument facilities (Origlia et al. 2002, 2005, 2008; Origlia & Rich 2004; Valenti et al. 2007, 2010, 2011, 2015; Saracino et al. 2015, 2016, 2019; Pallanca et al. 2019, 2021, 2023; Cadelano et al. 2020, 2023; Dalessandro et al. 2022; Deras et al. 2023; Leanza et al. 2023).
The most striking result was the discovery that Ter5, commonly catalogued as a GC of the inner bulge and affected by large and differential reddening (Valenti et al. 2007; Massari et al. 2012), is actually a complex stellar system with subpopulations of significantly different metallicities and ages. In particular, adaptive optics imaging with VLT-MAD and some spectroscopy with Keck-NIRSPEC in the near IR (Ferraro et al. 2009) revealed two distinct red clumps in the colour-magnitude diagram (CMD) with very different iron abundances ([Fe/H] = −0.2 and +0.3 dex, respectively) and likely significantly different ages, later confirmed by the detection of two distinct main-sequence turnoff points that provided ages of 12 Gyr for the (dominant) sub-solar component and 4.5 Gyr for the super-solar one (Ferraro et al. 2016). The true nature of Ter5 has become even more intriguing after the discovery that a second massive stellar system in the Galactic bulge, namely Liller 1, hosts two main distinct sub-populations (Ferraro et al. 2021) with remarkably different ages and metalllicities: a ∼12 Gyr old sub-population with sub-solar metallicity has been found to cohabit with at least one additional component showing an age of just 1–2 Gyr and a super-solar iron abundance; as in Ter5 (see Lanzoni et al. 2010), the youngest and most metal-rich sub-population is more centrally concentrated than the other(s). These peculiar properties unambiguously probe that Ter5 and Liller 1 are not genuine GCs, and call for more complex formation scenarios.
In this paper, we first critically review the kinematic and chemical properties of the Ter5 stellar sub-populations from the studies published so far in the literature after the Ferraro et al. (2009) discovery of its complex nature, and the proposed scenarios for its formation and evolution. Then, we focus the discussion on the chemical link between Ter5 and the bulge, since it is of crucial importance to constrain the in situ formation hypothesis, by presenting a new, comprehensive statistical analysis of suitable chemical abundance pattern distributions from different high-resolution spectroscopic surveys, including the Apache Point Observatory Galactic Evolution Experiment (APOGEE; Majewski et al. 2017). Finally, we summarize the current view of Ter5, also based on recent modelling of its star formation and chemical enrichment history, and we briefly address the remaining open questions and future perspectives.
2 Properties of Ter5 stellar sub-populations
The chemistry of Ter5 stars has been characterized in some detail through a rather massive spectroscopic follow-up in both the NIR and the optical bands. From the analysis of high-resolution Keck-NIRSPEC spectra in the H-band, we measured the abundances of Fe, C, O, and a few other α and light elements for almost 40 giant stars (Origlia & Rich 2004; Origlia et al. 2011, 2013). From VLT-FLAMES and Keck-DEIMOS spectra in the Ca-T region, we obtained Fe abundances for more than 100 giants that are likely members of the system (Massari et al. 2014a), and another 100 in a surrounding control field (Massari et al. 2014b). The Ter5 membership of these stars has been established based on their radial velocities (RVs). For a sub-sample of them, it has been also confirmed by proper motion measurements (Massari et al. 2015). The resulting metallicity distribution of Ter5 has revealed the presence of two main peaks at sub-solar and super-solar iron abundances ([Fe/H] ∼−0.3 dex and ∼+0.3 dex, respectively), and an additional, minor component at [Fe/H] ≈−0.8 dex, bringing the overall metallicity range covered by the system to approximately 1 dex. The metal-poor sub-populations of Ter5 are α-enhanced ([α/Fe] ∼+0.3 dex) and likely formed early and quickly from a gas evidently polluted by a large number of type II SNe. The young, metal-rich sub-population, which is more centrally concentrated, has an approximately solar-scaled [α/Fe] abundance ratio, requiring a progenitor gas further polluted by both type II and Ia SNe on a longer timescale. Although Pfeffer et al. (2021) suggested that the most metal-poor stars (with [Fe/H] ≃−0.8 dex) may have been accreted from the surroundings, Massari et al. (2014b) showed that this component (1) is not negligible (indeed, after statistical decontamination from the Galactic contribution, it amounts to ≈6% of the whole Ter5 population, while field stars are significantly more marginal: ≈3%; see also Massari et al. 2014a), and (2) appears to be centrally concentrated similarly to the main sub-population, making the accretion hypothesis somewhat unlikely. It is also worth mentioning that the Ter5 membership of these metal-poor stars has been established from both their RVs and their HST proper motions (Massari et al. 2015).
More recently, we also measured the chemical abundances of nine variable stars (three newly discovered RR Lyraes and six known Miras) from VLT-XSHOOTER NIR spectra (Origlia et al. 2019). The three RR Lyraes have RVs and proper motions (Massari et al. 2015) that are fully consistent with them being Ter5 members. Their [Fe/H] ≈−0.7 dex and [α/Fe] enhancement nicely matches the chemistry of the most metal-poor sub-population of the system, and thus directly supports an old age for this component. The three short-period (P<300 days) Miras also have RVs that are consistent with them being members of Ter5 and show [Fe/H] ≈−0.3 dex, enhanced [α/Fe], and a mass consistent with an old age, corresponding well to the main, 12 Gyr-old and sub-solar component of Ter5. Only one of the three long-period (P>300 days) Miras turned out to likely belong to the system. It displays a super-solar iron abundance, solar-scaled [α/Fe], and a mass consistent with it being several gigayears younger than the old, short-period Miras, and thus nicely matches the properties of the young, metal-rich subpopulation. Based on these results, the metallicity distribution of Ter5 closely resembles the one of the surrounding bulge field (Massari et al. 2014a,b), although it is somehow more peaked around the two main sub-populations. The [α/Fe] versus [Fe/H] distribution drawn by the different components of Ter5 (Origlia et al. 2011, 2013), with a typical knee occurring at an almost solar metallicity, implying a very high star formation rate, also fully matches the corresponding bulge distribution (e.g. Johnson et al. 2014, and references therein), while it is at odds with those of the other MW substructures (i.e. thin and thick discs and halo) or with those of satellite galaxies in the Local Group (see e.g. Matteucci & Brocato 1990; Tolstoy et al. 2009).
Among the formation scenarios proposed so far in the literature for Ter 51, the possibility that it could be the former nuclear star cluster of an accreted dwarf galaxy (Brown et al. 2018; Alfaro-Cuello et al. 2019) can be discarded on the basis of several arguments. First, the age-metallicity relation of Ter5 turns out to be consistent with the MW’s enrichment (e.g. Snaith et al. 2015; Kruijssen et al. 2019), providing evidence of a Galactic origin of the system. Second, the reconstruction of the Ter5 orbit from the measured RVs and proper motions (Massari et al. 2015, 2019; Vasiliev & Baumgardt 2021) leads to an apocentre of just 2.8 kpc, which confines the system well within the bulge and therefore points to an in situ formation. In addition, as is also discussed in Pfeffer et al. (2021), the accretion scenario would require (1) a host galaxy with a mass similar to the MW one in order to have a nuclear star cluster with a metallicity consistent with that of Ter5 and of the MW nuclear star cluster (Rich et al. 2017; Feldmeier-Krause et al. 2017), and (2) a major merger that has occurred within approximately the last 4 Gyr (i.e. more recent than the age of the youngest sub-population in Ter5), for which there is no evidence in the MW (indeed, our galaxy seems to have escaped any significant merger over the last 10 Gyr; see e.g. Hammer et al. 2007; Helmi et al. 2018; Fragkoudi et al. 2020, and references therein).
Consistently with an in situ origin and evolution of Ter5, the possibilities of a merger between two GCs (Khoperskov et al. 2018; Mastrobuono-Battisti et al. 2019; Pfeffer et al. 2021; Ishchenko et al. 2023) or the accretion of a giant molecular cloud by a genuine GC (McKenzie & Bekki 2018; Bastian & Pfeffer 2022) have been proposed in the literature. However, both the old, sub-solar component and the younger, super-solar population of Ter5 are very massive, reaching about 106 M⊙ (Lanzoni et al. 2010), exceeding the mass of the largest Galactic GCs, such as 47 Tucanae (Harris 1996) and NGC 6388 (Lanzoni et al. 2007). Moreover, the super-solar component is significantly younger and more metal-rich than any Galactic globular and significantly more massive than any Galactic open cluster. Finally, the observed metallicity distribution (e.g. Massari et al. 2014b) and the reconstructed star formation history of the system (Crociati et al. 2024) indicate the presence of at least three sub-populations and/or a prolonged star formation, which cannot be accounted by a single merging event.
In this respect, chemical models specifically computed for Ter5 (Romano et al. 2023) have demonstrated that the self-enrichment of a progenitor of a few 107 solar masses can nicely reproduce all the observed chemical patterns. The other intriguing characteristics of Ter5 are its large population of millisecond pulsars (MSPs), which accounts for about 25% of the entire MSP population found so far in Galactic GCs (Ransom et al. 2005; Cadelano et al. 2018; Padmanabh et al. 2024), and its surprisingly large collision rate (the largest among all Galactic GCs Verbunt & Hut 1987; Lanzoni et al. 2010).
The picture proposed by our group (Ferraro et al. 2016) is that Ter5 (like Liller 1; Ferraro et al. 2021; Dalessandro et al. 2022; Fanelli et al. 2024) may be the relic of a pristine massive (a few ∼ 107 solar masses) clump of gas and stars of the early bulge that survived total disruption and evolved independently, likely experiencing multiple episodes of star formation and self-enrichment. This is consistent with the evidence of an in situ origin, the large estimated masses of its sub-populations, and the highest central concentration of the more metal-rich component. It can also accommodate the presence of multiple sub-populations and Ter5’s complex chemical evolution (Romano et al. 2023) and star formation history.
3 The chemical link between Ter5 and the bulge
The chemical, kinematic, and evolutionary properties of Ter5 discussed in the literature and summarized in Sect. 2 consistently support the in situ bulge formation and evolution of Ter5. However, Taylor et al. (2022) question such evidence by means of a chemical study based on APOGEE spectra of five to seven giant candidate members of Ter5, whose abundance patterns are claimed to show some deviation from the bulge distribution. In order to shed new light on this issue and characterize the chemical properties of Ter5 stellar sub-populations and their possible link with the bulge on a more quantitative ground, we performed a few statistical tests on the Ter5 and bulge distributions of suitable element abundances and abundance ratios, namely [Si/Fe], [Ca/Fe], [Mg/Fe], [O/Fe], and the average [<Ca, Si, Mg, O>] (hereafter, [α/Fe]) trends with [Fe/H]. [α/Fe] versus [Fe/H] distributions are indeed primary indicators of the chemical enrichment history of a given stellar system, being α-elements and iron synthesized in stars with different masses and thus released to the interstellar medium on different timescales. We have used two different sets of measurements:
dataset #1: abundances from high-resolution optical and NIR spectroscopy of bulge field (Johnson et al. 2014; Rich & Origlia 2005; Rich et al. 2007, 2012) and Ter5 (Origlia & Rich 2004; Origlia et al. 2011, 2013) giants. As a control sample of halo and disc stars we used the homogeneous compilation by Bensby et al. (2014). The quoted abundances have been re-scaled to be placed on the common solar reference scale of Magg et al. (2022). Table 1 reports the corresponding scaling factors for the chemical elements under study.
dataset #2: abundances from APOGEE spectroscopy of bulge field stars and of a control sample of halo-disc stars from the APOGEE allStarLite-dr17-synspec-rev1.fits catalog2, and of Ter5 giants from the compilation of Schiavon et al. (2024), which also include those discussed in Taylor et al. (2022).
Scaling factors to the Magg et al. (2022) solar reference abundances.
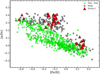 |
Fig. 1 Average [<Ca, Si, Mg, O>/Fe] (i.e. [α/Fe]) trends with [Fe/H] of the bulge (grey dots), halo-disc (green squares), and Ter5 (red triangles) stars from dataset #1 (see Sect. 3). |
3.1 Abundance ratio trends from dataset #1
The distribution of the average [α/Fe] abundance ratio with [Fe/H] for the Ter5 sample (40 stars) and for the bulge (about 200 stars) and halo-disc (about 700 stars) control samples from dataset #1 is plotted in Fig. 1. A qualitative agreement between the Ter5 and the bulge distributions and a significant discrepancy with the halo-disc one can be noticed.
Hence, in order to evaluate on a more quantitative ground the possible chemical link between Ter5 and the bulge, we then modelled the [Ca/Fe], [Si/Fe], [Mg/Fe], and [O/Fe], and the average [α/Fe] distributions with [Fe/H] of the bulge stars with a locally weighted scatter plot smoothing3 (LOWESS) function, which is a non-parametric regression technique to obtain an optimal median curve. This methodology involves the selection of a suitable window of neighbouring points around each point in the dataset, assigning weights (according to their distance from the selected one) and fitting a local regression function within that window.
In order to compute the dispersion of the observed distributions around their LOWESS median function, we used both a boostrapping technique and a maximum-likelihood method assuming a Gaussian distribution. Since results are very similar with both methods, with minor (if any) asymmetries above and below the LOWESS curve and across the sampled [Fe/H] range, we adopted a single Gaussian dispersion value for each analyzed distribution. We found 1σ values in the 0.05–0.1 dex range. It is worth noticing that these Gaussian dispersions are also fully consistent (within 0.01 dex) with the corresponding standard deviations of the observed distributions. We then compared the bulge distributions with the corresponding ones of Ter5. By comparing the abundance distributions of bulge stars from Johnson et al. (2014) and Rich & Origlia (2005); Rich et al. (2007, 2012) optical and NIR datasets, respectively, we estimated that possible systematics (differences in the median values) between the two analysis are well within 0.1 dex for the chemical elements under study. Since the Ter5 dataset from Origlia & Rich (2004); Origlia et al. (2011, 2013) used the same NIR spectroscopy and analysis of Rich & Origlia (2005); Rich et al. (2007, 2012), one can expect similar systematics between Johnson et al. (2014) and Ter5 datasets.
Figure 2 shows the [Si/Fe], [Ca/Fe], [Mg/Fe], [O/Fe] and the average [<Ca, Si, Mg, O>/Fe] trends with [Fe/H] of the bulge and Ter5 stars from dataset #1 (left panels) and the corresponding distributions of the differences between the Ter5 values and the corresponding running LOWESS median curve ones (right panels). As can be appreciated, all the measured stars in Ter5 are located within 3σ of the bulge distributions, the vast majority (between 80 and 100%) within 2σ and a significant fraction (always exceeding 30% and up to almost 90%) within 1σ. Such statistics should be only marginally (if at all) affected by the possible systematics between the bulge and Ter5 datasets mentioned above, since such systematics are always smaller than the 1σ values of the distributions.
We finally provide an estimate of the probability that Ter5 stars belong to either the bulge or the halo-disc. To this purpose, we employed a kernel density estimator (KDE) to model the density probability of the control samples (either the bulge or the halo-disc) in four dimensions – [O/Fe], [Mg/Fe], [Si/Fe], and [Ca/Fe] – and in the same [Fe/H] range covered by Ter5 stars (i.e. between approximately −1.0 and +0.5 dex). Then, we estimated the probability that the target sample belongs to each control sample using a likelihood function derived from the KDEs and also taking into account the errors of the abundance measurements. These probabilities were then normalized as follows.
Pnorm[bulge] = P[bulge]/(P[bulge] + P[halo-disc])
Pnorm [halo-disc] = P[halo-disc]/(P[bulge]+P[halo-disc]).
In order to verify the ground truth of the adopted procedure, we used a bootstrap technique with 1000 random extractions of a number of stars equal to the size of the Ter5 sample from one control sample and we evaluated the probability that they belong to the other control sample. For dataset #1, we extracted 1000 times 40 stars from the bulge and halo-disc control samples and we obtained a similar probability of less than 2% that they belong to the other sample. The inferred probability that the Ter5 stars globally belong to the bulge sample is 100% (median value) or 99.7% (weighted mean with a standard deviation of 5%). We also computed the values separately for the sub-solar (27 stars) and super-solar (13 stars) components of Ter5, finding probabilities of 100 and 94% that they belong to the corresponding bulge sub-solar and super-solar sub-samples, respectively.
3.2 Abundance ratio trends from dataset #2
The selection of the APOGEE bulge star sample by Taylor et al. (2022) was distance-based, assuming a spherical bulge with a radius of 4 kpc. Although we verified that the resulting distributions at least qualitatively are very similar, we preferred to use somewhat different criteria, namely: |l|<20∘,|b|<10∘, where l and b are the Galactic longitude and latitude, respectively, to properly sample the barred, peanut-shaped bulge; <0.25 kpc−1 positive parallaxes, to clean the sample from the most obvious foreground stars; Teff < 5000 K and log (g) < 2.8 dex, to sample the giant stars down to the red clump; and ASPCAPFLAG = 0, to include only the stars with good spectra and reliable abundances.
The above selection provided us with a sample amounting to almost 16 000 giant stars in the direction of the Galactic bulge. We did not apply any further selection to the parallax and/or parallax error, since it is very likely that bulge stars, especially those in the inner region, have very uncertain Gaia measurements of these quantities (if any), due to the high reddening (thus implying faint G-magnitudes) and crowding in that direction. We also selected a similar control sample of about 17 000 giant halo-disc stars within 1.3 kpc of the Sun.
Concerning Ter5, we used the recent compilation by Schiavon et al. (2024), which counts 20 stars towards this stellar system with FE_H_FLAG = 0 (i.e. with reliable iron abundances) and Gaia EDR3 proper motions within the confidence radius of 2.7 mas yr−1 quoted by Taylor et al. (2022). These stars have heliocentric RVs between −116 and −36.4 km s−1, which is generously consistent with the Ter5 systemic value of about −82 km s−1, and a dispersion of ≤10 km s−1 at radial distances ≥2 arcmin (see Baumgardt & Hilker 2018, and references therein)4. This sample also includes the seven stars analyzed by Taylor et al. (2022).
Figure 3 shows the distribution of the stars towards Ter5 projected on the sky, their Gaia DR3 proper motions, and the 2MASS CMD. Among the 20 stars in the Ter5 compilation by Schiavon et al. (2024) with proper motions within the confidence radius, only 12 are within the Jacobi radius of 25.37′ quoted by Taylor et al. (2022), and only 6 are within the tidal radius of 4.6′ quoted by Lanzoni et al. (2010), while the remaining 8 stars outside the Jacobi radius are very likely field stars.
From the distribution of 1500 RVs measured out to 13′ from the centre (Ferraro et al. 2025), we estimate that the probability of observing a giant star member of the system at distances larger than 5′ is only a few percent. Nevertheless, to maintain an overall consistency with the assumptions made by Taylor et al. (2022), we still considered members of Ter5 those stars from dataset #2 that are within the Jacobi radius adopted by Taylor et al. (2022).
Ter5 member stars from the APOGEE sample.
Locations within the Jacobi radius and proper motions within the confidence radius are not sufficient to unequivocally identify Ter5 member stars. Indeed, among the six stars located between the tidal and the Jacobi radius, three have (J-K) colours that are significantly bluer (by at least half a magnitude) than the stars within the tidal radius, too blue to be explained in terms of differential reddening, and hence they are likely foreground stars. Two of these, likely foreground stars, are also in the Taylor et al. (2022) sample. Thus, in the following, we have conservatively assumed nine candidate members of Ter5 (see Table 2), the six black stars and the three filled red triangles in Fig. 3; that is, the stars lying within the Jacobi radius (dashed circle in the left panel of Fig. 3), the proper motion confidence radius (solid circle in the middle panel of Fig. 3) and the Ter5 red giant branch locus (the solid box in the right panel of Fig. 3). As can be seen in Table 2, among these nine candidates, one star lacks a measurement of the Ca abundance.
Figure 4 shows the [O/Fe], [Mg/Fe], [Si/Fe], [Ca/Fe] and the average [<O, Mg, Si, Ca>/Fe] trends with [Fe/H] of the bulge and Ter5 stars from dataset #2 (left panels) and the corresponding distributions of the differences between the Ter5 values and the corresponding LOWESS median ones (right panels). It is interesting to note that the three most metal-rich stars in the sample (filled red triangles in Fig. 4) are located in the outer regions of Ter5 (see middle panel of Fig. 3). Also, the two most metal-rich ones have RVs that are 3–5σ from the systemic, which is barely consistent with membership, given also that this super-solar sub-population, if truly a member of Ter5, should be centrally concentrated (see Ferraro et al. 2009; Lanzoni et al. 2010).
Similarly to what was found from dataset #1, the likely Ter5 member stars from the APOGEE sample (black stars and possibly red triangles in Fig. 4) are located well within 2σ of the bulge distributions, with the only exception being one star at [Fe/H] = −0.12 that shows some more discordant (between 2 and 5σ) abundance ratios. This star has ASPCAPFLAGS = COLORTE_WARN, indicating some discrepancy between the spectroscopic and colour temperatures. Interestingly, five out of eight stars of Ter5 have average [α/Fe] values that match those of the bulge distribution within 1σ, almost coinciding with the median curve.
Although this Ter5 sample of stars is barely representative of such a complex stellar system, for the sake of consistency with what was done for dataset #1, we also computed the probability that the eight Ter5 stars, with measurements for all four α-elements, belong to the bulge sample, finding values of 93 (median) or 98% (weighted mean with a standard deviation of 9%).
Thus, our analysis demonstrates that the Ter5 APOGEE sample, although quite small in size, also turns out to have a chemistry that is fully compatible with the one of the Galactic bulge at a 2σ level, and somewhat in contrast with the conclusion by Taylor et al. (2022) that their abundance patterns differ to a reasonable degree of statistical significance.
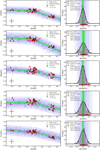 |
Fig. 2 Chemical abundance ratio distributions of the bulge field and Ter5 stars from dataset #1 (see Sect. 3.1). Left panels: [Si/Fe], [Ca/Fe], [Mg/Fe], [O/Fe], and the average [<Ca, Si, Mg, O>/Fe] (i.e. [α/Fe]) trends with [Fe/H] of the bulge field (grey dots) and Ter5 (red triangles) stars. The running LOWESS median curves at 95% confidence (thick green lines) and 1, 2, 3σ shaded regions are also plotted, together with the typical measurement error bars. Right panels: corresponding distributions of the differences with the LOWESS median curve values. |
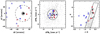 |
Fig. 3 Diagnostic diagrams for target selection. Left panel: spatial map projected on the sky of the Ter5 stars from the compilation by Schiavon et al. (2024), referred to its centre at RA = 263∘.3523333, Dec = −33∘.3895556. The solid black circle has the tidal radius of 4.6′ quoted by Lanzoni et al. (2010); the dashed black circle has the Jacobi radius of 25.37′ quoted by Taylor et al. (2022). Middle panel: Gaia DR3 proper motions referred to the systemic values of Ter5 quoted by Vasiliev & Baumgardt (2021) for the Ter5 and the bulge field stars within the tidal radius. The solid black circle has the proper motion confidence radius of 2.7 mas yr−1 quoted by Taylor et al. (2022). Right panel: corresponding 2MASS CMD for the stars in the middle panel with proper motions within the confidence radius. The black rectangle delimits the Ter5 giant branch sequences. In all panels, the symbols are as follows: grey dots for stars within the tidal radius, black stars for APOGEE Ter5 stars within the tidal radius, filled triangles for APOGEE stars within the Jacobi radius, and empty triangles for stars outside it. Blue triangles mark stars with J - K colours significantly bluer than those of Ter5 giants, and hence likely foreground stars, while red triangles mark stars with J-K colours consistent with those of Ter5 giants. |
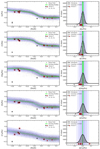 |
Fig. 4 APOGEE DR17 chemical abundance ratio distributions of the bulge field and Ter5 stars from dataset #2 (see Sect. 3.2). Left panels: [Si/Fe], [Ca/Fe], [Mg/Fe], and [O/Fe], and the average [α/Fe]) trends with [Fe/H] of the bulge field (grey dots) and Ter5 (black stars and red triangles) stars. Black stars refer to Ter5 members within the tidal radius of 4.6′ quoted by Lanzoni et al. (2010), while red triangles mark stars outside 4.6′ and within the Jacobi radius of 25.4′ quoted by Taylor et al. (2022). The black stars circled in red are in common with Taylor et al. (2022). The running LOWESS median curves at 95% confidence (thick green lines) and 1, 2, 3σ shaded regions are also plotted, together with the typical measurement error bars. Right panels: corresponding distributions of the differences with the LOWESS median curve ones. |
3.2.1 The Taylor et al. (2022) analysis
Taylor et al. (2022) question the chemical link between Ter5 and the bulge based on the analysis of five to seven giant stars, candidate members of Ter5, observed with APOGEE. They adopt a random sampling technique and conclude that the median abundance ratios, computed from the corresponding values measured in those seven stars, are statistically different from the median curves drawn by their bulge counterparts. However, some considerations about the suitability of the applied statistical analysis are worth being made.
The small 95% confidence intervals of the running median curves derived by Taylor et al. (2022, see their Figs. 3 and 4 and discussed in their Sect. 3.1) are the errors of these median curves, while the spreads (σ) of the distributions are clearly significantly larger. The two quantities should not be confused. Indeed, for the bulge sample, we also computed the 95% confidence errors of the running LOWESS median curves (corresponding to the thickness of the solid green lines in Fig. 4) via a bootstrapping technique, as was done by Taylor et al. (2022), and we consistently found small values, significantly smaller than the spreads of the distributions, implying that only a rather small fraction (i.e. as small as 8 and up to 27% at most) of the bulge stars are located within those limits, the large majority of them being much more spread around the median curves. Hence, the similarity between Ter5 and the bulge cannot be assessed on the basis of their coincidence with the median curves; otherwise, one should also illogically conclude that the large majority of the bulge stars are not part of the ‘bulge’. It should be evaluated according to the spreads of the distributions, as is reported in Sects. 3.1 and 3.2.
Taylor et al. (2022) also performed a statistical test based on the comparison of the median values of the [X/Fe] abundance ratios, computed for the small number of Ter5 stars and for an equivalent small number of stars randomly extracted (using a bootstrapping technique) from the bulge distribution. By construction, this test seems inadequate to probe Ter5’s chemistry and its consistency with the one of the bulge for at least the following main reasons: (i) a unique median value of [X/Fe], regardless of star metallicity (and likely age), cannot be representative of the complex multi-age, multi-iron, and multi-[α/Fe] stellar sub-populations of Ter5 (and also of the bulge); (ii) a median value is also poorly representative of the global properties of distributions that are quite scattered around that value, as is the case for the bulge and likely also for Ter5; (iii) the size of the Ter5 sample is definitely too small (five stars in total, given that the other two in their sample are likely foreground stars because of their colours being too blue (see Sect. 3.2) for any statistical variable to be robustly and safely predictive; and (iv) this test can only provide information (if any) on the similarity between Ter5 and the median bulge curves, not between Ter5 and the bulge distributions. Hence the Taylor et al. (2022) conclusion that the chemistry of Ter5 is not consistent with that of the Galactic bulge ‘at statistically significant levels’ does not seem appropriate.
4 Discussion and conclusions
The results of the statistical tests performed on the Ter5 chemical distributions (see Sect. 3.1 and 3.2) consistently point to a chemical link between Ter5 and the bulge and to a bulge in situ formation and evolution, in full agreement with the kinematic and evolutionary findings (see Sect. 2). However, in this respect, it is worth mentioning that Ter5 and the bulge chemical patterns do not have to be strictly identical to probe an in situ formation and evolution of Ter5. Indeed, the currently available bulge field distributions are traced by stars spread over regions that are several degrees wide, often mostly on the bulge’s outskirts, and much larger than the sub-degree extension (projected on sky) of bulge stellar sub-systems like Ter5, and that thus only provide chemical information averaged over large scales without properly accounting for possible gradients and/or inhomogeneities on smaller scales. In addition, Ter5 is much denser than the field and potentially only a fragment of the early bulge that may have evolved and self-enriched as an independent sub-system with its own history, not necessarily identical to the one traced by an ‘average’ bulge. Hence as a matter of fact, some deviations from the average bulge trends of specific abundance patterns in Ter5 stars should not be a surprise, possibly unveiling some peculiarities in Ter5’s evolution.
In summary, all of the observational facts collected so far on Ter5 have provided robust evolutionary, kinematic, and chemical evidence of an in situ bulge formation and evolution for this stellar system. Also, as is discussed in Sect. 2 its multiage, multi-iron, and multi [α/Fe] stellar populations cannot be explained in terms of a single merging and/or accretion event of two simple sub-structures, like two globulars or a globular and a giant molecular cloud. In order to better account for its complexity, we thus made the working hypothesis that Ter5 might be the relic of a more massive pristine sub-structure of the early bulge that survived total disruption and evolved independently, likely experiencing different episodes of star formation and self-enrichment. This scenario is further supported by the chemical evolution model recently proposed by Romano et al. (2023), who have shown that a 4 × 10⁷ M⊙ clump (i.e almost three orders of magnitude less massive than the bulge; see e.g. Valenti et al. 2016) can fully reproduce the Ter5 chemical abundance patterns, without the need to invoke a massive (i.e. nearly the mass of the bulge Taylor et al. 2022) and dark-matter-dominated protosystem for the occurrence of self-enrichment, as is generally believed.
The possible sequence of star formation events able to reproduce the Ter5 evolutionary properties in a self-enriching scenario has recently been reconstructed (Crociati et al. 2024). An optimal match to the differential reddening and proper-motion-cleaned observed CMD can be obtained by means of synthetic CMDs that assume a complex star formation history, foreseeing an old main episode that occurred between 12 and 13 Gyr ago and generated ∼70% of the current stellar mass (this estimate is fully in agreement with the one reported by Ferraro et al. 2009; Lanzoni et al. 2010), followed by an extended lower-rate star formation activity that lasted for several gigayears with one, or possibly two, main additional bursts, the most recent one occurring approximately 4 Gyr ago (in agreement with the age measured by Ferraro et al. 2016).
The proposed scenario also offers a natural explanation for the surprisingly large population of MSPs in Ter5. In fact, the massive Ter5 progenitor could have retained the ejecta and remnants of the large number (104) of type II SN explosions that characterized its chemical evolution (Romano et al. 2023), producing since the early stages of its evolution the required large populations of neutron stars (NSs). The exceptionally large collision rate of Ter5 Verbunt & Hut (1987); Lanzoni et al. (2010) favoured the recycling of (at least) a fraction of this huge population of NSs, generating the large population of MSPs observed today.
At the moment, the described scenario seems the most plausible one, since it takes into account all of the observational facts currently known about Ter5. Additional information on the detailed chemistry of the sub-populations of Ter5 is expected in the near future. In fact, high-resolution spectroscopic observations for an additional large sample of giant stars of Ter5 are going to be completed at the ESO-VLT with the spectrograph CRIRES+, in the context of the ‘The Bulge Cluster Origin’ (BulCO) survey (Ferraro et al. 2025), a large programme specifically aiming to measure accurate chemical abundances for the most important elements in a statistically significant sample of massive clusters of the Galactic bulge, and thus provide the chemical signatures to unveil their origin and evolution.
Acknowledgements
L.O. and C.F. acknowledge the financial support by INAF within the VLT-MOONS project. D.M. acknowledges financial support from the European Union – NextGenerationEU RRF M4C2 1.1 n: 2022 HY 2 NSX. “CHRONOS: adjusting the clock(s) to unveil the CHRONO-chemo-dynamical Structure of the Galaxy” (PI: S. Cassisi). This work is part of the project CosmicLab at the Physics and Astronomy Department “A. Righi” of the Bologna University (http://www.cosmic-lab.eu/Cosmic-Lab/Home.html).
References
- Alfaro-Cuello, M., Kacharov, N., Neumayer, N., et al. 2019, ApJ, 886, 57 [Google Scholar]
- Alvarez Garay, D. A., Fanelli, C., Origlia, L., et al. 2024, A&A, 686, A [Google Scholar]
- Asplund, M., Grevesse, N., Sauval, A. J., & Scott, P. 2009, ARA&A, 47, 481 [NASA ADS] [CrossRef] [Google Scholar]
- Bastian, N., & Pfeffer, J. 2022, MNRAS, 509, 614 [Google Scholar]
- Baumgardt, H., & Hilker, M. 2018, MNRAS, 478, 1520 [Google Scholar]
- Baumgardt, H., Hilker, M., Sollima, A., & Bellini, A. 2019, MNRAS, 482, 5138 [Google Scholar]
- Behrendt, M., Burkert, A., & Schartmann, M. 2016, ApJ, 819, L [Google Scholar]
- Bensby, T., Feltzing, S., & Oey, M. S. 2014, A&A, 562, A [Google Scholar]
- Bournaud, F. 2016, Astrophys. Space Sci. Lib., 418, 355 [NASA ADS] [CrossRef] [Google Scholar]
- Bournaud, F., & Elmegreen, B. G. 2009, ApJ, 694, L [Google Scholar]
- Brown, G., Gnedin, O. Y., & Li, H. 2018, ApJ, 864, 94 [NASA ADS] [CrossRef] [Google Scholar]
- Cadelano, M., Ransom, S. M., Freire, P. C. C., et al. 2018, ApJ, 855, 125 [Google Scholar]
- Cadelano, M., Saracino, S., Dalessandro, E., et al. 2020, ApJ, 895, 54 [NASA ADS] [CrossRef] [Google Scholar]
- Cadelano, M., Pallanca, C., Dalessandro, E., et al. 2023, A&A, 679, L [Google Scholar]
- Crociati, C., Valenti, E., Ferraro, F. R., et al. 2023, ApJ, 951, 17 [NASA ADS] [CrossRef] [Google Scholar]
- Crociati, C., Cignoni, M., Dalessandro, E., et al. 2024, A&A, 691, A [Google Scholar]
- Dalessandro, E., Crociati, C., Cignoni, M., et al. 2022, ApJ, 940, 170 [NASA ADS] [CrossRef] [Google Scholar]
- Dekel, A., Sari, R., & Ceverino, D. 2009, ApJ, 703, 785 [Google Scholar]
- Deras, D., Cadelano, M., Ferraro, F. R., Lanzoni, B., & Pallanca, C. 2023, ApJ, 942, 104 [CrossRef] [Google Scholar]
- Elmegreen, B. G., Bournaud, F., & Elmegreen, D. M. 2008, ApJ, 688, 67 [NASA ADS] [CrossRef] [Google Scholar]
- Elmegreen, B. G., Elmegreen, D. M., Fernandez, M. X., & Lemonias, J. J. 2009, ApJ, 692, 12 [CrossRef] [Google Scholar]
- Fanelli, C., Origlia, L., Rich, R. M., et al. 2024, A&A, 690, A [Google Scholar]
- Feldmeier-Krause, A., Kerzendorf, W., Neumayer, N., et al. 2017, MNRAS, 464, 194 [Google Scholar]
- Ferraro, F. R., Dalessandro, E., Mucciarelli, A., et al. 2009, Nature, 462, 483 [Google Scholar]
- Ferraro, F. R., Massari, D., Dalessandro, E., et al. 2016, ApJ, 828, 75 [NASA ADS] [CrossRef] [Google Scholar]
- Ferraro, F. R., Pallanca, C., Lanzoni, B., et al. 2021, Nat. Astron., 5, 311 [Google Scholar]
- Ferraro, F. R., Chiappino, L., Bartolomei, A., et al. 2025, A&A, 696, A [Google Scholar]
- Fragkoudi, F., Grand, R. J. J., Pakmor, R., et al. 2020, MNRAS, 494, 5936 [Google Scholar]
- Genzel, R., Newman, S., Jones, T., et al. 2011, ApJ, 733, 101 [Google Scholar]
- Gerhard, O., & Martinez-Valpuesta, I. 2012, ApJ, 744, L [Google Scholar]
- Grevesse, N., & Sauval, A. J. 1998, Space Sci. Rev., 85, 161 [Google Scholar]
- Hammer, F., Puech, M., Chemin, L., Flores, H., & Lehnert, M. D. 2007, ApJ, 662, 322 [NASA ADS] [CrossRef] [Google Scholar]
- Harris, W. E. 1996, AJ, 112, 1487 [Google Scholar]
- Helmi, A., Babusiaux, C., Koppelman, H. H., et al. 2018, Nature, 563, 85 [Google Scholar]
- Immeli, A., Samland, M., Gerhard, O., & Westera, P. 2004, A&A, 413, 547 [CrossRef] [EDP Sciences] [Google Scholar]
- Ishchenko, M., Sobolenko, M., Berczik, P., et al. 2023, A&A, 678, A [Google Scholar]
- Johnson, C. I., Rich, R. M., Kobayashi, C., Kunder, A., & Koch, A. 2014, AJ, 148, 67 [Google Scholar]
- Khoperskov, S., Mastrobuono-Battisti, A., Di Matteo, P., & Haywood, M. 2018, A&A, 620, A [Google Scholar]
- Kruijssen, J. M. D., Pfeffer, J. L., Reina-Campos, M., Crain, R. A., & Bastian, N. 2019, MNRAS, 486, 3180 [Google Scholar]
- Lanzoni, B., Dalessandro, E., Ferraro, F. R., et al. 2007, ApJ, 668, L [Google Scholar]
- Lanzoni, B., Ferraro, F. R., Dalessandro, E., et al. 2010, ApJ, 717, 653 [Google Scholar]
- Leanza, S., Pallanca, C., Ferraro, F. R., et al. 2023, ApJ, 944, 162 [NASA ADS] [CrossRef] [Google Scholar]
- Magg, E., Bergemann, M., Serenelli, A., et al. 2022, A&A, 661, A [Google Scholar]
- Majewski, S. R., Schiavon, R. P., Frinchaboy, P. M., et al. 2017, AJ, 154, 94 [NASA ADS] [CrossRef] [Google Scholar]
- Massari, D., Mucciarelli, A., Dalessandro, E., et al. 2012, ApJ, 755, L [Google Scholar]
- Massari, D., Mucciarelli, A., Ferraro, F. R., et al. 2014a, ApJ, 791, 101 [NASA ADS] [CrossRef] [Google Scholar]
- Massari, D., Mucciarelli, A., Ferraro, F. R., et al. 2014b, ApJ, 795, 22 [NASA ADS] [CrossRef] [Google Scholar]
- Massari, D., Dalessandro, E., Ferraro, F. R., et al. 2015, ApJ, 810, 69 [CrossRef] [Google Scholar]
- Massari, D., Koppelman, H. H., & Helmi, A. 2019, A&A, 630, L [Google Scholar]
- Mastrobuono-Battisti, A., Khoperskov, S., Di Matteo, P., & Haywood, M. 2019, A&A, 622, A [Google Scholar]
- Matteucci, F., & Brocato, E. 1990, ApJ, 365, 539 [CrossRef] [Google Scholar]
- McKenzie, M., & Bekki, K. 2018, MNRAS, 479, 3126 [CrossRef] [Google Scholar]
- Origlia, L., & Rich, R. M. 2004, AJ, 127, 3422 [Google Scholar]
- Origlia, L., Rich, R. M., & Castro, S. 2002, AJ, 123, 1559 [Google Scholar]
- Origlia, L., Valenti, E., & Rich, R. M. 2005, MNRAS, 356, 1276 [NASA ADS] [CrossRef] [Google Scholar]
- Origlia, L., Valenti, E., & Rich, R. M. 2008, MNRAS, 388, 1419 [NASA ADS] [Google Scholar]
- Origlia, L., Rich, R. M., Ferraro, F. R., et al. 2011, ApJ, 726, L [Google Scholar]
- Origlia, L., Massari, D., Rich, R. M., et al. 2013, ApJ, 779, L [Google Scholar]
- Origlia, L., Mucciarelli, A., Fiorentino, G., et al. 2019, ApJ, 871, 114 [NASA ADS] [CrossRef] [Google Scholar]
- Padmanabh, P. V., Ransom, S. M., Freire, P. C. C., et al. 2024, A&A, 686, A [Google Scholar]
- Pallanca, C., Ferraro, F. R., Lanzoni, B., et al. 2019, ApJ, 882, 159 [NASA ADS] [CrossRef] [Google Scholar]
- Pallanca, C., Lanzoni, B., Ferraro, F. R., et al. 2021, ApJ, 913, 137 [NASA ADS] [CrossRef] [Google Scholar]
- Pallanca, C., Leanza, S., Ferraro, F. R., et al. 2023, ApJ, 950, 138 [NASA ADS] [CrossRef] [Google Scholar]
- Pfeffer, J., Lardo, C., Bastian, N., Saracino, S., & Kamann, S. 2021, MNRAS, 500, 2514 [Google Scholar]
- Ransom, S. M., Hessels, J. W. T., Stairs, I. H., et al. 2005, Science, 307, 892 [NASA ADS] [CrossRef] [PubMed] [Google Scholar]
- Rich, R. M., & Origlia, L. 2005, ApJ, 634, 1293 [NASA ADS] [CrossRef] [Google Scholar]
- Rich, R. M., Origlia, L., & Valenti, E. 2007, ApJ, 665, L [Google Scholar]
- Rich, R. M., Origlia, L., & Valenti, E. 2012, ApJ, 746, 59 [NASA ADS] [CrossRef] [Google Scholar]
- Rich, R. M., Ryde, N., Thorsbro, B., et al. 2017, AJ, 154, 239 [NASA ADS] [CrossRef] [Google Scholar]
- Romano, D., Ferraro, F. R., Origlia, L., et al. 2023, ApJ, 951, 85 [NASA ADS] [CrossRef] [Google Scholar]
- Saha, K., & Gerhard, O. 2013, MNRAS, 430, 2039 [NASA ADS] [CrossRef] [Google Scholar]
- Saracino, S., Dalessandro, E., Ferraro, F. R., et al. 2015, ApJ, 806, 152 [NASA ADS] [CrossRef] [Google Scholar]
- Saracino, S., Dalessandro, E., Ferraro, F. R., et al. 2016, ApJ, 832, 48 [Google Scholar]
- Saracino, S., Dalessandro, E., Ferraro, F. R., et al. 2019, ApJ, 874, 86 [Google Scholar]
- Schiavon, R. P., Phillips, S. G., Myers, N., et al. 2024, MNRAS, 528, 1393 [CrossRef] [Google Scholar]
- Snaith, O., Haywood, M., Di Matteo, P., et al. 2015, A&A, 578, A [Google Scholar]
- Tacchella, S., Lang, P., Carollo, C. M., et al. 2015, ApJ, 802, 101 [NASA ADS] [CrossRef] [Google Scholar]
- Taylor, D. J., Mason, A. C., Schiavon, R. P., et al. 2022, MNRAS, 513, 3429 [NASA ADS] [CrossRef] [Google Scholar]
- Tolstoy, E., Hill, V., & Tosi, M. 2009, ARA&A, 47, 371 [Google Scholar]
- Valenti, E., Ferraro, F. R., & Origlia, L. 2007, AJ, 133, 1287 [Google Scholar]
- Valenti, E., Ferraro, F. R., & Origlia, L. 2010, MNRAS, 402, 1729 [NASA ADS] [CrossRef] [Google Scholar]
- Valenti, E., Origlia, L., & Rich, R. M. 2011, MNRAS, 414, 2690 [NASA ADS] [CrossRef] [Google Scholar]
- Valenti, E., Origlia, L., Mucciarelli, A., & Rich, R. M. 2015, A&A, 574, A [Google Scholar]
- Valenti, E., Zoccali, M., Gonzalez, O. A., et al. 2016, A&A, 587, L [Google Scholar]
- Vasiliev, E., & Baumgardt, H. 2021, MNRAS, 505, 5978 [NASA ADS] [CrossRef] [Google Scholar]
- Verbunt, F., & Hut, P. 1987, in IAU Symp., 125, 187 [Google Scholar]
While here we specifically discuss the case of Ter5, analogous arguments hold for Liller 1 as well. The most relevant information for Liller 1 can be found as follows: the reconstructed orbit in Baumgardt et al. (2019), the observed metallicity distribution in Crociati et al. (2023), detailed chemical abundances for α-elements and other metals in Alvarez Garay et al. (2024); Fanelli et al. (2024), and the reconstructed star formation history in Dalessandro et al. (2022).
See the https://www.sdss4.org/dr17/irspec/spectro_data/ webpage).
Fundamental parameters of Galactic globular clusters, https://people.smp.uq.edu.au/HolgerBaumgardt/globular/
All Tables
All Figures
|
Fig. 1 Average [<Ca, Si, Mg, O>/Fe] (i.e. [α/Fe]) trends with [Fe/H] of the bulge (grey dots), halo-disc (green squares), and Ter5 (red triangles) stars from dataset #1 (see Sect. 3). |
| In the text | |
|
Fig. 2 Chemical abundance ratio distributions of the bulge field and Ter5 stars from dataset #1 (see Sect. 3.1). Left panels: [Si/Fe], [Ca/Fe], [Mg/Fe], [O/Fe], and the average [<Ca, Si, Mg, O>/Fe] (i.e. [α/Fe]) trends with [Fe/H] of the bulge field (grey dots) and Ter5 (red triangles) stars. The running LOWESS median curves at 95% confidence (thick green lines) and 1, 2, 3σ shaded regions are also plotted, together with the typical measurement error bars. Right panels: corresponding distributions of the differences with the LOWESS median curve values. |
| In the text | |
|
Fig. 3 Diagnostic diagrams for target selection. Left panel: spatial map projected on the sky of the Ter5 stars from the compilation by Schiavon et al. (2024), referred to its centre at RA = 263∘.3523333, Dec = −33∘.3895556. The solid black circle has the tidal radius of 4.6′ quoted by Lanzoni et al. (2010); the dashed black circle has the Jacobi radius of 25.37′ quoted by Taylor et al. (2022). Middle panel: Gaia DR3 proper motions referred to the systemic values of Ter5 quoted by Vasiliev & Baumgardt (2021) for the Ter5 and the bulge field stars within the tidal radius. The solid black circle has the proper motion confidence radius of 2.7 mas yr−1 quoted by Taylor et al. (2022). Right panel: corresponding 2MASS CMD for the stars in the middle panel with proper motions within the confidence radius. The black rectangle delimits the Ter5 giant branch sequences. In all panels, the symbols are as follows: grey dots for stars within the tidal radius, black stars for APOGEE Ter5 stars within the tidal radius, filled triangles for APOGEE stars within the Jacobi radius, and empty triangles for stars outside it. Blue triangles mark stars with J - K colours significantly bluer than those of Ter5 giants, and hence likely foreground stars, while red triangles mark stars with J-K colours consistent with those of Ter5 giants. |
| In the text | |
|
Fig. 4 APOGEE DR17 chemical abundance ratio distributions of the bulge field and Ter5 stars from dataset #2 (see Sect. 3.2). Left panels: [Si/Fe], [Ca/Fe], [Mg/Fe], and [O/Fe], and the average [α/Fe]) trends with [Fe/H] of the bulge field (grey dots) and Ter5 (black stars and red triangles) stars. Black stars refer to Ter5 members within the tidal radius of 4.6′ quoted by Lanzoni et al. (2010), while red triangles mark stars outside 4.6′ and within the Jacobi radius of 25.4′ quoted by Taylor et al. (2022). The black stars circled in red are in common with Taylor et al. (2022). The running LOWESS median curves at 95% confidence (thick green lines) and 1, 2, 3σ shaded regions are also plotted, together with the typical measurement error bars. Right panels: corresponding distributions of the differences with the LOWESS median curve ones. |
| In the text | |
Current usage metrics show cumulative count of Article Views (full-text article views including HTML views, PDF and ePub downloads, according to the available data) and Abstracts Views on Vision4Press platform.
Data correspond to usage on the plateform after 2015. The current usage metrics is available 48-96 hours after online publication and is updated daily on week days.
Initial download of the metrics may take a while.