Fig. 3
Download original image
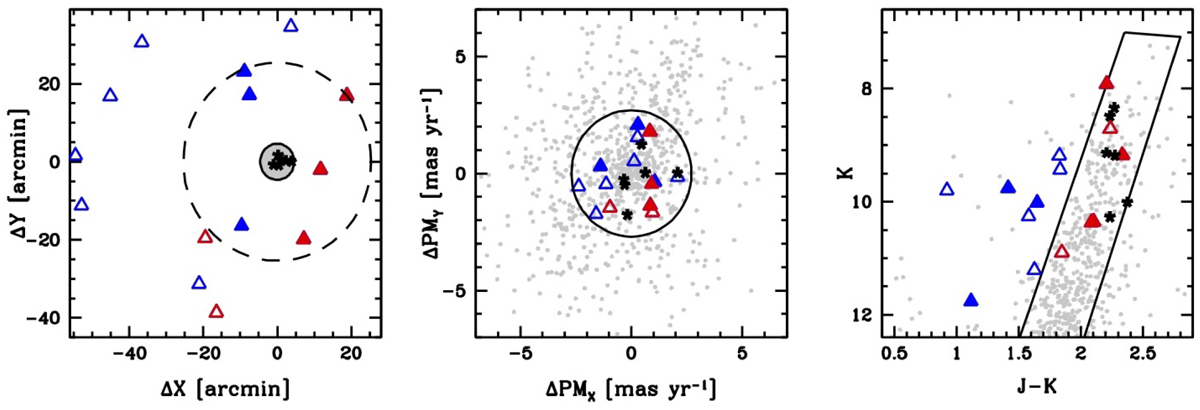
Diagnostic diagrams for target selection. Left panel: spatial map projected on the sky of the Ter5 stars from the compilation by Schiavon et al. (2024), referred to its centre at RA = 263∘.3523333, Dec = −33∘.3895556. The solid black circle has the tidal radius of 4.6′ quoted by Lanzoni et al. (2010); the dashed black circle has the Jacobi radius of 25.37′ quoted by Taylor et al. (2022). Middle panel: Gaia DR3 proper motions referred to the systemic values of Ter5 quoted by Vasiliev & Baumgardt (2021) for the Ter5 and the bulge field stars within the tidal radius. The solid black circle has the proper motion confidence radius of 2.7 mas yr−1 quoted by Taylor et al. (2022). Right panel: corresponding 2MASS CMD for the stars in the middle panel with proper motions within the confidence radius. The black rectangle delimits the Ter5 giant branch sequences. In all panels, the symbols are as follows: grey dots for stars within the tidal radius, black stars for APOGEE Ter5 stars within the tidal radius, filled triangles for APOGEE stars within the Jacobi radius, and empty triangles for stars outside it. Blue triangles mark stars with J - K colours significantly bluer than those of Ter5 giants, and hence likely foreground stars, while red triangles mark stars with J-K colours consistent with those of Ter5 giants.
Current usage metrics show cumulative count of Article Views (full-text article views including HTML views, PDF and ePub downloads, according to the available data) and Abstracts Views on Vision4Press platform.
Data correspond to usage on the plateform after 2015. The current usage metrics is available 48-96 hours after online publication and is updated daily on week days.
Initial download of the metrics may take a while.