Fig. 2
Download original image
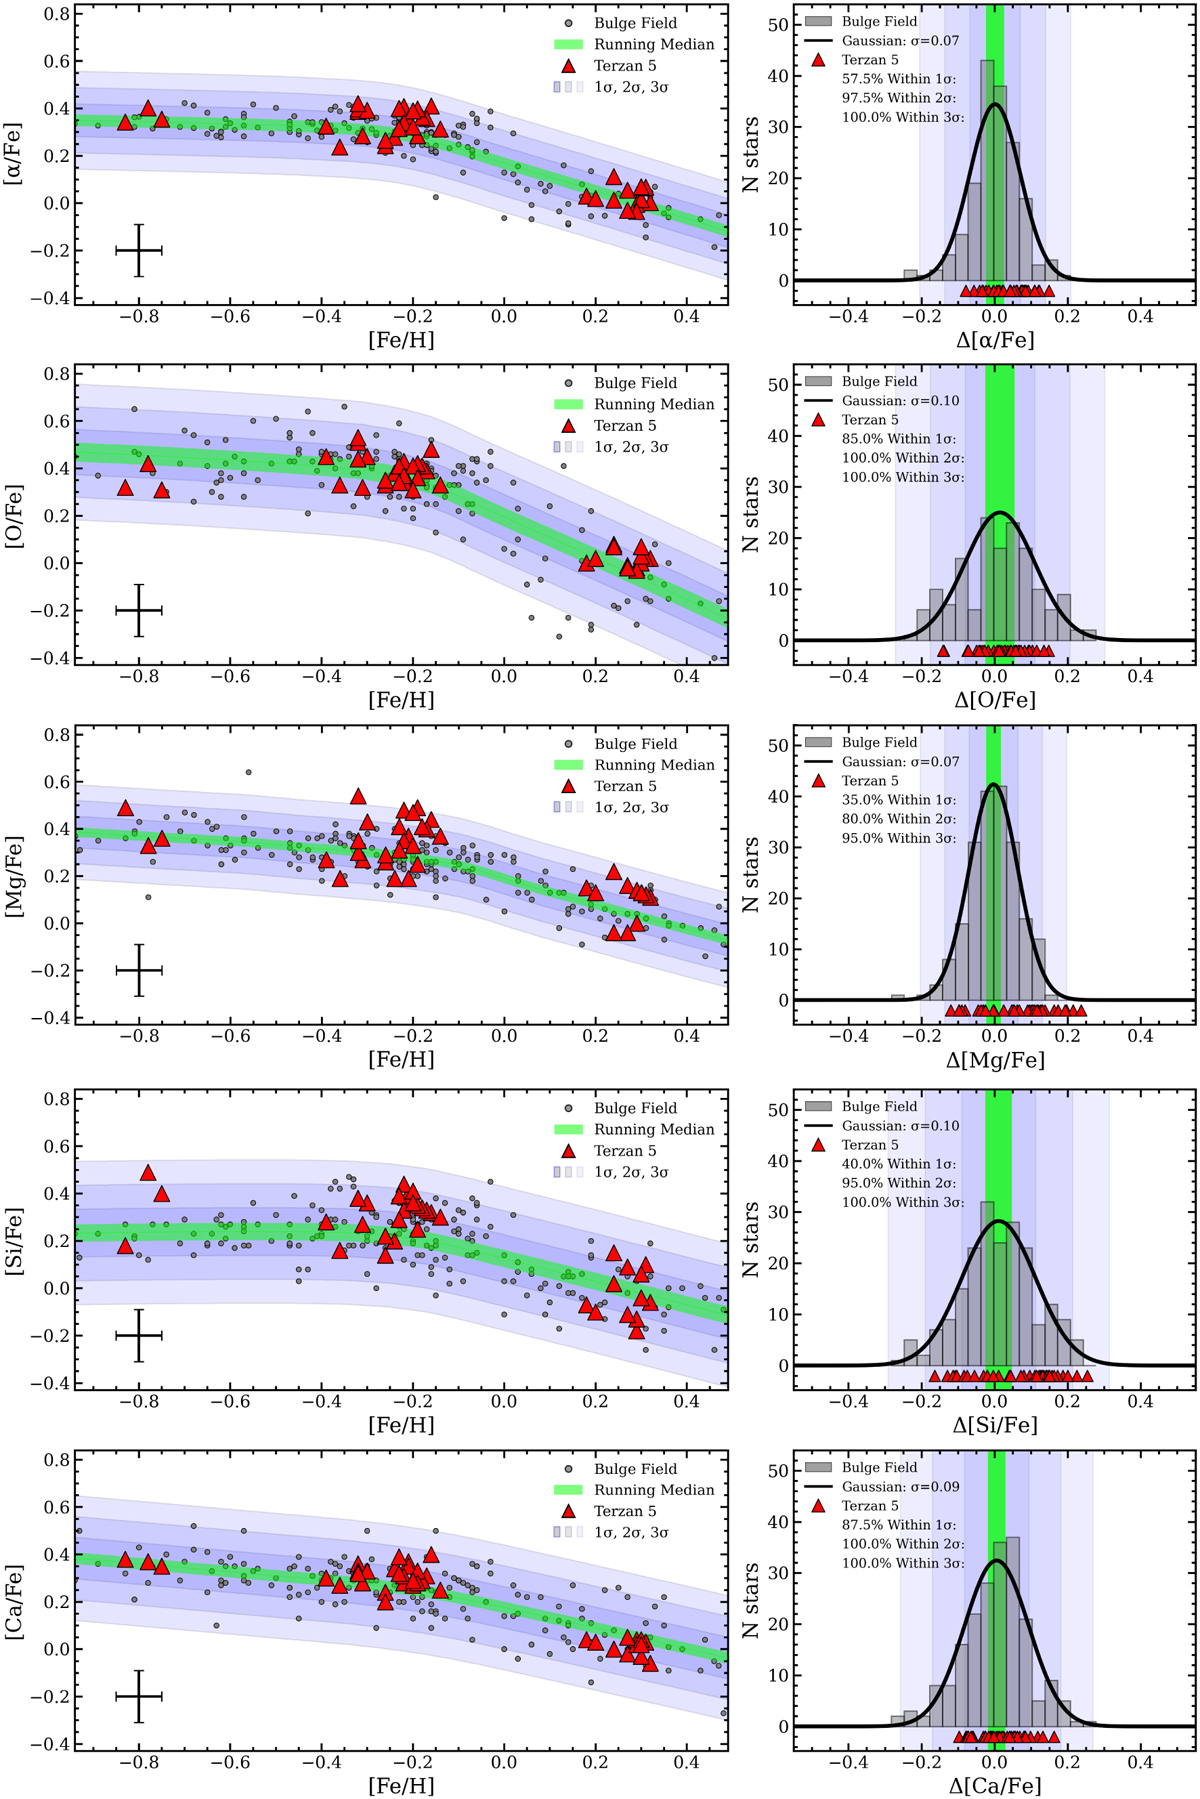
Chemical abundance ratio distributions of the bulge field and Ter5 stars from dataset #1 (see Sect. 3.1). Left panels: [Si/Fe], [Ca/Fe], [Mg/Fe], [O/Fe], and the average [<Ca, Si, Mg, O>/Fe] (i.e. [α/Fe]) trends with [Fe/H] of the bulge field (grey dots) and Ter5 (red triangles) stars. The running LOWESS median curves at 95% confidence (thick green lines) and 1, 2, 3σ shaded regions are also plotted, together with the typical measurement error bars. Right panels: corresponding distributions of the differences with the LOWESS median curve values.
Current usage metrics show cumulative count of Article Views (full-text article views including HTML views, PDF and ePub downloads, according to the available data) and Abstracts Views on Vision4Press platform.
Data correspond to usage on the plateform after 2015. The current usage metrics is available 48-96 hours after online publication and is updated daily on week days.
Initial download of the metrics may take a while.