Fig. 2
Download original image
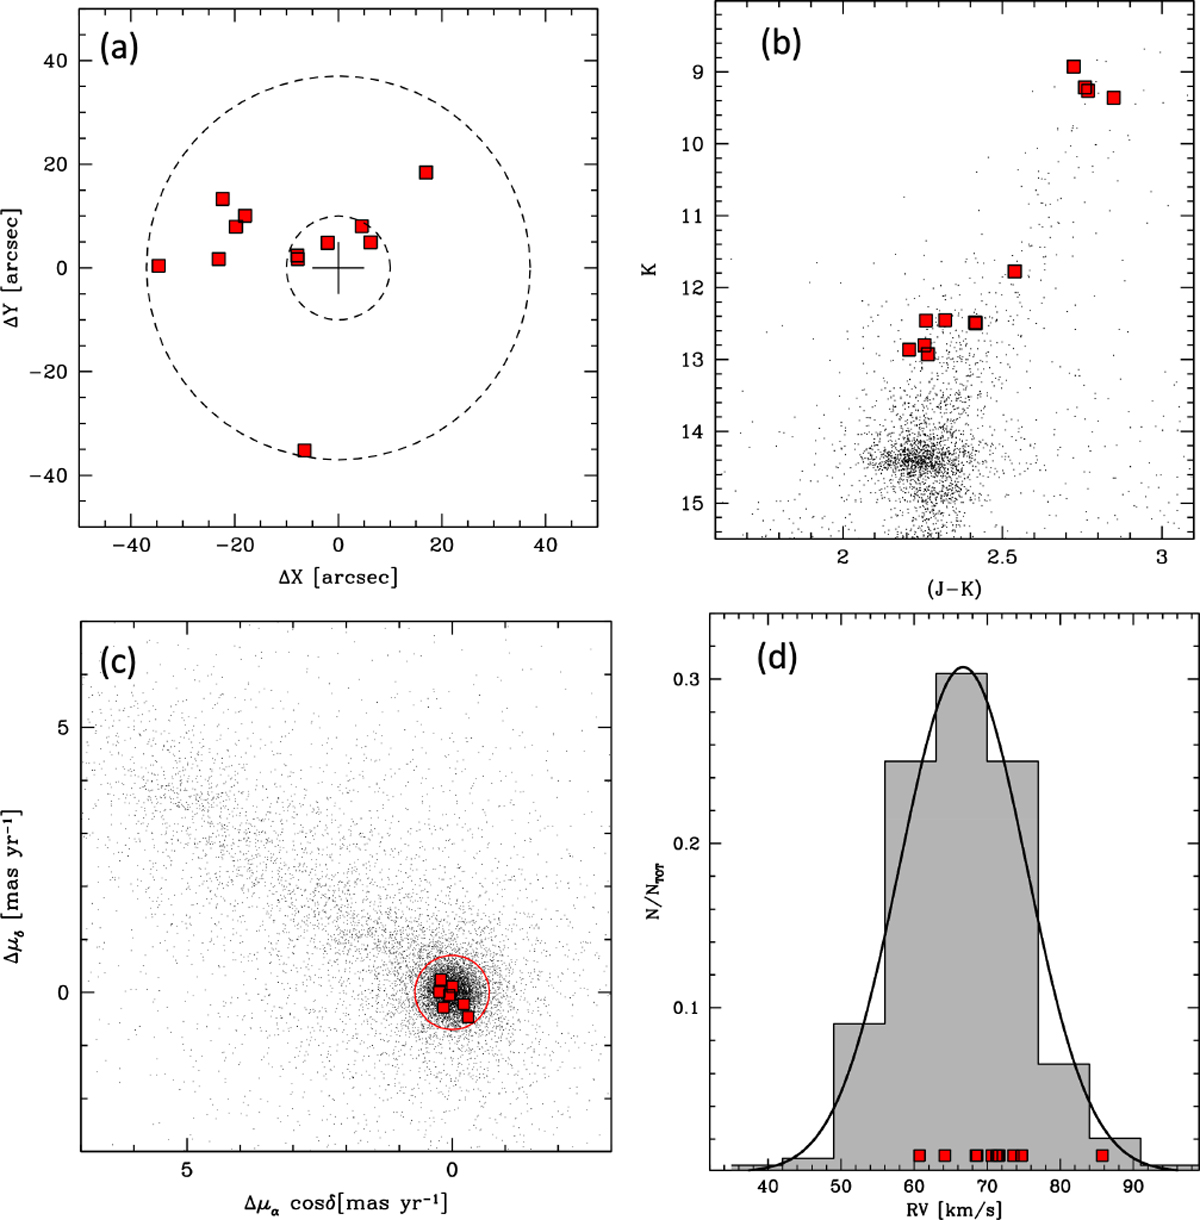
Spectroscopic targets (red squares) observed in Liller 1. Panel a: position of the targets in the plane of the sky with respect to the cluster center (marked with a cross). For the sake of reference, the two dashed circles mark the distances at 10′′ and 37′′ from the center. Panel b: target positions in the NIR CMD. Panel c: vector-point diagram of relative PMs determined from HST and adaptive optics observations. The red circle delimits the stars considered as likely cluster members in Dalessandro et al. (2022). Panel d: radial velocity of the 12 targets compared to the overall distribution of 244 stars measured in previous studies (Crociati et al. 2023; Alvarez Garay et al. 2024a; Fanelli et al. 2024).
Current usage metrics show cumulative count of Article Views (full-text article views including HTML views, PDF and ePub downloads, according to the available data) and Abstracts Views on Vision4Press platform.
Data correspond to usage on the plateform after 2015. The current usage metrics is available 48-96 hours after online publication and is updated daily on week days.
Initial download of the metrics may take a while.