Open Access
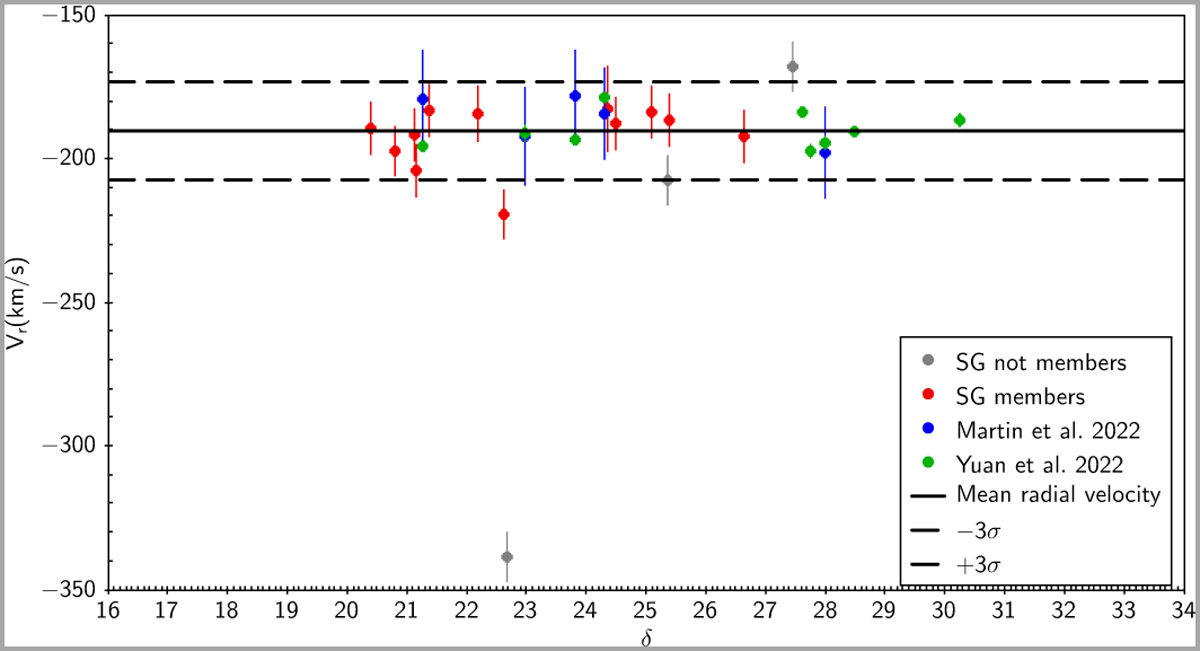
Fig. 2
Download original image
Radial velocities of our program stars and the stars from Martin et al. (2022) and Yuan et al. (2022) plotted as a function of declination. The dashed lines indicate three σ shifts from the mean value (represented by the thick line).
Current usage metrics show cumulative count of Article Views (full-text article views including HTML views, PDF and ePub downloads, according to the available data) and Abstracts Views on Vision4Press platform.
Data correspond to usage on the plateform after 2015. The current usage metrics is available 48-96 hours after online publication and is updated daily on week days.
Initial download of the metrics may take a while.