| Issue |
A&A
Volume 694, February 2025
|
|
|---|---|---|
| Article Number | L6 | |
| Number of page(s) | 5 | |
| Section | Letters to the Editor | |
| DOI | https://doi.org/10.1051/0004-6361/202453393 | |
| Published online | 04 February 2025 | |
Letter to the Editor
Signs of ‘Everything Everywhere All at Once’ formation in low-surface-brightness globular-cluster-rich dwarf galaxies
1
Instituto de Astrofísica de Canarias, Av. Via Lactea s/n, E38205 La Laguna, Spain
2
Departamento de Astrofísica, Universidad de La Laguna, E-38200 La Laguna, Tenerife, Spain
3
Centre for Astrophysics & Supercomputing, Swinburne University of Technology, Hawthorn, VIC 3122, Australia
4
ARC Centre of Excellence for All Sky Astrophysics in 3 Dimensions (ASTRO 3D), Australia
5
Department of Physics & Astronomy, San José State University, One Washington Square, San Jose, CA 95192, USA
6
Department of Astronomy & Astrophysics, University of California Santa Cruz, 1156 High Street, Santa Cruz, CA 95064, USA
7
European Southern Observatory, Karl-Schwarzschild-Strasse 2, 85748 Garching bei München, Germany
⋆ Corresponding author; aferre@iac.es
Received:
11
December
2024
Accepted:
26
December
2024
Context. Only two ultra-diffuse galaxies (UDGs) have spatially resolved stellar population properties, showing flat to rising metallicity profiles, indicative of a different formation pathway than most dwarf galaxies. The scarcity of other low-surface-brightness (LSB) dwarfs with a similar analysis prevents a deeper understanding of this behaviour.
Aims. We investigated the radial profiles of the ages, metallicities, and star formation histories of four globular cluster (GC)-rich LSB dwarfs, newly observed as part of the ‘Analysis of Galaxies At The Extremes’ (AGATE) collaboration. DFX1 and DF07 are bona fide UDGs, while PUDG-R27 and VCC 1448 are ‘nearly UDGs’. Comparing their and DF44’s properties to simulations, we aim to reveal their formation pathways.
Methods. We used the full-spectral-fitting code pPXF to fit different spectra extracted in annular apertures in a bid to recover the stellar population properties and compute their gradients. We compared these results with a sample of literature classical dwarfs and simulations, in particular simulated UDGs.
Results. Our five LSB dwarfs have flat age and flat to rising metallicity profiles. Such age gradients are compatible with those of classical dwarfs (observed and from cosmological simulations), but the metallicity gradient diverges. All of our LSB dwarfs (except for PUDG-R27, which shows a pronounced increasing metallicity) are compatible with being on the extreme tail of the age–metallicity gradient relation, suggesting a coeval formation, forming the galaxy all at once.
Conclusions. This sample of GC-rich LSB dwarfs with spatially resolved properties provides further evidence that they follow a different formation path than classical dwarfs. However, larger samples with higher-S/N spectra and varying amounts of GC richness are required to set robust constraints on the formation pathways of LSB dwarf galaxies.
Key words: galaxies: dwarf / galaxies: evolution / galaxies: formation / galaxies: stellar content
© The Authors 2025
 Open Access article, published by EDP Sciences, under the terms of the Creative Commons Attribution License (https://creativecommons.org/licenses/by/4.0), which permits unrestricted use, distribution, and reproduction in any medium, provided the original work is properly cited.
This article is published in open access under the Subscribe to Open model. Subscribe to A&A to support open access publication.
1. Introduction
Thanks to studies of ultra-diffuse galaxies (UDGs) over the last decade, we now know much more about the low-surface-brightness (LSB) Universe and low-mass galaxies. UDGs have stellar masses similar to those of classical dwarfs (log(M*/M⊙)∼7–8.5) but much larger effective radii (Re > 1.5 kpc) and extremely low surface brightnesses (μ0, g > 24 mag arcsec−2; van Dokkum et al. 2015). The formation of these extreme dwarfs may be the result of several different scenarios. Some involve internal processes such as stellar feedback expansion, high spin, or passive evolution (e.g. Di Cintio et al. 2017; Rong et al. 2017), while others involve external effects such as environmental quenching, galaxy mergers, ram-pressure or tidal stripping, and tidal heating (e.g. Carleton et al. 2019; Fielder et al. 2024). Combinations of both internal and external processes are highly probable (e.g. Jiang et al. 2019).
Such a variety of formation processes consequently led to the resulting UDGs having differing properties. Huge observational efforts have been made to obtain deep imaging to detect UDGs and derive robust sizes, morphologies, and colours (e.g. Venhola et al. 2017; Zaritsky et al. 2023) or to detect their globular cluster (GC) populations (e.g. Lim et al. 2020; Janssens et al. 2024; Marleau et al. 2024). In addition, much telescope time has been devoted to the extremely challenging effort of obtaining spectra to derive stellar population properties and internal kinematics in order to probe their dark matter halos (see Gannon et al. 2024a for a compilation of spectroscopic data).
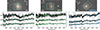 |
Fig. 1. 1 × 1 arcmin cutouts around DF07, DFX1, and PUDG-R27 from Hubble Space Telescope F814W data. The cyan rectangle indicates the positioning of the KCWI slicer. The orange ellipses indicate the regions used for the extraction of spectra and correspond to the three spectra below: the central annulus (cent), the middle aperture (mid), and the outer annulus (out). For each spectrum, the coloured line corresponds to the pPXF fit. Shaded regions show enforced masking, and dashed vertical lines mark some relevant lines: Hβ, Fe5015, Mgb, and Fe5270 (from left to right). |
Overall, some UDGs resemble the faint end of classical dwarfs in some aspects, while others present intriguingly divergent properties, suggesting there are two distinct types (e.g. Buzzo et al. 2025). The first type are thought to be classical dwarfs that puffed up due to one of the above scenarios. They should thus have stellar population properties resembling those of classical dwarfs: intermediate to old ages, relatively extended star formation histories (SFHs), low metallicities that follow the standard mass–metallicity relation (MZR; e.g. Ferré-Mateu et al. 2018; Buzzo et al. 2022; Ferré-Mateu et al. 2023, FM+23 hereafter), and a range of GC numbers. The second type of UDGs, dubbed ‘failed galaxies’, are those that do not follow the MZR of local dwarfs but instead that of high-redshift galaxies and have extremely low metallicities. They form very early on, and are thus very old, and present the highest α-abundance patterns (FM+23). They are expected to host, in general, the most populous GC systems (Forbes et al. 2020).
While simulations can reproduce some properties of individual observed UDGs, there is no simulation that alone can describe their observed large variety of properties. In FM+23 we discussed the properties of UDGs from different cosmological simulations and their caveats (e.g. too high metallicities in Illustris-TNG, Nelson et al. 2018; or not producing classical dwarfs in NIHAO, Di Cintio et al. 2017). But one of the most striking discrepancies identified so far are their radial metallicity profiles. Simulations of isolated and cluster UDGs alike predict declining metallicity and flat age profiles towards the outer parts of galaxies (e.g. Cardona-Barrero et al. 2023; Benavides et al. 2024). In contrast, the only two observed UDGs to date with spatially resolved stellar populations, DF44, (van Dokkum et al. 2019; Villaume et al. 2022) and NGC 1052-DF2 (Emsellem et al. 2019; Fensch et al. 2019) have flat to rising profiles.
Here we investigate the radial stellar population trends of five cluster LSB dwarfs, including a re-analysis of DF44, within the Analysis of Galaxies At The Extremes (AGATE) collaboration. Two of them are bona fide UDGs according to the original definition from van Dokkum et al. (2015), DF07 and DFX1. However, given the recent results of Buzzo et al. (2025), showing that the distinct properties of the two classes of UDGs extend to other dwarf galaxies, we also include two ‘nearly UDGs’ (NUDGes; Forbes & Gannon 2024): PUDG-R27 (considered a UDG in FM+23) and VCC 1448 (Gannon et al. 2024b). All five LSB dwarfs are GC-rich (i.e. with more than 20 GCs), and we assume a Λ cold dark matter cosmology with H0 = 70 km s−1 Mpc−1, Ωm = 0.27, and ΩΛ = 0.73.
2. Data and methods
Observations and data reduction for DF07, DFX1, and PUDG-R27 are described in FM+23, which presents their global stellar population values. The data were obtained with the integral-field Keck Cosmic Web Imager (KCWI), and here we extracted spectra from three annular apertures with semi-major axis radii of 0–1, 1–3, and 3–9 arcsec, following each galaxy’s photometric centre, position angle, and axis ratio (see Fig. 1). Sky subtraction was performed using a 3″ annulus surrounding the extracted region. Figure 1 also shows the resulting spectra for each aperture (black line). The KCWI data for DF44 (re-analysed here) and VCC 1448 have higher signal-to-noise ratios, allowing for more annuli (7 and 11, respectively). Details about these observations, data reduction, and the resulting spectra can be found in Villaume et al. (2022) for DF44, and Gannon et al. (2024b) for VCC 1448.
We followed established methods for deriving stellar populations from moderate-S/N spectra of low-mass galaxies. In brief, we used pPXF (Cappellari 2017) to derive the mean ages, metallicities, and SFHs. We employed the E-MILES (Vazdekis et al. 2015) single stellar population models with BaSTI isochrones and a Kroupa (2001) initial mass function, spanning 0.03–14 Gyr in age, and metallicities of [M/H] = −2.42 to +0.26 dex. Applying a regularisation parameter or not yielded similar SFHs and stellar population properties for the UDGs analysed in FM+23. We thus used a non-regularised solution for simplicity, with associated uncertainties obtained through Monte Carlo simulations of the fitting procedure (e.g. different configurations, varying regularisation values, and different fitting polynomials). This procedure was performed for all five LSB galaxies, including DF44, for which we obtain results compatible with the published values of Villaume et al. (2022).
3. Stellar population gradients in LSB dwarfs
The SFH for each bin is shown in Fig. 2 as the mass fraction assembled since the Big Bang. Horizontal dotted lines mark certain percentages of mass fraction assembled, used to compute critical timescales (e.g. the quenching time when the galaxy assembled 90% of its total mass). Most of our LSB dwarfs formed relatively quickly, regardless of the initial time of formation. The three UDGs in Coma took ∼5 Gyr to form half of their stellar mass and quenched ∼6–8 Gyr ago. PUDG-R27 instead had an extremely early and fast formation, with very early quenching, indicative of very early cluster infall. VCC 1448 shows the most extended SFH in the sample, with a slow and steady formation history that quenched only ∼2 Gyr ago, suggesting late infall into the Virgo Cluster. All of these quenching times are compatible with their respective phase space positions within their environment (FM+23; Gannon et al. 2024b).
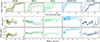 |
Fig. 2. Stellar population gradients for our LSB dwarfs. Top: their SFHs, shown as the cumulative mass fraction assembled over cosmic time since the Big Bang. Dotted horizontal lines mark 50, 90, and 100% of mass build-up. Lighter colours represent the outermost apertures (first, middle, and outer bins for DF44 and VCC 1448 only), and shaded regions show the fitting uncertainties. Middle and Bottom: mean mass-weighted age and metallicity profiles, with the different apertures and uncertainties represented by shaded regions (lighter shades for lower S/N). In each panel, a star symbol is shown at 1Re, the integrated value. Overall, the age profiles are flat with relatively old ages, whereas the metallicity profiles all show a flat-to-rising tendency. |
We also show in the middle and bottom rows of Fig. 2 the age and metallicity gradients derived from the previous SFHs. We performed linear fits to these profiles, computed within 0.7 Re. We also computed them within 1 Re for PUDG-R27 and VCC 1448 given their larger coverage, although only the metallicity gradient of VCC 1448 changes, from −0.123 ± 0.105 (dex/Re) to +0.075 ± 0.101 (dex/Re). We find rather flat age profiles, with an average of ▽log(Age)∼ − 0.003 ± 0.071 (Gyr/Re), except for DF07, which shows a moderate decrease towards the outskirts. For the metallicity, we find flat to slightly rising profiles with, on average, ▽[M/H] ∼ +0.123 ± 0.061 (dex/Re), similar to the literature results for DF44 and NGC1052-DF2. This is surprising as both nearby and local classical dwarfs show typically declining metallicity profiles (e.g. Chilingarian 2009; Weisz et al. 2014; Taibi et al. 2022). Table 1 summarises the main properties of each galaxy, as well as the measured gradients.
Main properties of our LSB dwarfs.
To better understand the age and metallicity gradients of the GC-rich LSB dwarfs in this study, we compare them in Fig. 3 to quenched cluster UDGs from the TNG50 simulation (Benavides et al. 2024) and field UDGs from NIHAO (Cardona-Barrero et al. 2023). They are shown as the mean (dotted and dashed lines, respectively) and standard deviation (shaded regions) for each simulation. These simulations have previously been shown to cover masses and sizes similar to those of observed UDGs (e.g. Ferré-Mateu et al. 2018). For completeness, we also include the profiles of the low-density-environment UDG NGC1052-DF2 (Fensch et al. 2019) despite it not being considered GC-rich. The top panel of Fig. 3 shows that the observed flat age profiles are overall very similar to those of UDGs in TNG50 (no age profiles were provided by NIHAO).
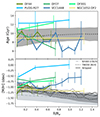 |
Fig. 3. Age (top) and metallicity (bottom) profiles of observed LSB dwarfs (coloured lines), compared to the average trends of quiescent cluster UDGs in the TNG50 simulations (dotted lines and dark grey shading) and field UDGs from NIHAO (dashed line and light grey shading). Solid lines show tidally stripped UDGs from TNG50. While observed age profiles are mostly flat, as in the simulations, the metallicity profiles show a divergence, particularly at larger radii. |
We did not attempt to make direct comparisons with the ‘absolute’ values of the metallicities (bottom panel) but rather with ‘relative trends’, given the caveats intrinsic to each simulation. TNG50 produces systematically higher metallicities than observations, which is usually solved by matching metallicities to a given observed MZR at log(M*/M⊙) = 9. This shift is ∼−0.4 dex (Sales et al. 2020; Benavides et al. 2024), which we applied to our profiles here, noting that a different shift would not affect the comparison. While no re-scaling is necessary for field NIHAO UDGs, these simulations produce much lower metallicities than those of most observed UDGs, only matched by UDGs in low-density environments (see FM+23).
Except for PUDG-R27, which shows a rising metallicity profile, the LSB dwarfs have flat profiles up to ∼0.7 Re. This is similar to NIHAO UDGs, which decline only beyond 1 Re, while TNG50 UDGs show a stronger decline from the centre (see Benavides et al. 2024). Nonetheless, the central metallicities of TNG50 UDGs match ours, likely due to similar environments (clusters). Interestingly, flat profiles are also seen in tidally stripped UDGs in TNG50 (solid grey lines). Tidally stripped galaxies are expected to lie above the local MZR as tides move dwarfs towards higher metallicities (see e.g. Williamson et al. 2016; Sales et al. 2020). However, since our LSB dwarfs follow the MZR relation (see e.g. FM+23), a tidal origin seems unlikely.
We thus conclude that, while the innermost regions of our observed LSB dwarfs can show similar metallicity gradients to those in simulations, some cases are almost incompatible with being flat, let alone decreasing, particularly when reaching farther out from the centre. Although the scatter in observed dwarfs appears larger than in simulations, the dispersion is similar when plotting their individual gradients.
4. Do LSB dwarfs form like classical dwarfs?
Figure 4 shows the stellar population gradients of our cluster GC-rich LSB dwarfs compared to a compilation of observed and simulated dwarfs of different types. We include dwarf ellipticals or S0s (dEs/dS0s), dwarf spheroidals (dSphs), and tidal dwarfs from Koleva et al. (2011) and Virgo dEs from Sybilska et al. (2017), Bidaran et al. (2022), and Lipka et al. (2024). For the simulations we show field dwarfs from FIRE-2 (Graus et al. 2019; Mercado et al. 2021), marking with a shaded red region what is considered a ‘flat’ metallicity gradient within those simulations. We also include simulated quenched cluster UDGs from TNG50 and the average metallicity gradient of UDGs from NIHAO (dashed grey line). For both simulations we re-calculated their values within 0.7 Re to match our observations.
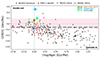 |
Fig. 4. Age vs. metallicity gradients of our GC-rich LSB dwarfs, coloured as in previous figures (also NGC1052-DF2 now). Quiescent simulated cluster UDGs from TNG50 (black three-point asterisks) and the mean gradient (dashed grey) for field UDGs in NIHAO, both computed within 0.7 Re are shown. Red three-point asterisks correspond to simulated field dwarfs from the FIRE-2 simulations; the red shaded region marks the interval considered as ‘flat’ according to Mercado et al. (2021). Pink diamonds correspond to observed classical dwarfs from the literature (see the main text). Our LSB dwarfs are compatible with being at the tail of the distribution of both observed and simulated dwarfs, around the intersection of zero–zero gradients. |
Clearly, the bulk of classical dwarfs present positive age and negative metallicity gradients, favouring an outside-in formation. In this scenario, the star formation becomes more centrally concentrated with time (e.g. Benítez-Llambay et al. 2016), and thus galaxies with early and fast SFHs should have flatter stellar population gradients than galaxies with ongoing star formation (regardless of whether they are steady or bursty). Results of other simulations focussed on the origin of age gradients in dwarfs (e.g. Riggs et al. 2024) also support such an outside-in formation, although they have also found some dwarfs to have rather flat, and in some cases even decreasing, age profiles.
In contrast, Fig. 4 shows that the LSB dwarfs in this work are populating the extreme tail of the dwarf distribution. Except for PUDG-R27, our LSB dwarfs reside around the zero–zero gradient intersection and within the shaded region of flat gradients. Together with the SFHs presented in Sect. 2, this is indicative of an ‘Everything Everywhere All at Once’ coeval formation. We note that VCC 1448’s gradients are more similar to those of classical dwarfs because its metallicity gradient within 0.7 Re is slightly negative but becomes positive at larger radii, moving VCC 1448 closer to the rest of our LSB dwarfs. Noteworthy is that a few observed and simulated classical dwarfs and UDGs share the same space in Fig. 4 (e.g. FCC 288; Koleva et al. 2011). In fact, a small number of observed dwarfs have been found to have rising gas metallicity profiles (e.g. Wang et al. 2019 and Fu et al. 2024 for high-redshift dwarfs; or Grossi et al. 2020 for two Virgo dwarfs). While we have focussed on cluster LSB dwarfs, our results are similar to what has been found for featureless dwarfs in low-density regimes, which seem to be the equivalent to the NUDGes given their slightly higher brightnesses (e.g. Lazar et al. 2024a,b); this would indicate that this coeval formation is not environment dependent, but we need low-density LSB dwarfs to investigate this further.
5. Conclusions
We have studied the age and metallicity gradients of three GC-rich UDGs in clusters (DF44, DF07, and DFX1) and two NUDGes (PUDG-R27 and VCC 1448). We used pPXF to fit apertures for each galaxy and obtain their SFHs, mean ages, and metallicities at each radial bin. In general, we find that all five LSB dwarfs formed relatively quickly (regardless of the time when they started forming stars), compatible with the location within their respective clusters, and in a coeval way. PUDG-R27 had the fastest and earliest quenching, while VCC 1448 has a more extended SFH. They all have virtually flat age profiles with relatively old stellar populations (∼9–10 Gyr), compatible with many observed and simulated LSB galaxies.
We performed a ‘qualitative’ comparison to the profiles of simulated UDGs, given the caveats intrinsic to the latter. While we find virtually flat age gradients, similar to simulations, all our LSB dwarfs have flat to rising metallicity profiles, in stark contrast to the simulated UDGs (Cardona-Barrero et al. 2020; Benavides et al. 2024). We thus confirm the metallicity trends, first reported for DF44 in Villaume et al. (2022), now with a larger sample of LSB dwarfs. Lastly, we compared our stellar population gradients to those of observed and simulated dwarfs in the literature to see if they could share a common formation pathway. Our LSB dwarfs seem to be at the extreme tail in the age–metallicity gradients relation of classical dwarfs (both observed and simulated). Our LSB dwarfs tend to reside around the zero–zero gradient intersection and within the shaded region that indicates relatively flat gradients. We thus conclude that the most plausible formation path for GC-rich cluster LSB dwarfs is an ‘Everything Everywhere All at Once’ coeval formation, with some inside-out formation for the most extreme cases. Larger samples of LSB dwarfs covering different environments and GC populations, and with better data quality and larger spatial coverage, will thus be necessary to truly understand the formation pathways of these extreme dwarfs.
Acknowledgments
We thank J. Benavides and S. Cardona-Barrero for providing the gradients in our required format, and A. Villaume for the DF44 data. AFM has received support from RYC2021-031099-I and PID2021-123313NA-I00. Part of this work was completed while JSG was an ECR visiting fellow at the IAC. DF thanks the ARC DP20200102574, AJR the NSF grant AST-2308390, and we also acknowledge support from ASTRO-3D CE170100013. This work was supported by a NASA Keck PI Data Award, administered by the NASA Exoplanet Science Institute and data were obtained at the W. M. Keck Observatory. The authors wish to recognise and acknowledge the very significant cultural role that the summit of Maunakea has within the Indigenous Hawaiian community.
References
- Benavides, J. A., Sales, L. V., Abadi, M. G., et al. 2024, ApJ, 977, 169 [NASA ADS] [CrossRef] [Google Scholar]
- Benítez-Llambay, A., Navarro, J. F., Abadi, M. G., et al. 2016, MNRAS, 456, 1185 [Google Scholar]
- Bidaran, B., La Barbera, F., Pasquali, A., et al. 2022, MNRAS, 515, 4622 [NASA ADS] [CrossRef] [Google Scholar]
- Buzzo, M. L., Forbes, D. A., Brodie, J. P., et al. 2022, MNRAS, 517, 2231 [NASA ADS] [CrossRef] [Google Scholar]
- Buzzo, M. L., Forbes, D. A., Jarrett, T. H., et al. 2025, MNRAS, 536, 2536 [Google Scholar]
- Cappellari, M. 2017, MNRAS, 466, 798 [Google Scholar]
- Cardona-Barrero, S., Di Cintio, A., Brook, C. B. A., et al. 2020, MNRAS, 497, 4282 [NASA ADS] [CrossRef] [Google Scholar]
- Cardona-Barrero, S., Di Cintio, A., Battaglia, G., Macciò, A. V., & Taibi, S. 2023, MNRAS, 519, 1545 [Google Scholar]
- Carleton, T., Errani, R., Cooper, M., et al. 2019, MNRAS, 485, 382 [NASA ADS] [CrossRef] [Google Scholar]
- Chilingarian, I. V. 2009, MNRAS, 394, 1229 [CrossRef] [Google Scholar]
- Di Cintio, A., Brook, C. B., Dutton, A. A., et al. 2017, MNRAS, 466, L1 [NASA ADS] [CrossRef] [Google Scholar]
- Emsellem, E., van der Burg, R. F. J., Fensch, J., et al. 2019, A&A, 625, A76 [NASA ADS] [CrossRef] [EDP Sciences] [Google Scholar]
- Fensch, J., van der Burg, R. F. J., Jeřábková, T., et al. 2019, A&A, 625, A77 [NASA ADS] [CrossRef] [EDP Sciences] [Google Scholar]
- Ferré-Mateu, A., Alabi, A., Forbes, D. A., et al. 2018, MNRAS, 479, 4891 [CrossRef] [Google Scholar]
- Ferré-Mateu, A., Gannon, J. S., Forbes, D. A., et al. 2023, MNRAS, 526, 4735 [CrossRef] [Google Scholar]
- Fielder, C., Jones, M. G., Sand, D. J., et al. 2024, AJ, 168, 212 [NASA ADS] [CrossRef] [Google Scholar]
- Forbes, D. A., & Gannon, J. 2024, MNRAS, 528, 608 [NASA ADS] [CrossRef] [Google Scholar]
- Forbes, D. A., Ferré-Mateu, A., Durré, M., Brodie, J. P., & Romanowsky, A. J. 2020, MNRAS, 497, 765 [NASA ADS] [CrossRef] [Google Scholar]
- Fu, S. W., Weisz, D. R., Starkenburg, E., et al. 2024, ApJ, 965, 36 [NASA ADS] [CrossRef] [Google Scholar]
- Gannon, J. S., Ferré-Mateu, A., Forbes, D. A., et al. 2024a, MNRAS, 531, 1856 [NASA ADS] [CrossRef] [Google Scholar]
- Gannon, J. S., Forbes, D. A., Romanowsky, A. J., et al. 2024b, MNRAS, 531, 1789 [NASA ADS] [CrossRef] [Google Scholar]
- Graus, A. S., Bullock, J. S., Fitts, A., et al. 2019, MNRAS, 490, 1186 [Google Scholar]
- Grossi, M., García-Benito, R., Cortesi, A., et al. 2020, MNRAS, 498, 1939 [Google Scholar]
- Janssens, S. R., Forbes, D. A., Romanowsky, A. J., et al. 2024, MNRAS, 534, 783 [NASA ADS] [CrossRef] [Google Scholar]
- Jiang, F., Dekel, A., Freundlich, J., et al. 2019, MNRAS, 487, 5272 [CrossRef] [Google Scholar]
- Koleva, M., Prugniel, P., De Rijcke, S., & Zeilinger, W. W. 2011, MNRAS, 417, 1643 [NASA ADS] [CrossRef] [Google Scholar]
- Kroupa, P. 2001, MNRAS, 322, 231 [NASA ADS] [CrossRef] [Google Scholar]
- Lazar, I., Kaviraj, S., Watkins, A. E., et al. 2024a, MNRAS, 529, 499 [NASA ADS] [CrossRef] [Google Scholar]
- Lazar, I., Kaviraj, S., Watkins, A. E., et al. 2024b, MNRAS, 533, 3771 [NASA ADS] [CrossRef] [Google Scholar]
- Lim, S., Côté, P., Peng, E. W., et al. 2020, ApJ, 899, 69 [CrossRef] [Google Scholar]
- Lipka, M., Thomas, J., Saglia, R., et al. 2024, ApJ, 976, 17 [NASA ADS] [CrossRef] [Google Scholar]
- Marleau, F. R., Duc, P.-A., Poulain, M., et al. 2024, A&A, 690, A339 [NASA ADS] [CrossRef] [EDP Sciences] [Google Scholar]
- Mercado, F. J., Bullock, J. S., Boylan-Kolchin, M., et al. 2021, MNRAS, 501, 5121 [NASA ADS] [CrossRef] [Google Scholar]
- Nelson, D., Pillepich, A., Springel, V., et al. 2018, MNRAS, 475, 624 [Google Scholar]
- Riggs, C. L., Brooks, A. M., Munshi, F., et al. 2024, ApJ, 977, 20 [NASA ADS] [CrossRef] [Google Scholar]
- Rong, Y., Guo, Q., Gao, L., et al. 2017, MNRAS, 470, 4231 [Google Scholar]
- Sales, L. V., Navarro, J. F., Peñafiel, L., et al. 2020, MNRAS, 494, 1848 [Google Scholar]
- Sybilska, A., Lisker, T., Kuntschner, H., et al. 2017, MNRAS, 470, 815 [NASA ADS] [CrossRef] [Google Scholar]
- Taibi, S., Battaglia, G., Leaman, R., et al. 2022, A&A, 665, A92 [NASA ADS] [CrossRef] [EDP Sciences] [Google Scholar]
- van Dokkum, P., Danieli, S., Abraham, R., Conroy, C., & Romanowsky, A. J. 2019, ApJ, 874, L5 [Google Scholar]
- van Dokkum, P. G., Abraham, R., Merritt, A., et al. 2015, ApJ, 798, L45 [NASA ADS] [CrossRef] [Google Scholar]
- Vazdekis, A., Coelho, P., Cassisi, S., et al. 2015, MNRAS, 449, 1177 [Google Scholar]
- Venhola, A., Peletier, R., Laurikainen, E., et al. 2017, A&A, 608, A142 [NASA ADS] [CrossRef] [EDP Sciences] [Google Scholar]
- Villaume, A., Romanowsky, A. J., Brodie, J., et al. 2022, ApJ, 924, 32 [Google Scholar]
- Wang, X., Jones, T. A., Treu, T., et al. 2019, ApJ, 882, 94 [Google Scholar]
- Weisz, D. R., Dolphin, A. E., Skillman, E. D., et al. 2014, ApJ, 789, 147 [Google Scholar]
- Williamson, D., Martel, H., & Romeo, A. B. 2016, ApJ, 831, 1 [NASA ADS] [CrossRef] [Google Scholar]
- Zaritsky, D., Donnerstein, R., Dey, A., et al. 2023, ApJS, 267, 27 [NASA ADS] [CrossRef] [Google Scholar]
All Tables
All Figures
|
Fig. 1. 1 × 1 arcmin cutouts around DF07, DFX1, and PUDG-R27 from Hubble Space Telescope F814W data. The cyan rectangle indicates the positioning of the KCWI slicer. The orange ellipses indicate the regions used for the extraction of spectra and correspond to the three spectra below: the central annulus (cent), the middle aperture (mid), and the outer annulus (out). For each spectrum, the coloured line corresponds to the pPXF fit. Shaded regions show enforced masking, and dashed vertical lines mark some relevant lines: Hβ, Fe5015, Mgb, and Fe5270 (from left to right). |
| In the text | |
|
Fig. 2. Stellar population gradients for our LSB dwarfs. Top: their SFHs, shown as the cumulative mass fraction assembled over cosmic time since the Big Bang. Dotted horizontal lines mark 50, 90, and 100% of mass build-up. Lighter colours represent the outermost apertures (first, middle, and outer bins for DF44 and VCC 1448 only), and shaded regions show the fitting uncertainties. Middle and Bottom: mean mass-weighted age and metallicity profiles, with the different apertures and uncertainties represented by shaded regions (lighter shades for lower S/N). In each panel, a star symbol is shown at 1Re, the integrated value. Overall, the age profiles are flat with relatively old ages, whereas the metallicity profiles all show a flat-to-rising tendency. |
| In the text | |
|
Fig. 3. Age (top) and metallicity (bottom) profiles of observed LSB dwarfs (coloured lines), compared to the average trends of quiescent cluster UDGs in the TNG50 simulations (dotted lines and dark grey shading) and field UDGs from NIHAO (dashed line and light grey shading). Solid lines show tidally stripped UDGs from TNG50. While observed age profiles are mostly flat, as in the simulations, the metallicity profiles show a divergence, particularly at larger radii. |
| In the text | |
|
Fig. 4. Age vs. metallicity gradients of our GC-rich LSB dwarfs, coloured as in previous figures (also NGC1052-DF2 now). Quiescent simulated cluster UDGs from TNG50 (black three-point asterisks) and the mean gradient (dashed grey) for field UDGs in NIHAO, both computed within 0.7 Re are shown. Red three-point asterisks correspond to simulated field dwarfs from the FIRE-2 simulations; the red shaded region marks the interval considered as ‘flat’ according to Mercado et al. (2021). Pink diamonds correspond to observed classical dwarfs from the literature (see the main text). Our LSB dwarfs are compatible with being at the tail of the distribution of both observed and simulated dwarfs, around the intersection of zero–zero gradients. |
| In the text | |
Current usage metrics show cumulative count of Article Views (full-text article views including HTML views, PDF and ePub downloads, according to the available data) and Abstracts Views on Vision4Press platform.
Data correspond to usage on the plateform after 2015. The current usage metrics is available 48-96 hours after online publication and is updated daily on week days.
Initial download of the metrics may take a while.