Fig. 2.
Download original image
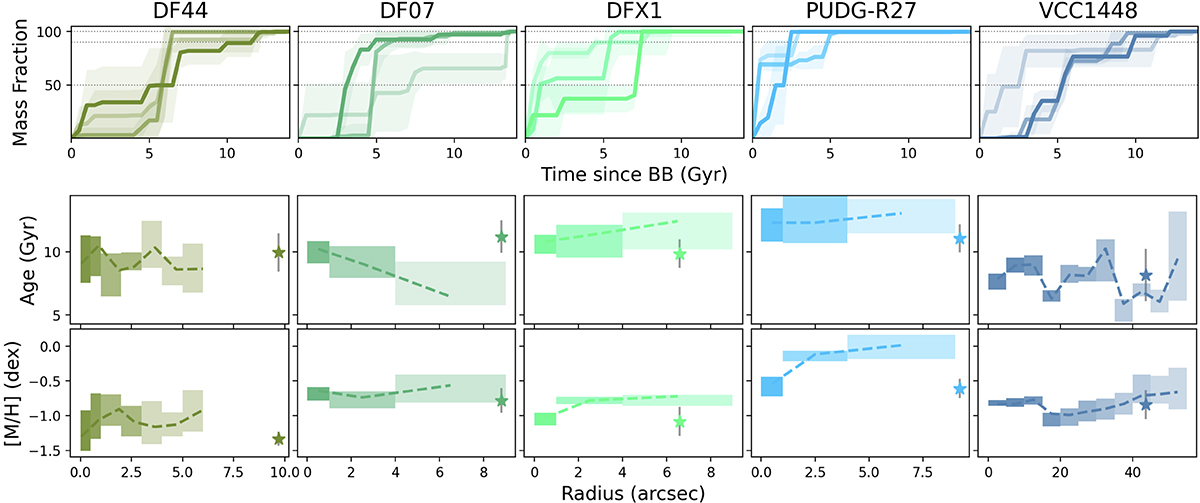
Stellar population gradients for our LSB dwarfs. Top: their SFHs, shown as the cumulative mass fraction assembled over cosmic time since the Big Bang. Dotted horizontal lines mark 50, 90, and 100% of mass build-up. Lighter colours represent the outermost apertures (first, middle, and outer bins for DF44 and VCC 1448 only), and shaded regions show the fitting uncertainties. Middle and Bottom: mean mass-weighted age and metallicity profiles, with the different apertures and uncertainties represented by shaded regions (lighter shades for lower S/N). In each panel, a star symbol is shown at 1Re, the integrated value. Overall, the age profiles are flat with relatively old ages, whereas the metallicity profiles all show a flat-to-rising tendency.
Current usage metrics show cumulative count of Article Views (full-text article views including HTML views, PDF and ePub downloads, according to the available data) and Abstracts Views on Vision4Press platform.
Data correspond to usage on the plateform after 2015. The current usage metrics is available 48-96 hours after online publication and is updated daily on week days.
Initial download of the metrics may take a while.