Fig. 1.
Download original image
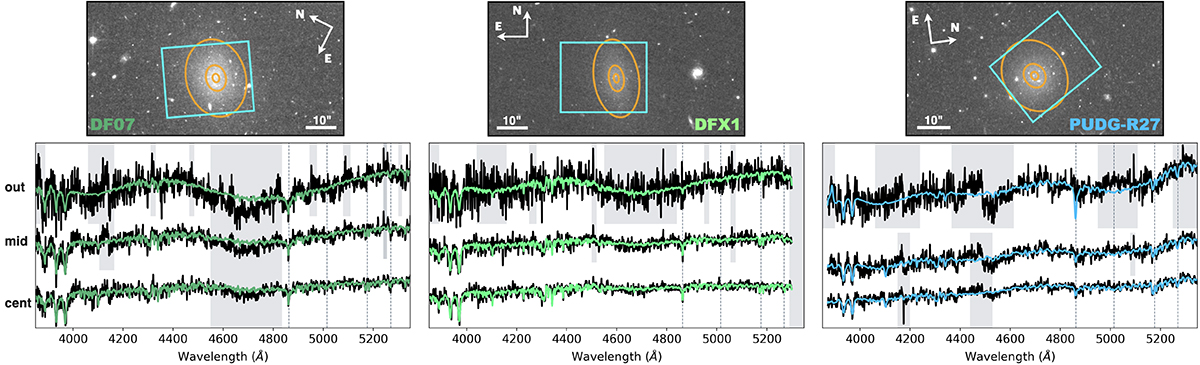
1 × 1 arcmin cutouts around DF07, DFX1, and PUDG-R27 from Hubble Space Telescope F814W data. The cyan rectangle indicates the positioning of the KCWI slicer. The orange ellipses indicate the regions used for the extraction of spectra and correspond to the three spectra below: the central annulus (cent), the middle aperture (mid), and the outer annulus (out). For each spectrum, the coloured line corresponds to the pPXF fit. Shaded regions show enforced masking, and dashed vertical lines mark some relevant lines: Hβ, Fe5015, Mgb, and Fe5270 (from left to right).
Current usage metrics show cumulative count of Article Views (full-text article views including HTML views, PDF and ePub downloads, according to the available data) and Abstracts Views on Vision4Press platform.
Data correspond to usage on the plateform after 2015. The current usage metrics is available 48-96 hours after online publication and is updated daily on week days.
Initial download of the metrics may take a while.