| Issue |
A&A
Volume 694, February 2025
|
|
|---|---|---|
| Article Number | A105 | |
| Number of page(s) | 11 | |
| Section | Interstellar and circumstellar matter | |
| DOI | https://doi.org/10.1051/0004-6361/202452816 | |
| Published online | 06 February 2025 | |
Confirmation of the planetary nebula nature of HaTr 5
Not a remnant of Nova Sco 1437
1
Instituto de Astrofísica de Andalucía, IAA-CSIC, Glorieta de la Astronomía S/N,
Granada
18008,
Spain
2
Instituto de Radioastronomía y Astrofísica, Universidad Nacional Autónoma de México,
58090
Morelia,
Michoacán,
Mexico
3
Observatório do Valongo, Universidade Federal do Rio de Janeiro,
Ladeira Pedro Antonio 43,
Rio de Janeiro
20080-090,
Brazil
4
Laboratory for Space Research, The University of Hong Kong,
Hong Kong
★ Corresponding author; This email address is being protected from spambots. You need JavaScript enabled to view it.
Received:
30
October
2024
Accepted:
13
December
2024
Abstract
Context. The identification of the nebula HaTr 5 with the shell remnant of the historic Nova Sco 1437 around the low-accretion rate cataclysmic variable 2MASS J17022815-4306123 has been used in the framework of the hibernation scenario to set an upper limit of ≤580 yr on the transition time from a nova-like binary to a dwarf nova.
Aims. This work is aimed at clarifying the nature of HaTr 5, which has also been deemed a possible planetary nebula in previous works.
Methods. We obtained intermediate- and high-dispersion long-slit spectra of HaTr 5 and analyzed them in conjunction with archival optical and infrared images to investigate its spectral properties using photoionization models. In addition, we sought to derive its Hα flux and ionized mass and determine its spatio-kinematic by means of 3D models to clarify its true nature.
Results. The Hα flux of HaTr 5 implies an ionized mass of 0.059 M⊙ at the 0.99 kpc distance of 2MASS J17022815-4306123, namely, ∼1000 times the typical ejecta of a nova. If HaTr 5 were actually an unrelated planetary nebula, its Hα flux would imply a distance of 2.25 kpc and an ionized mass of 0.47 M⊙. The expansion velocity of HaTr 5 is found to be ≃27 km s−1, with a heliocentric radial velocity of −1 km s−1.
Conclusions. The ionized mass of HaTr 5 and its expansion velocity (and associated kinematic age) are clearly inconsistent with those expected for a nova remnant, all strongly support a planetary nebula nature. The association of 2MASS J17022815-4306123 with HaTr 5 is further called into question based on their differing radial velocities and almost orthogonal motions on the plane of the sky. We have concluded that HaTr 5 is an old, evolved planetary nebula unrelated to the remnant of Nova Sco 1437 or to the cataclysmic variable 2MASS J17022815-4306123, with the latter being by chance projected onto HaTr 5.
Key words: stars: evolution / novae, cataclysmic variables / white dwarfs / planetary nebulae: general / planetary nebulae: individual: HaTr 5 / ISM: individual objects: Nova Sco 1437
© The Authors 2025
 Open Access article, published by EDP Sciences, under the terms of the Creative Commons Attribution License (https://creativecommons.org/licenses/by/4.0), which permits unrestricted use, distribution, and reproduction in any medium, provided the original work is properly cited.
This article is published in open access under the Subscribe to Open model. This email address is being protected from spambots. You need JavaScript enabled to view it. to support open access publication.
1 Introduction
Ionized gaseous nebulae in our Galaxy arise from multiple processes associated with different progenitors that can have vastly different observed origins, masses, and physical states. They can range from H II regions, ionized bubbles, including Ström- gren spheres around hot white dwarf (WD) stars or massive stars, and various kinds of stellar ejecta at different phases of evolution such as Wolf–Rayet shells, nova remnants, supernova remnants, symbiotic systems, Herbig–Haro outflows, and planetary nebulae (PNe hereafter). A variety of powerful diagnostic tools are used to discriminate among them, including multi-wavelength imagery, kinematic properties, spectroscopy, emission line ratios, and even the local environment. Many nebula types have properties in common, however, and sometimes it is not straightforward to be equivocal about their nature, even when a holistic approach to the consideration of all available source and comparison data are used (see, e.g., Frew & Parker 2010; Parker 2022, where various PN mimics are discussed). Here, we review a specific and interesting contentious source, the nebula HaTr5, whose true nature has been disputed as either PN or nova remnant.
HaTr 5 is a flocculent, approximately round nebula proposed to be a low-surface-brightness PN by the astronomers who discovered it (Hartl & Tritton 1985). Its optical spectrum has ruled it out from being a normal H II region due to the high observed [N II] to Hα line ratio; however, it is not typical of a PN either (e.g., Frew & Parker 2010; Parker 2022) because of its very high [S II] λ6716,6731 to Hα line ratio, ~1.0. This ratio is usually seen in sources with strong shockexcitation, such as supernova remnants (SNRs) or Wolf-Rayet shells. This fact, along with the absence of any obvious central star, have led to its initial classification as only a possible PN in the most comprehensive and robust available catalog of PNe: the Hong Kong/AAO/Strasbourg H-alpha planetary nebula database (HASH, Parker et al. 2016)1, under the HASH ID number 1105.
HaTr 5 has also been proposed to be associated with the gaseous remnant of the historical nova Scorpii of 11 March AD 1437, hereafter, Nova Sco 1437 (Shara et al. 2017). The association is based on the identification of the putative nova progenitor with the cataclysmic variable (CV) 2MASS J17012815- 4306123 and X-ray source IGRJ17014-4306 (hereafter, J17014- 4306), which is projected onto HaTr5 and whose proper motion placed it at its center at the time of the nova event.
J17014-4306 is a dwarf nova with small accretion rate. Therefore, its identification as the progenitor of Nova Sco 1437 is relevant to the hibernation hypothesis, which predicts that the mass-transfer rate onto the WD exhibits a cyclic behavior. It remains high for centuries after the nova eruption to then become low for thousand to million years before a new nova eruption occurs (Shara et al. 1986). Accordingly, a classical nova (CN) is expected to become a nova-like binary after the eruption, to turn into a dwarf nova a few centuries later. There are a few examples of ancient nova shells around dwarf novae (e.g., Z Cam, Shara et al. 2007) that would support these expectations, but most lack a robust determination of the nova date. This makes the case of Nova Sco 1437 potentially unique, as it provides one of the few examples of a dwarf nova associated with a CN remnant of known age.
The hibernation hypothesis is appealing and has important implications for stellar astrophysics, as it settles the mass grow rate of WDs in accreting binary systems in their possible path towards Type Ia supernova progenitors (as proposed for SN Ia PTF 11kx, Dilday et al. 2012). Observational evidence of the time-lag from the high to low accretion rate states is, however, controversial. A key system is WY Sge, recorded as the oldest CN eruption in the late 18th century (Nova WY Sag 1783). It exhibits nowadays a high mass loss rate transfer to the WD (Somers et al. 1996; Vogt et al. 2018), thus providing a lower limit of ≥240 yr for the transition from nova-like systems to dwarf novae (Shara 1984). This is also the case of V1213 Cen (a.k.a. Nova Cen 2019), whose continuous photometric coverage revealed a dwarf-nova (low accretion rate) before the nova eruption, but a nova-like binary (high accretion rate) afterwards (Mróz et al. 2016). On the contrary, there are quite a number of examples of post-novae with dwarf-nova like outbursts just a few decades (e.g., V446 Her, a.k.a. Nova Her 1960, Honeycutt et al. 2011) or in the range between 100 and 200 years (e.g., V728 Sco, a.k.a. Nova Sco 1862, Tappert et al. 2012) after the nova eruption. Most likely the time-lag before the hibernation phase starts depends on the specifics of the binary system (Šimon 2023).
Nova Sco 1437 is thus relevant to the discussion on the transition from high to low accretion rate states after a nova eruption, but the identification of its remnant with HaTr 5 has been put into question after a critical revision of ancient Chinese and Korean astronomy texts (Hoffmann 2019). This was motivated by a reduction to about a third of the previous proper-motion of J17014-4306 by Gaia DR2 data (confirmed in Gaia DR3 data, Bailer-Jones et al. 2021). The age of the remnant of Nova Sco 1437 is also unusually large compared to most nova remnants, whose Hα luminosity declines below typical detection limits before they are 200 yr old (Tappert et al. 2020), with the exception of a few ancient nova remnants proposed to be several centuries old; for instance, V1315 Aql, BZ Cam, Te 11 (Miszalski et al. 2016; Sahman et al. 2018; Bond & Miszalski 2018), and others in addition to Z Cam (see the review on ancient novae in Tappert et al. 2020).
In this paper, we present new, long-slit, intermediate- and high-dispersion spectroscopic observations of HaTr 5 to investigate the properties of this nebula anew. Our focus is placed on the comparison of the nebular kinematics expected for a nova remnant and a PN as a key diagnostic. An expansion velocity of a few hundreds of km s−1 would point to a nova remnant. An expansion of a few tens of km s−1 would be attributable to a PN. Finally, a negligible expansion velocity would be associated with a Strömgren sphere around a WD. This type of nebulae result when a long-lived WD, whose own PN dissipated in the distant past, migrates into an area of ISM that gets ionized by the UV radiation field of such hot star.
This paper is organized as follows. Observations are described in Sect. 2. The nebula properties and consequences of our spectroscopic observations are presented in Sect. 3, while our discussion of the alternative identification scenarios are given in Sect. 4. Final remarks on the possible association between HaTr 5 and the cataclysmic variable J17014-4306 are given in Sect. 5.
2 Observations and data reduction
2.1 Archival VPHAS+, SHS, and Spitzer images
Images in the u, ɡ, and Hα band of the sky region including HaTr 5 were downloaded from the VST Photometric Hα Survey of the Southern Galactic Plane and Bulge (VPHAS+, Drew et al. 2014) archive. VPHAS+ uses the 2.6 m VLT Survey Telescope (VST) on ESO’s Cerro Paranal Observatory, and the large field-of-view OmegaCAM. The images have a pixel size of 0.213 arcsec. The u and ɡ band images were obtained on September 11 2014 using u-SDSS and ɡ- SDSS filters with total exposure times of 150 s and 40 s, respectively. The Hα image was obtained on July 24 2012 using the NB_659 filter (λc = 6588 Å, FWHM = 107 Å) with a total exposure time of 120 s. The filter bandpass includes emission from both the Hα and [N II] λλ6548, 6584 emission lines. The resulting image will be accordingly referred to as Hα+[N II] image. The u band and Hα+[N II] images are presented in the top-left and top-right panels of Fig. 1, respectively.
A wide field of view SuperCOSMOS Hα Survey (SHS, Parker et al. 2005) Hα+[N II] image including HaTr 5 was downloaded from the SHS Homepage2. The image, shown in the bottom-left panel of Fig. 1, has a pixel size of 0.677 arcsec.
A similar wide field of view Spitzer IRAC images in the IRAC2 4.5µm, IRAC3 5.8µm, and IRAC4 8.0 µm bands were downloaded from the IRSA Archive3. These images have been used to made the IRAC color-composite picture presented in the bottom-right panel of Fig. 1. This picture has the same field of view of the SHS image presented in the same figure.
2.2 High-dispersion spectroscopy
The Goodman High Throughput Spectrograph (GHTS) at the 4.1 m Southern Astrophysical Research Telescope (SOAR) on the Cerro Pachón (Chile) was used to obtain high-resolution long-slit spectra of HaTr 5 on July 1 2024. The red camera and 2100 lines mm−1 grating with central wavelength 6507 Å were used to cover the spectral range from 6130 Å to 6710 Å. This includes the bright Hα and [N II] λλ6548, 6584 Å and the low- excitation [O I] λλ6300, 6363Å emission lines prominent in the night sky spectrum and in supernova remnants, but typically absent or weak in PN spectra. The CCD e2V CCD231-84-1-F21 was used, providing a spectral dispersion of 0.141 Å pix−1 and a plate scale of 0.15 arcsec pix−1. In conjunction with the 0.6″ wide slit, this setup provides a spectral resolution of ≃10000, which corresponds to ≃30–40 km s−1 for the above emission lines.
As stated in the observation log detailed in Table 1, three 1800 s exposures were obtained for HaTr 5 with slits chosen along two different position angles (PA), 45° and 135°, as illustrated in the top-right panel of Fig. 1. The two PAs allow us to make an assessment of the nebula kinematics, effectively removing the diffuse background emission surrounding HaTr5 (see the IR image in the right panel of Fig. 1), which can affect line ratios and kinematics information as well.
Bias and flat-field frames were acquired, as well as Hg+Ar+Ne arc lamp frames for wavelength calibration and spectral observations of the spectro-photometric standard star EGGR 274 of WD spectral type for flux calibration (Greenstein 1984). The arc exposures were obtained immediately before the six exposures of HaTr 5, while those of EGGR 274 were taken after. The data were reduced using standard IRAF routines (Tody 1993). As determined from the FWHM of the continuum emission of stars registered along the slit, the spatial resolution (seeing) is estimated to be ≃1.4 arcsec. The wavelength calibration accuracy is better than 0.1 km s−1.
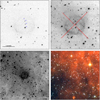 |
Fig. 1 VPHAS+ u-SDSS (top-left) and Hα+[N II] (top-right) images centered on HaTr 5 (field of view ≈4 arcmin) and a wide field of view (≈10.5 arcmin) SHS Hα+[N II] image (bottom-left) and Spitzer IRAC color-composite picture (bottom-right) of HaTr 5. Stars detected in the u band projected onto HaTr 5 are labeled on the u-SDSS image, whereas the location and orientation of the two SOAR GHTS long-slits are overlaid on the Hα image. On the Spitzer IRAC picture, red, green, and blue colors correspond to the IRAC4 8 µm, IRAC3 5.8 µm, and IRAC2 4.5 µm bands, respectively, whereas the location of the nebula is marked by a white circle. The wide field of view images in the bottom panels highlight the general diffuse emission around HaTr 5, with no obvious connection between the mid-IR and optical nebular emissions. |
Spectroscopic observation log of HaTr 5.
2.3 Intermediate-dispersion spectroscopy
Two sets of intermediate-dispersion long-slit spectroscopic observations of HaTr 5 were obtained with the South-African Astronomical Observatory (SAAO) 1.9 m telescope 10 years apart. Both sets of spectra used the 300 lines mm−1 grating #gr7 and a 2 arsec wide slit oriented east-west, that is, a PA=90°.
The 2014 SAAO 1.9 m data were obtained on September 15 with the old Cassegrain spectrograph and covered a wavelength range of 4000 Å to 7550 Å with a spectral dispersion of 3.84 Å pix−1. The usual bias, dome flat field, sky flat field, and Cu+Ar arc calibration frames were acquired. For the data reduction, standard IRAF techniques were employed to deliver 1D wavelength calibrated, sky-subtracted spectra.
The 2024 data were obtained on June 8 with the so-called “Spectrograph Upgrade-Newly Improved Cassegrain spectrograph” (SpUpNIC, Crause et al. 2019) that covered a wider wavelength range of 5500 Å, from 3500 Å further out to the blue and to the red at 9000 Å due to the different format CCD and new spectrograph design. The spectral dispersion provided was 2.7 Å pix−1. Once more, standard bias, dome flat field, sky flat field, and Cu+Ar arc frames were acquired. Arc spectra were taken immediately before and after the science observations in both datasets.
For the 2024 data reduction, we used standard IRAF techniques coupled with our in-house Python-based data-reduction pipeline. This pipeline performed the standard reduction steps like overscan subtraction, trimming, bias subtraction, cosmic- ray removal with the L.A. Cosmic algorithm by van Dokkum (2001), removing pixel-to-pixel sensitivity variations using the master dome flat (ignoring pixels with a S/N less than 100), and correcting for the CCD illumination profile using the master sky flat. Before the extraction of the spectra to 1D using the simple-sum algorithm, the 2D spectra were transformed so that the spectral features align with columns and rows. In each case, the sky was subtracted using a separate sky spectrum close to HaTr 5. Unfortunately, due to bad weather, the sky spectrum had to be taken the following night (September 9, 2024) at a similar time. This likely accounts for the presence of residual [O I] 6300, 6363 night sky-lines in the 2024 data. After the wavelength calibration (RMS < 0.4 km s−1) the spectra were corrected for the heliocentric velocity using the Astropy SkyCoord package and flux calibrated using the spectrophotometric standard star HR 7950 with the Astropy Specreduce package.
3 The nebular properties of HaTr 5
The VPHAS+ Hα+[N II] image of HaTr 5 in the top-right panel of Fig. 1 (see also Fig. 1 in Shara et al. 2017) shows a mild elliptical 100 × 92 arcsec nebula with its major axis aligned along the southeast-northwest direction. The nebula displays a limb- brightened morphology, enhanced along the southeast direction, and prominent filaments across the nebula and blister-like “flocculent” structures. HaTr 5 is surrounded by large-scale diffuse, patchy, Hα emission. Extensive, patchy emission is also prominent in the mid-IR (bottom-right panel of Fig. 1). The nebula seems to be superimposed on a large-scale wide filament running from northeast to southwest. The optical and IR large scale emissions are apparently unrelated to HaTr 5.
The one-dimensional (1D) SAAO and SOAR spectra of HaTr 5 are shown in Fig. 2. The two intermediate-dispersion SAAO spectra of HaTr 5 display a limited number of emission lines typical of ionized nebulae, including Hα, [N II] λλ6548, 6584, and the [S II] λλ6716, 6731 doublet as listed in Table 2. As noted in Sect. 2.3, the [O I] λλ6300, 6363 emission lines seen in the 2024 spectra, but absent in the earlier 2014 SAAO spectra, are due to poor sky subtraction necessitated by using an offset sky exposure taken on a different night and are consequently deemed unreliable. No blue emission lines are detected in the 2014 spectrum, but the deeper 2024 spectrum detects weak [O III] λ5007 and Hβ, and notably bright [O II] λ3727, although the latter can be affected by uncertainties in the flux calibration at the blue end of the spectrum. The [O III] line is weaker than Hβ indicating a low ionization nebula. For comparison, Table 2 also lists the emission lines and approximate line ratios detected in the deep SAAO SALT observations of the brightest southeast nebular region reported by Shara et al. (2017). The exact values of the line ratios may differ notably among the different spectra. As for the differences observed for the low-excitation [N II] λλ6548, 6584 and [S II] λλ6716, 6731 emission lines, these can be attributed to the lower signal-to-noise ratio (S/N) of the SAAO 2014 spectrum and to the differing nebular regions registered by the SAAO 2014 and 2024 spectra (east-west long-slit across the nebula center) and the SALT spectrum (long-slit along the bright southeast nebular edge). The intensity of the [O I] λλ6300, 6363 doublet in the SALT spectrum confirms their excessive value in the SAAO 2024 spectrum.
The observed Hα to Hβ ratio can be used to derive the logarithmic extinction coefficient c(Hβ) using the expression:
![Mathematical equation: $c({\rm{H}}\beta ) = {1 \over {f({\rm{H}}\alpha )}}\log {{{{[F({\rm{H}}\alpha )/F({\rm{H}}\beta )]}_{{\rm{observed }}}}} \over {{{[F({\rm{H}}\alpha )/F({\rm{H}}\beta )]}_{{\rm{theoretical }}}}}},$](/articles/aa/full_html/2025/02/aa52816-24/aa52816-24-eq1.png) (1)
(1)
where it will be adopted a theoretical Hα to Hβ flux ratio of 2.863 (see Luridiana et al. 2015) for recombination Case B, and a value of ƒ(Hα) = −0.34, according to the standard extinction law of Whitford (1958). The above expression then becomes
![Mathematical equation: $c({\rm{H}}\beta ) = {1 \over { - 0.34}}\log {{{{[F({\rm{H}}\alpha )/F({\rm{H}}\beta )]}_{{\rm{observed }}}}} \over {2.863}}.$](/articles/aa/full_html/2025/02/aa52816-24/aa52816-24-eq2.png) (2)
(2)
For the observed Hα to Hβ flux ratios of 5.56 and 5.26 derived from the SpUpNIC and SALT spectra in Table 2, this implies values of c(Hβ) of 0.85 and 0.78, respectively, which imply values of AV of 1.9 and 1.7 mag for the canonical value of 3.1 for RV. An average value of 0.81 ± 0.10 is hereafter adopted for c(Hβ), where the uncertainty accounts both for the differences between these two spectra and for the Hα to Hβ line ratio uncertainties. The nebular electron density can be derived from the line ratio of the [S II] λλ6716, 6731 density-sensitive doublet line ratio (see, e.g., Osterbrock & Ferland 2006). The [S II] λ6716 to λ6731 line ratio derived from the SAAO 2004 SpUpNIC and SALT spectra, ≈1.40, is, however, below the linear [S II] line ratio to electron density correlation range, in the so-called low-density limit. The electron density of the nebular shell can only be stated to be low, ≲100 cm−3.
The high-dispersion SOAR GHTS 2-D background- subtracted spectra show emission in the Hα and [N II] λλ6548, 6584 lines, but the [O I] λλ6300, 6363 emission lines are not detected. Since the SOAR spectra have much higher spectral resolution and dispersion than the SAAO SpUpNIC and SALT spectra, it demonstrates that the [O I] emission lines detected in these spectra may be affected by the poor removal at lower spectral resolution of the bright and highly variable [O I] night sky-lines.
A closer inspection of the SOAR GHTS 2-D spectra reveals the typical lenticular shape of an expanding nebula both in the Hα and [N II] emission lines. The angular extent of the Hα and [N II] emission undoubtedly associates it with HaTr 5 (Fig. 3), whereas the kinematically unresolved emission towards the northeast can be most likely attributed to the large-scale diffuse emission. The double-component spectral profiles of the Hα and [N II] emission lines have been deblended using two-Gaussian fits (Fig. 4) to derive expansion and Heliocentric systemic velocities of ≃26 km s−1 and ≃−1 km s−1, respectively. The uncertainties of these velocities is estimated from the spectral profiles in Fig. 4 to be smaller than half a pixel, namely, ±3 km s−1. For comparison, the Heliocentric velocity of the kinematically unresolved large-scale background emission around HaTr 5 is ≃ − 10 km s−1. The line widths (σ) of the Hα and [N II] λ6584 emission lines are 18 km s−1 and 15 km s−1, respectively.
The Hα and [N II] surface brightness (SB) radial profiles of HaTr 5 presented in Fig. 5 are also consistent with a shell, with emission peaks along the northeast-southwest (minor axis) and southeast-northwest (major axis) directions consistent with the VPHAS+ Hα+[N II] image of HaTr 5. The Hα SB is generally brighter than the [N II] one, except for the edges of the shell major axis, very particularly the southeast one, where the SB profiles have maximum values and [N II] is brighter than Hα. Otherwise the relatively high “peak-to-center” Hα SB ratio in Fig. 5 is indicative of a thick shell. The surface brightness profile along the more representative northeast-southwest direction is roughly described by a thin outer shell, with a thickness ≈15 per cent the nebular radius filled with material with emissivity five times lower (magenta line in the bottom panel of Fig. 5). The filling factor ε of this multiple shell structure is ≃0.65.
Assuming a constant velocity expansion, a kinematical age can be derived for HaTr 5 from its angular radius, distance, and expansion velocity. An averaged angular radius of 50.5 arcsec is estimated from the size of the SB radial profiles at half-peak intensity. Thus a kinematical age of (9200 ± 1400) × (D/1kpc) yr is derived, where D stands for the distance.
Since kinematical information is available along two orthogonal long-slits covering the minor and major nebular axes (see Fig. 1), the 3D physical structure of the expanding shell of HaTr 5 can be mostly determined (see, for instance, Santamaría et al. 2022), using the well-known spatio-kinematical modeling tool SHAPE (Steffen et al. 2011). This tool produces synthetic images and position-velocity (PV) diagrams for a given geometry (shape and orientation), expansion velocity law (a homologous expansion velocity is assumed here), and surface brightness distribution (including small-scale features such as filaments and knots, and asymmetric brightness distribution) of the shell. These are qualitatively compared to the observed ones, paying special attention to the nebula size, shape, and orientation in the image, to the expansion velocity and line tilt in the PN diagrams, and to small-scale features (clumps, filaments) in both the image and PV diagrams. The model is accordingly modified in an iterative process until a satisfactory match is reached such that any further parameter modification makes the synthetic image and PV diagrams depart from the observed ones. The best 3D model for HaTr 5 is an irregular oblate shell with a notorious dent, which was adjusted taking into account the line-tilt of the PV diagrams and their deviations with respect to a lenticular shape, and the filamentary appearance of the image and its deviations with respect to an elliptical morphology. This best model is shown as a mesh structure seen along different directions in Fig. 3 (right). The SHAPE synthetic PV diagrams and image provide a reasonable representation of the observed PV diagrams and image in the left and middle panels of Fig. 3, respectively. The SHAPE model implies an expansion velocity of 27±3 km s−1, whereas the inclination angle with the line of sight of its major axis is estimated to be 18º±2º. The kinematical age of HaTr5 derived from this model is (9300 ± 1000) × (D/1kpc) yr, consistent with that derived above.
The value of the Hα flux of an ionized nebula is key to determine its ionized mass and root mean square (rms) density. These can be computed according to expressions
 (3)
(3)
and
![Mathematical equation: ${n_{\rm{e}}} = 1350{M_{\rm{i}}}{\left[ {{{4\pi } \over 3}{{(\Theta \,D)}^3}\varepsilon } \right]^{ - 1}}{\rm{c}}{{\rm{m}}^{ - 3}},$](/articles/aa/full_html/2025/02/aa52816-24/aa52816-24-eq4.png) (4)
(4)
where F0 (Hα) is the reddening corrected total nebular flux in units of 10−12 erg cm−2 s−1 and Θ is the angular radius in arcmin (Pottasch 1984). The Hα flux of HaTr 5 can be computed from the SB radial profiles presented in Fig. 5. These have been averaged radially to determine a SB(r) function subsequently used to compute an average Hα SB of 2.3 × 10⁻¹⁶ erg cm−2 s−1 arcsec−2 and, thus, an observed Hα flux4 of 2.3 × 10⁻¹² erg cm−2 s−1. The unreddened Hα flux is then computed as
![Mathematical equation: ${F_0}({\rm{H}}\alpha ) = {10^{[(1 - f(\lambda )) \times c({\rm{H}}\beta )]}}F({\rm{H}}\alpha ),$](/articles/aa/full_html/2025/02/aa52816-24/aa52816-24-eq5.png) (5)
(5)
that, for a c(Hβ) value of 0.81, implies an unreddened Hα flux of 7.9 × 10⁻¹² erg cm−2 s−1 (or log F0(Hα) = −11.10). Therefore, the ionized mass of HaTr 5 is estimated to be 0.061 × (D/1kpc)5/2 M⊙, with an rms density of ≃50 × (D/1 kpc)−1/2 cm−3.
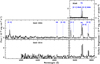 |
Fig. 2 SOAR (top), SAAO 2024 (middle), and SAAO 2014 (bottom) 1D spectra of HaTr 5. Emission lines are labeled on the SOAR and SAAO 2024 spectra. The left y-axis denotes flux, but surface brightness for the right y-axis. Note: the “artificial” extreme variations of the [O I] emission lines caused by poor sky subtraction for the SAAO 2024 spectrum and low S/N of the SAAO 2014 spectrum. The apparent [O I] emission lines in the SOAR spectrum are residuals of the sky subtraction as well. |
Measured line fluxes (F) and extinction corrected line intensities (I) of HaTr 5, together with synthetic line intensities.
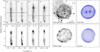 |
Fig. 3 Spatio-kinematic information of HaTr 5 and the best SHAPE model. Left: SOAR GHTS Hα and [N II] (top) and SHAPE synthetic (bottom) PV diagrams. (center) HASH Hα+[N II] (top) and SHAPE synthetic (bottom) image. Right: SHAPE mesh models along the line of sight and from the plane of the sky along the southeast to northwest direction. |
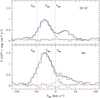 |
Fig. 4 SOAR GHTS 1D spectrum (black thick histogram) with two- Gaussian fit of the [N II] (top) and Hα (bottom) emission lines (thin black line). Individual Gaussian curves are shown in blue and red and the residuals of the fit with a black thin histogram. The systemic velocity of HaTr 5 and J17014-4306, and the velocity of the background nebular emission are marked by vertical solid (Vsys), dashed (VCV), and dotted (Vsky) lines, respectively. The spectral dispersion corresponds to ≃6.4 km s−1 per pixel. |
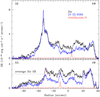 |
Fig. 5 Continuum-subtracted Hα (black solid line) and [N II] (blue solid line) surface brightness profiles of HaTr 5 along the SE-NW at PA=135° (top) and NE-SW PA=45° (bottom) directions extracted from the high-dispersion SOAR GOODMAN spectra. The continuum emission scaled-down by a factor of four is shown in red, where the location of background stars registered by the slit provide accurate fiducial points. The horizontal thin-dotted line in the bottom panel marks the average value of the Hα surface brightness. The magenta line in the bottom-panel is a synthetic Hα emission line profile broadly describing the observed one (see text). Note that the surface brightness of the [N II] emission line is generally smaller than that of Hα, but at the southeast and southwest nebular edges. |
4 Discussion
The nebular properties of HaTr 5 derived in the previous section allow for the assessment of its true nature. The observed expansion of HaTr 5 definitely discards it to be a Strömgren sphere around a hot WD, thus it remains to find out whether it is a nova remnant (Nova Sco 1437) or a PN.
4.1 HaTr 5 as Nova Sco 1437
If HaTr 5 were the nova remnant associated with Nova Sco 1437, then its distance would be that of its putative progenitor J17014- 4306. According to the latest Gaia data release DR3, the distance to J17014-4306 (Gaia source ID 5966150998003864960) is 988 ± 37 pc (see, e.g., Bailer-Jones et al. 2021).
This distance implies a nebular ionized mass of 0.059 ± 0.003 M⊙, a density ≃50 cm−3, and a physical radius of 0.24±0.01 pc. This mass is compared (top-left panel Fig. 6) with theoretical predictions of mass ejected by CNe with WD mass of 1.00, 1.25, and 1.40 M⊙ (Yaron et al. 2005). Models with a WD mass of 1.25 and 1.40 M⊙ have the shortest values of t3, which fit the short decline time of Nova Sco 1437 of ≈14 days. This decline time, however, has been questioned by the interpretation of historical Korean records (Hoffmann 2019). Moreover the distance of 988 pc towards J17014-4306 implies a lower WD mass, ≃1.0 (Shara et al. 2017). Therefore models with a WD mass of 1.00 M⊙ have also been included in the comparison in the top-left panel Fig. 6; whereas models with even lower WD mass, with overly large values of t3, ≥438 days, are not considered here.
This figure shows that the mass of HaTr 5 at this distance is at least 104 times larger than expected for a nova remnant. If it were assumed that the nova remnant has snow-plowed material from the ISM, the volume evacuated by HaTr 5, corresponding to a mass ≈0.0029 × nISM M⊙, would require an unusually high ISM density of ≈20 cm−3. The expansion onto a high-density, cold ISM can be expected to have swept up significant amounts of dust to make detectable its infrared emission, which is otherwise not detected in Spitzer images. It must be noted, however, that shocks in the nova ejecta may be very efficient in destroying dust grains (Gehrz et al. 1998), but the present low expansion velocity of the shell puts this option into question.
The expansion velocity of 27 km s−1 of HaTr5 also falls well below the expectation for a CN (top-right panel of Fig. 6).
Shara et al. (2017) assumed its current expansion velocity to be 300 km s−1 , which is much higher than the one in fact measured. Thus, these authors argued that the initial expansion velocity of the nova remnant had been slowed down by snow-plowing ISM material. However, their adopted nova remnant deceleration rate, based on the conclusions of the analysis of the expansion of four nova remnants (Duerbeck 1987), has been put into question following the analysis of much higher quality data of three out of these four nova remnants; namely, GK Per, V476 Cyg, and DQ Her. These recent findings actually support the notion that they are in free expansion after having experienced negligible deceleration (Liimets et al. 2012; Santamaría et al. 2020). By assuming linear momentum conservation, the expansion velocity of a shell produced by the nova remnant depends only on the initial velocity of the ejecta and the ratio between the mass ejected and present mass. Thus, the observed velocity and shell mass exceeds any possible combination of the ejecta mass and velocity for a CN (left-bottom panel of Fig. 6).
The systemic velocity of HaTr5, ≃−1 km s−1, also differs notably from that of J17014-4306, −46 km s−1 (Shara et al. 2017). Based on the assumption that HaTr 5 consists mostly of ISM material swept-up by the ejecta of Nova Sco 1437, its systemic velocity should match that of the ISM; however, the velocity of the nebular material along the line of sight is also different, ≃−10 km s−1 .
Finally, the morphology of HaTr 5, with a density enhancement towards the south-southeast direction, is indicative of a possible interaction with the ISM of a nebula moving along this direction. The PA of this bow-shock-like feature, ≈125°, is mostly orthogonal to the proper motion of J17014-4306, which is aligned along PA ≃203°.
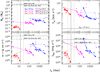 |
Fig. 6 Comparison of the mass (top-left), expansion velocity (top-right), linear momentum (bottom-left), and kinetic energy (bottom-right) of HaTr5 as a PN (horizontal solid line) and as Nova Sco 1437 (horizontal dashed line) with theoretical expectations of CNe for 1.00 M⊙, 1.25 M⊙ (magenta) and 1.40 M⊙ (red) WD of effective temperature 10 000, 30 000, and 50 000 K as labeled in the top-left panel (Yaron et al. 2005). The vertical solid (dotted) line corresponds to the visibility time of 14 days (7 and 28 days) of Nova Sco 1437 as registered in historical records. |
4.1.1 HaTr 5 as Nova Sco 1437 … but closer
The Gaia parallax (and thus the distance) to variable sources projected against diffuse nebular emission, as it is the case of CN progenitors, might be affected by systematic errors (e.g., Schaefer 2018; Harvey et al. 2020; Tappert et al. 2020). This does not seem to be the case for J17014-4306, whose Gaia DR3 parallax measurements are quite solid (Gaia Collaboration 2023) and imply a distance consistent with that of  pc derived by Schaefer (2022). Even then, let us consider a closer distance towards HaTr 5, which would result in a smaller value of the ionized mass.
Using the theoretical predictions on the initial ejecta mass and its average velocity (Yaron et al. 2005), the current expansion velocity (27 km s−1) and age of the nova remnant (≃590 yrs) have been used to constrain the required ISM density to match these values. As a result, the nebular radius and mass of the nova remnant can be derived under the assumption of linear momentum conservation
 (6)
(6)
In Fig. 7, these are compared with the nebular radius and ionized mass of HaTr 5 at different distances, where models requiring unphysical ISM densities above 20 cm−3 are marked as open symbols.
Depending on the input momentum according to the theoretical CN nova models of Yaron et al. (2005), the final nebular radius at the age of Nova Sco 1437 is in a narrow range, 0.48– 0.58 pc, but the swept-up ionized mass varies from 10−6 up to 0.02 M⊙. There is no agreement between the predictions for CN remnants and the observed nebular radius and ionized mass unless the distance to the nova remnant is of the order of 200– 250 pc, which is four to five times smaller than the Gaia distance to J17014-4306 and seems to be precluded by the small Gaia’s distance error bar of 37 pc. Even then, the agreement is only reached at the expenses of an unphysically dense ISM.
4.2 HaTr 5 as a PN
On the assumption that HaTr 5 is a PN, its physical radius and subsequently its distance can be derived from the so-called reddening-corrected Hα SB-radius relationship,
 (7)
(7)
where SB(Hα) is the reddening-corrected Hα SB in units of erg cm−2 s−1 sr−1 and R is the nebular radius in pc (Frew et al. 2016). Thus, given the reddening-corrected Hα SB of 3.5 × 10⁻⁵ erg cm−2 s−1 sr−1, it results in a physical radius of 0.55 ± 0.05 pc according to Eq. (7). The angular radius of 50.5 arcsec thus implies a distance of 2250±280 pc. According to Eq. (3), the mass of HaTr5 is 0.47 M⊙, which is about eight times higher than the mass at the distance of J17014-4306. This mass is very typical for a PN. Its rms density would be ≃35 cm−3. It must be noted that, although the volume occupied by HaTr 5 at this distance is now significantly larger, the ISM mass snowplowed, ≈0.02 × nISM M⊙, would still be negligible for typical densities (≈1 cm−3) of the ISM.
These values compare relatively well with those presented by Frew et al. (2016), which derived a physical radius 25 per cent smaller (0.41 pc), a distance 35 per cent smaller (1470 pc), and an ionized mass 43 per cent smaller (0.27 M⊙). The smaller physical radius, distance, and ionized mass are caused by their larger observed Hα flux and adopted logarithmic extinction coefficient, which result in an intrinsic Hα flux and surface brightness about three times larger than those used here.
The larger extinction towards HaTr5 (AV = 1.7–1.9 mag) than J17014-4306 (AV = 1.1 mag, as implied by the moderate reddening of its spectrum, Shara et al. 2017) also supports a larger distance for the nebula than for the CV. Indeed the reddening maps based on the inversion of color excess measurements provided by the STructuring by Inversion the Local Interstellar Medium (Stilism, Capitanio et al. 2017) web site5 remarkably confirm the different distances proposed for the CV and the nebula: the extinction at the distance of J17014-4306 is E(B – V) of 0.36 ± 0.11 mag (i.e., AV = 1.12 ± 0.34 mag), and it increases to 0.59 ± 0.10 mag (i.e., AV = 1.83 ± 0.31 mag) at 2085 pc, which is the maximum distance probed by Stilism along this direction, but within the uncertainty range of the PN distance of 2250 ± 280 pc.
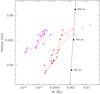 |
Fig. 7 Ionized mass and linear radius of nova remnants of theoretical CNe for 1.25 M⊙ (magenta) and 1.40 M⊙ (red) WDs of different temperatures (Yaron et al. 2005) as labeled in the top-left panel of Fig. 6. The solid line corresponds to the ionized mass to distance relationship of 0.061 × (D/1kpc)5/2 M⊙ derived for HaTr5 based on its intrinsic Hα flux, angular diameter, and filling factor (Eq. (3)). Models requiring ISM density above 20 cm−3 are marked as open symbols. |
4.2.1 The nebular spectrum of HaTr 5
The previous classification of HaTr 5 as a “possible PN” by Parker et al. (2016) was motivated by the large [S II] to Hα line ratio of its nebular spectrum and by the absence of a central star. We note that the spectroscopic investigation of large, low-surface-brightness nebulae is problematic, further hampered in the case of HaTr 5 by the difficult background subtraction caused by the diffuse emission along the line of sight. Indeed Parker et al. (2016) claimed a [S II] 6717+6731/Hα line ratio of 1.04 based on the 2014 SAAO spectrum, but the more recent 2024 SAAO spectrum reduces this ratio to 0.63, which is further brought down to 0.52 by Shara et al. (2017). The line ratios of HaTr 5 seem typical of supernova remnants, but the comprehensive set of photoionization simulations provided by the Mexican Million Models6 database (Morisset et al. 2015) shows it is also feasible for a PN to occupy this locus on diagnostic diagrams (see, e.g., Belfiore et al. 2025), Otherwise, the central star of an old PN can be expected to have a low luminosity (Miller Bertolami 2016), making it undetectable.
To model the nebular spectral properties of HaTr 5 and to derive key parameters characterizing the properties of its central star, we used the photoionization code Cloudy (version 23.0; Chatzikos et al. 2023). The model adopts a spherical shell geometry with two concentric shells, with an inner empty cavity. The shells are defined by three characteristic radii: an inner radius of rin = 0.12 pc, a middle radius of rmid = 0.35 pc, and an outer radius of rout = 0.55 pc. The inner and outer shells have number densities of nı = 15 cm−3 and n2 = 60 cm−3, respectively. The chemical abundances of the model were set to those reported by Aller & Czyzak (1983) for PNe, with increased S and N abundances by 10 and 13 per cent, respectively, and O abundances decreased by 15%. We used a blackbody spectrum for the incident radiation, varying the effective temperature (Teff) and stellar luminosity (L⋆) according to the stellar evolution models by Miller Bertolami (2016). The model emission line ratios were then used to constrain the model parameters, iteratively adjusting them to minimize the differences between observed and synthetic spectra.
The expected line ratios of the best-fitting model produce a noticeable agreement with the observed spectra (see Table 2). The parameters of this best-fitting model correspond to a blackbody spectrum with effective temperature of 93 000 K (log Teff = 4.97) and luminosity of 46 L⊙ (log(L⋆/L⊙) = 1.66). According to the evolutionary tracks of Miller Bertolami (2016), the parameters of such a star are consistent with a PN central star having a remnant mass of approximately 0.58 M⊙. The corresponding age of the star, inferred from these tracks, is greater than 10 000 yr. The atypically low [O III] λ5007 to Hα line ratio, but high [O II] λ3727 to [O III] λ5007 and [N II] and [S II] to Hα line ratios are most likely indicative of recombination processes caused by the decline of the ionizing flux, as seen in recombining haloes of PNe (Corradi et al. 2000).
4.2.2 The absence of a central star for HaTr 5
The spectral fitting of HaTr 5 implies an evolved central star. A late PN central star is also supported by the “relaxed” shell structure implied by its considerable thickness (Jacob et al. 2013), which reveals a low internal thermal pressure as expected for an evolved central star whose stellar wind mass-loss rate is diminished. At the distance of 2250 pc, the kinematic age of HaTr 5 is 20 000±2300 yr. This kinematic age can only be considered indicative of an evolved PN, as the kinematic age of a PN can be very different from its “real” age (the time since its progenitor entered the post-Asymptotic Giant Branch phase). Actually, for an evolved PN with a central star with Teff of 93 000 K, hydrodynamical simulations show that the real age is in the range 0.5–1.0 times the kinematic age, depending on the initial mass of the progenitor and envelope structure (Fig. 4 in Schönberner et al. 2014). Thus, the nebular kinematic age implies a true age in the range 10 000–20 000 yr, consistent with the age of the progenitor star.
Using the parameters derived from the Cloudy model, namely, log(Teff) = 4.97 and log(L/L⊙) = 1.66, and its distance, the expected u and 𝑔 magnitudes of the central star ionizing HaTr 5 can be computed. For this, the blackbody model adopted for the star was integrated over the respective OmegaCAM filter transmission curves as obtained from the publicly accessible page SVO Filter Profile Service “Carlos Rodrigo.”7 Thus, at the distance towards HaTr 5 its central star would have u and g magnitudes of 30.2 and 31.4 mag, respectively. These values are much larger than the limiting magnitudes of VPHAS+ in the u and g bands of 21.8 and 22.6 mag, respectively.
Consequently, our photoionization Cloudy model predicts that the central star of HaTr 5 is way too faint to be detected in the VPAHS+ u and 𝑔 images. Indeed the four stars projected onto HaTr 5 detected in the VPHAS+ u-SDSS image, as marked in the top-left panel of Fig. 1, have u-SDSS and g-SDSS magnitudes (Table 3) much smaller than those expected from the central star of HaTr 5. The brightest and bluest star, marked #4, is J17014- 4306, which has an intrinsic u – 𝑔 color of −0.70 mag, after an extinction correction, AV = 1.8 mag, is applied. The closest star to the nebula center8, about 6.3 arcsec northwest, marked #3, is the Gaia source ID 5966150998003866368. This was selected as the very likely central star of HaTr 5 by González-Santamaría et al. (2021), with an intrinsic ( GBP – GRP)o of −2.16 mag below their threshold of −0.2 mag for an ionizing source. It must be noted, however, that the value of the extinction correction used in that work (AV = 27.9 mag), computed from Gaia ’s photometric measurements, differs notably from the value derived here for the nebula. After the extinction correction, AV = 1.8 mag, of the nebula is applied, the intrinsic (u - g)o and (GBP - GRP)o colors would be +0.50 mag and +1.0 mag, respectively, which are not consistent with the central star of a PN (unless the presence of a companion star were to be claimed, Augusteijn et al. 2008), but with a star with the effective temperature ≃6630 K provided by the Gaia database. In summary, none of the stars detected in the present VPHAS+ u-SDSS band image can be associated with HaTr 5, which is consistent with a low-luminosity PN central star.
Stars projected onto HaTr 5 detected in the VPHAS+ u image.
5 Final remarks
Shara et al. (2017) had argued that the CV J17014-4306 is the historical Nova Sco 1437 and that the nebula HaTr 5 is the associated nova remnant based on their proper-motion measurements of J17014-4306 (µα = −12.7 ± 1.8 mas yr−1, µδ = −27.7 ± 1.2 mas yr−1), which placed it close to the center of HaTr 5 by the time of the nova event. Recent more accurate Gaia DR3 proper-motion measurements of this star (source ID 5966150998003864960), however, reduced them by a factor of 3 (µα = −4.14 ± 0.05 mas yr−1, µδ = −9.701 ± 0.036 mas yr−1), placing J17014-4306 offset from the center of HaTr 5 by the time of Nova Sco 1437 eruption. Although this correction does not really seem relevant (see, e.g., Hoffmann 2019), it adds to the different radial systemic velocities of HaTr5 (−1 km s−1) and J17014-4306 (−46 km s−1) and to the almost orthogonal PAs of the proper-motion of J17014-4306 (PA ≃203°) and orientation of the intensity enhancement of the nebular emission of HaTr 5 (PA ≈125°).
Most of the nebular properties of HaTr 5 presented here support it to be a textbook evolved PN. In particular, its ionized mass is much larger than expected for a nova remnant, while its expansion velocity (<30 km s−1) is much smaller. Models of CNe appropriate for the speed class of Nova Sco 1437 fail to provide the linear momentum of the expanding nebula. Incidentally, it must be noted that J17014-4306 would have been ≈3 arcmin away from the nebula center when the PN formed, making it very unlikely its WD to have been the progenitor of this PN.
HaTr 5 had been in the past conservatively classified as a possible PN (Parker et al. 2016) given that its central star is not detected in available photometric surveys and that its optical spectrum displays a notably large value of the [S II] to Hα line ratio (in the range ≈1.0 to ≈0.5), which is suggestive of shocks as found in supernova or nova remnants. The analysis of its spectrum using a Cloudy model, however, supports that the observed line ratio is consistent with an old evolved PN whose central star is faint and hot. Such star would be undetectable at the distance towards HaTr 5 of 2.25 kpc under the assumption it is a PN.
We conclude that the nebular properties of HaTr 5 are consistent with those of an old, evolved PN rather than a nova remnant. Its association with the CV J17014-4306 is spurious and thus HaTr 5 cannot be identified with the remnant of Nova Sco 1437, neither does it provide any constraints on the transition time from nova-like binaries to dwarf novae, as proposed by Shara et al. (2017).
Acknowledgements
The authors acknowledge the helpful comments and suggestion of an anonymous referee that helped greatly to improve the scientific content of this manuscript. M.A.G. acknowledges financial support from grants CEX2021-001131-S funded by MCIN/AEI/10.13039/501100011033 and PID2022-142925NB-I00 from the Spanish Ministerio de Ciencia, Innovación y Universidades (MCIU) cofunded with FEDER funds. E.S. is funded by UNAM DGAPA postdoctoral fellowship. G.L. acknowledges CAPES (proc. 88887.948597/2024-00). E.S., J.B.R.G., and J.A.T. thank support by UNAM PAPIIT project IN102324. Q.A.P. thanks the Hong Kong Research Grants Council for GRF research support under grants 17326116 and 17300417. D.R.G. acknowledges FAPERJ (E-26/200.527/2023) and CNPq (315307/2023-4) grants. A.R. and H.Y. thank HKU and QAP for provision of postdoctoral and PhD scholarship funds from RMGS grant awarded to the LSR. This research has made use of the software ASTROPY (Astropy Collaboration 2013, 2018), Cloudy (Ferland et al. 2013), and Source Extractor (Bertin & Arnouts 1996), and an extensive use of NASA’s Astrophysics Data System (ADS). This research has made use of the NASA/IPAC Infrared Science Archive, which is funded by the National Aeronautics and Space Administration and operated by the California Institute of Technology. This work is based on archival data obtained with the Spitzer Space Telescope, which was operated by the Jet Propulsion Laboratory, California Institute of Technology under a contract with NASA. Support for this work was provided by NASA, on observations obtained at the Southern Astrophysical Research (SOAR) telescope, which is a joint project of the Ministério da Ciencia, Tecnologia, e Inovação (MCTI) da República Federativa do Brasil, the U.S. National Optical Astronomy Observatory (NOAO), the University of North Carolina at Chapel Hill (UNC), and Michigan State University (MSU), on data products from observations made with ESO Telescopes at the La Silla Paranal Observatory under programme ID 177.D-3023, as part of the VST Photometric Hα Survey of the Southern Galactic Plane and Bulge (VPHAS+), on data products of the SuperCOSMOS H-alpha Survey (SHS), and on observations made with the CCDSPEC, SpUpNIC, and SALT instruments at the South African Astronomical Observatory (SAAO).
References
- Aller, L. H., & Czyzak, S. J. 1983, ApJS, 51, 211 [NASA ADS] [CrossRef] [Google Scholar]
- Astropy Collaboration (Robitaille, T. P., et al.) 2013, A&A, 558, A33 [NASA ADS] [CrossRef] [EDP Sciences] [Google Scholar]
- Astropy Collaboration (Price-Whelan, A. M., et al.) 2018, AJ, 156, 123 [Google Scholar]
- Augusteijn, T., Greimel, R., van den Besselaar, E. J. M., et al. 2008, A&A, 486, 843 [NASA ADS] [CrossRef] [EDP Sciences] [Google Scholar]
- Bailer-Jones, C. A. L., Rybizki, J., Fouesneau, M., et al. 2021, AJ, 161, 147 [NASA ADS] [CrossRef] [Google Scholar]
- Belfiore, F., Ginolfi, M., Guillermo Blanc, G., et al. 2025, A&A, in press, https://doi.org/10.1051/0004-6361/202451934 [Google Scholar]
- Bertin, E., & Arnouts, S. 1996, A&AS, 117, 393 [NASA ADS] [CrossRef] [EDP Sciences] [Google Scholar]
- Bond, H. E., & Miszalski, B. 2018, PASP, 130, 094201 [NASA ADS] [CrossRef] [Google Scholar]
- Capitanio, L., Lallement, R., Vergely, J. L., et al. 2017, A&A, 606, A65 [NASA ADS] [CrossRef] [EDP Sciences] [Google Scholar]
- Chatzikos, M., Bianchi, S., Camilloni, F., et al. 2023, Rev. Mexicana Astron. Astrofis., 59, 327 [Google Scholar]
- Corradi, R. L. M., Schönberner, D., Steffen, M., et al. 2000, A&A, 354, 1071 [NASA ADS] [Google Scholar]
- Crause, L. A., Gilbank, D., Gend, C. van., et al. 2019, J. Astron. Telesc. Instrum. Syst., 5, 024007 [CrossRef] [Google Scholar]
- Dilday, B., Howell, D. A., Cenko, S. B., et al. 2012, Science, 337, 942 [NASA ADS] [CrossRef] [Google Scholar]
- Drew, J. E., Gonzalez-Solares, E., Greimel, R., et al. 2014, MNRAS, 440, 2036 [Google Scholar]
- Duerbeck, H. W. 1987, Ap&SS, 131, 461 [NASA ADS] [CrossRef] [Google Scholar]
- Ferland, G. J., Porter, R. L., van Hoof, P. A. M., et al. 2013, Rev. Mexicana Astron. Astrofis., 49, 137 [Google Scholar]
- Frew, D. J., & Parker, Q. A. 2010, PASA, 27, 129 [CrossRef] [Google Scholar]
- Frew, D. J., Parker, Q. A., &Bojic?ic´, I. S. 2016, MNRAS, 455, 1459 [Google Scholar]
- Gaia Collaboration (Vallenari, A., et al.) 2023, A&A, 674, A1 [NASA ADS] [CrossRef] [EDP Sciences] [Google Scholar]
- Gehrz, R. D., Truran, J. W., Williams, R. E., et al. 1998, PASP, 110, 3 [NASA ADS] [CrossRef] [Google Scholar]
- González-Santamaría, I., Manteiga, M., Manchado, A., et al. 2021, A&A, 656, A51 [NASA ADS] [CrossRef] [EDP Sciences] [Google Scholar]
- Greenstein, J. L. 1984, ApJ, 276, 602 [NASA ADS] [CrossRef] [Google Scholar]
- Hartl, H., & Tritton, S. B. 1985, A&A, 145, 41 [NASA ADS] [Google Scholar]
- Harvey, E. J., Redman, M. P., Boumis, P., et al. 2020, MNRAS, 499, 2959 [CrossRef] [Google Scholar]
- Hoffmann, S. M. 2019, MNRAS, 490, 4194 [NASA ADS] [CrossRef] [Google Scholar]
- Honeycutt, R. K., Robertson, J. W., & Kafka, S. 2011, AJ, 141, 121 [NASA ADS] [CrossRef] [Google Scholar]
- Jacob, R., Schönberner, D., & Steffen, M. 2013, A&A, 558, A78 [NASA ADS] [CrossRef] [EDP Sciences] [Google Scholar]
- Liimets, T., Corradi, R. L. M., Santander-García, M., et al. 2012, ApJ, 761, 34 [NASA ADS] [CrossRef] [Google Scholar]
- Luridiana, V., Morisset, C., & Shaw, R. A. 2015, A&A, 573, A42 [NASA ADS] [CrossRef] [EDP Sciences] [Google Scholar]
- Miller Bertolami, M. M. 2016, A&A, 588, A25 [NASA ADS] [CrossRef] [EDP Sciences] [Google Scholar]
- Miszalski, B., Woudt, P. A., Littlefair, S. P., et al. 2016, MNRAS, 456, 633 [NASA ADS] [CrossRef] [Google Scholar]
- Morisset, C., Delgado-Inglada, G., & Flores-Fajardo, N. 2015, Rev. Mexicana Astron. Astrofis., 51, 103 [NASA ADS] [Google Scholar]
- Mróz, P., Udalski, A., Pietrukowicz, P., et al. 2016, Nature, 537, 649 [CrossRef] [Google Scholar]
- Osterbrock, D. E., & Ferland, G. J. 2006, Astrophysics of Gaseous Nebulae and Active Galactic Nuclei, 2nd edn., eds. D. E. Osterbrock, & G.J. Ferland (Sausalito, CA: University Science Books) [Google Scholar]
- Parker, Q. A. 2022, Front. Astron. Space Sci., 9, 895287 [NASA ADS] [CrossRef] [Google Scholar]
- Parker, Q. A., Phillipps, S., Pierce, M. J., et al. 2005, MNRAS, 362, 689 [NASA ADS] [CrossRef] [Google Scholar]
- Parker, Q. A., Bojicic, I. S., & Frew, D. J. 2016, J. Phys. Conf. Ser., 728, 032008 [NASA ADS] [CrossRef] [Google Scholar]
- Pottasch, S. R. 1984, Astrophysics and Space Science Library (Dordrecht: Reidel) [Google Scholar]
- Sahman, D. I., Dhillon, V. S., Littlefair, S. P., et al. 2018, MNRAS, 477, 4483 [NASA ADS] [CrossRef] [Google Scholar]
- Santamaría, E., Guerrero, M. A., Ramos-Larios, G., et al. 2020, ApJ, 892, 60 [CrossRef] [Google Scholar]
- Santamaría, E., Guerrero, M. A., Zavala, S., et al. 2022, MNRAS, 512, 2003 [CrossRef] [Google Scholar]
- Schaefer, B. E. 2018, MNRAS, 481, 3033 [NASA ADS] [CrossRef] [Google Scholar]
- Schaefer, B. E. 2022, MNRAS, 517, 6150 [NASA ADS] [CrossRef] [Google Scholar]
- Schönberner, D., Jacob, R., Lehmann, H., et al. 2014, Astron. Nachr., 335, 378 [CrossRef] [Google Scholar]
- Shara, M. 1984, JRASC, 78, 166 [NASA ADS] [Google Scholar]
- Shara, M. M., Livio, M., Moffat, A. F. J., et al. 1986, ApJ, 311, 163 [Google Scholar]
- Shara, M. M., Martin, C. D., Seibert, M., et al. 2007, Nature, 446, 159 [NASA ADS] [CrossRef] [Google Scholar]
- Shara, M. M., Ilkiewicz, K., Mikolajewska, J., et al. 2017, Nature, 548, 558 [CrossRef] [Google Scholar]
- Šimon, V. 2023, AJ, 165, 102 [CrossRef] [Google Scholar]
- Somers, M. W., Mukai, K., & Naylor, T. 1996, MNRAS, 278, 845 [NASA ADS] [CrossRef] [Google Scholar]
- Steffen, W., Koning, N., Wenger, S., et al. 2011, IEEE Trans. Visual. Comput. Graph., 17, 454 [CrossRef] [Google Scholar]
- Tappert, C., Ederoclite, A., Mennickent, R. E., et al. 2012, MNRAS, 423, 2476 [NASA ADS] [CrossRef] [Google Scholar]
- Tappert, C., Vogt, N., Ederoclite, A., et al. 2020, A&A, 641, A122 [NASA ADS] [CrossRef] [EDP Sciences] [Google Scholar]
- Tody, D. 1993, Astronomical Data Analysis Software and Systems II, 52, 173 [Google Scholar]
- van Dokkum, P. G. 2001, PASP, 113, 1420 [Google Scholar]
- Vogt, N., Tappert, C., Puebla, E. C., et al. 2018, MNRAS, 478, 5427 [NASA ADS] [CrossRef] [Google Scholar]
- Whitford, A. E. 1958, AJ, 63, 201 [NASA ADS] [CrossRef] [Google Scholar]
- Yaron, O., Prialnik, D., Shara, M. M., et al. 2005, ApJ, 623, 398 [Google Scholar]
For comparison the observed flux of the [N II] λ6584 emission line is 2.0 × 10⁻¹² erg cm−2 s−1, i.e., 0.85 times that of Hα. We note that Shara et al. (2017), by correcting the flux of their Hα+[N II] image by the Hα/[N II] ratio derived in the southeast corner of HaTr 5, where this ratio is minimal, inferred a lower Hα flux, ≃1.0 × 10⁻¹² erg cm−2 s−1.
Shara et al. (2017) determined the nebula center to be at α = 17:01:28.55 and δ = −43:05:59.3 (J2000).
All Tables
Measured line fluxes (F) and extinction corrected line intensities (I) of HaTr 5, together with synthetic line intensities.
All Figures
|
Fig. 1 VPHAS+ u-SDSS (top-left) and Hα+[N II] (top-right) images centered on HaTr 5 (field of view ≈4 arcmin) and a wide field of view (≈10.5 arcmin) SHS Hα+[N II] image (bottom-left) and Spitzer IRAC color-composite picture (bottom-right) of HaTr 5. Stars detected in the u band projected onto HaTr 5 are labeled on the u-SDSS image, whereas the location and orientation of the two SOAR GHTS long-slits are overlaid on the Hα image. On the Spitzer IRAC picture, red, green, and blue colors correspond to the IRAC4 8 µm, IRAC3 5.8 µm, and IRAC2 4.5 µm bands, respectively, whereas the location of the nebula is marked by a white circle. The wide field of view images in the bottom panels highlight the general diffuse emission around HaTr 5, with no obvious connection between the mid-IR and optical nebular emissions. |
| In the text | |
|
Fig. 2 SOAR (top), SAAO 2024 (middle), and SAAO 2014 (bottom) 1D spectra of HaTr 5. Emission lines are labeled on the SOAR and SAAO 2024 spectra. The left y-axis denotes flux, but surface brightness for the right y-axis. Note: the “artificial” extreme variations of the [O I] emission lines caused by poor sky subtraction for the SAAO 2024 spectrum and low S/N of the SAAO 2014 spectrum. The apparent [O I] emission lines in the SOAR spectrum are residuals of the sky subtraction as well. |
| In the text | |
|
Fig. 3 Spatio-kinematic information of HaTr 5 and the best SHAPE model. Left: SOAR GHTS Hα and [N II] (top) and SHAPE synthetic (bottom) PV diagrams. (center) HASH Hα+[N II] (top) and SHAPE synthetic (bottom) image. Right: SHAPE mesh models along the line of sight and from the plane of the sky along the southeast to northwest direction. |
| In the text | |
|
Fig. 4 SOAR GHTS 1D spectrum (black thick histogram) with two- Gaussian fit of the [N II] (top) and Hα (bottom) emission lines (thin black line). Individual Gaussian curves are shown in blue and red and the residuals of the fit with a black thin histogram. The systemic velocity of HaTr 5 and J17014-4306, and the velocity of the background nebular emission are marked by vertical solid (Vsys), dashed (VCV), and dotted (Vsky) lines, respectively. The spectral dispersion corresponds to ≃6.4 km s−1 per pixel. |
| In the text | |
|
Fig. 5 Continuum-subtracted Hα (black solid line) and [N II] (blue solid line) surface brightness profiles of HaTr 5 along the SE-NW at PA=135° (top) and NE-SW PA=45° (bottom) directions extracted from the high-dispersion SOAR GOODMAN spectra. The continuum emission scaled-down by a factor of four is shown in red, where the location of background stars registered by the slit provide accurate fiducial points. The horizontal thin-dotted line in the bottom panel marks the average value of the Hα surface brightness. The magenta line in the bottom-panel is a synthetic Hα emission line profile broadly describing the observed one (see text). Note that the surface brightness of the [N II] emission line is generally smaller than that of Hα, but at the southeast and southwest nebular edges. |
| In the text | |
|
Fig. 6 Comparison of the mass (top-left), expansion velocity (top-right), linear momentum (bottom-left), and kinetic energy (bottom-right) of HaTr5 as a PN (horizontal solid line) and as Nova Sco 1437 (horizontal dashed line) with theoretical expectations of CNe for 1.00 M⊙, 1.25 M⊙ (magenta) and 1.40 M⊙ (red) WD of effective temperature 10 000, 30 000, and 50 000 K as labeled in the top-left panel (Yaron et al. 2005). The vertical solid (dotted) line corresponds to the visibility time of 14 days (7 and 28 days) of Nova Sco 1437 as registered in historical records. |
| In the text | |
|
Fig. 7 Ionized mass and linear radius of nova remnants of theoretical CNe for 1.25 M⊙ (magenta) and 1.40 M⊙ (red) WDs of different temperatures (Yaron et al. 2005) as labeled in the top-left panel of Fig. 6. The solid line corresponds to the ionized mass to distance relationship of 0.061 × (D/1kpc)5/2 M⊙ derived for HaTr5 based on its intrinsic Hα flux, angular diameter, and filling factor (Eq. (3)). Models requiring ISM density above 20 cm−3 are marked as open symbols. |
| In the text | |
Current usage metrics show cumulative count of Article Views (full-text article views including HTML views, PDF and ePub downloads, according to the available data) and Abstracts Views on Vision4Press platform.
Data correspond to usage on the plateform after 2015. The current usage metrics is available 48-96 hours after online publication and is updated daily on week days.
Initial download of the metrics may take a while.