Fig. 2
Download original image
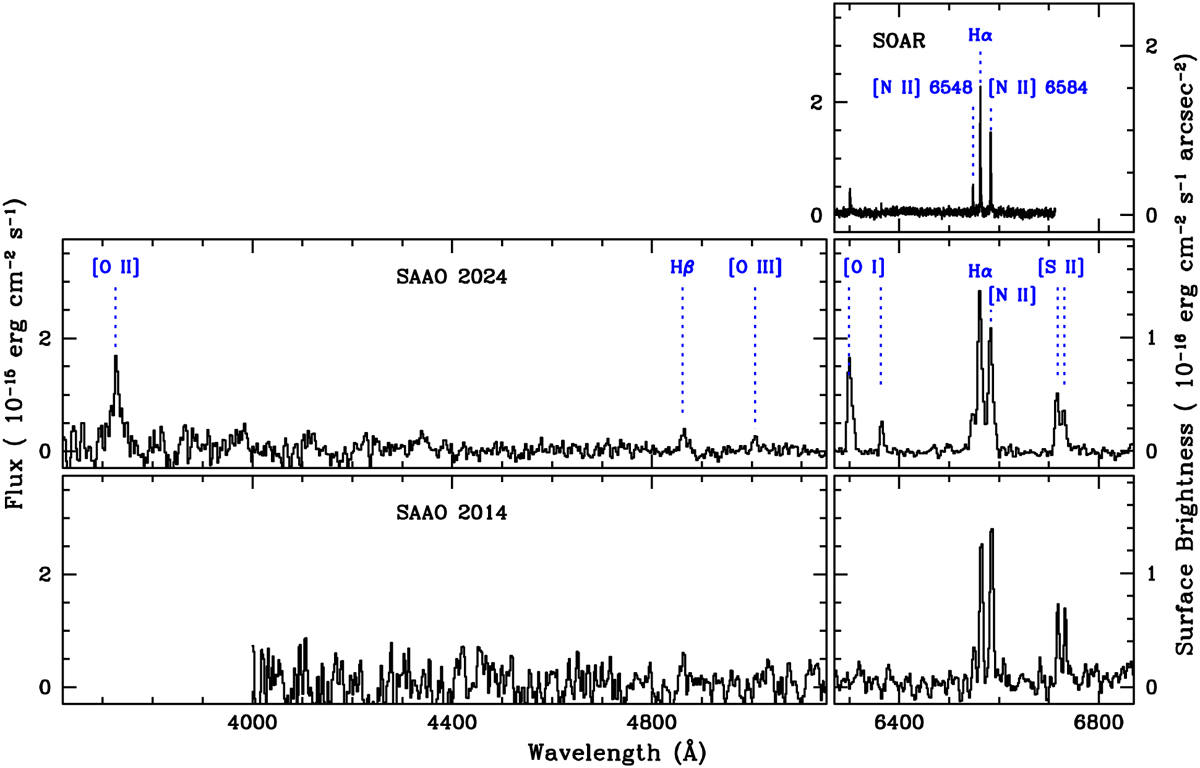
SOAR (top), SAAO 2024 (middle), and SAAO 2014 (bottom) 1D spectra of HaTr 5. Emission lines are labeled on the SOAR and SAAO 2024 spectra. The left y-axis denotes flux, but surface brightness for the right y-axis. Note: the “artificial” extreme variations of the [O I] emission lines caused by poor sky subtraction for the SAAO 2024 spectrum and low S/N of the SAAO 2014 spectrum. The apparent [O I] emission lines in the SOAR spectrum are residuals of the sky subtraction as well.
Current usage metrics show cumulative count of Article Views (full-text article views including HTML views, PDF and ePub downloads, according to the available data) and Abstracts Views on Vision4Press platform.
Data correspond to usage on the plateform after 2015. The current usage metrics is available 48-96 hours after online publication and is updated daily on week days.
Initial download of the metrics may take a while.