Fig. 1
Download original image
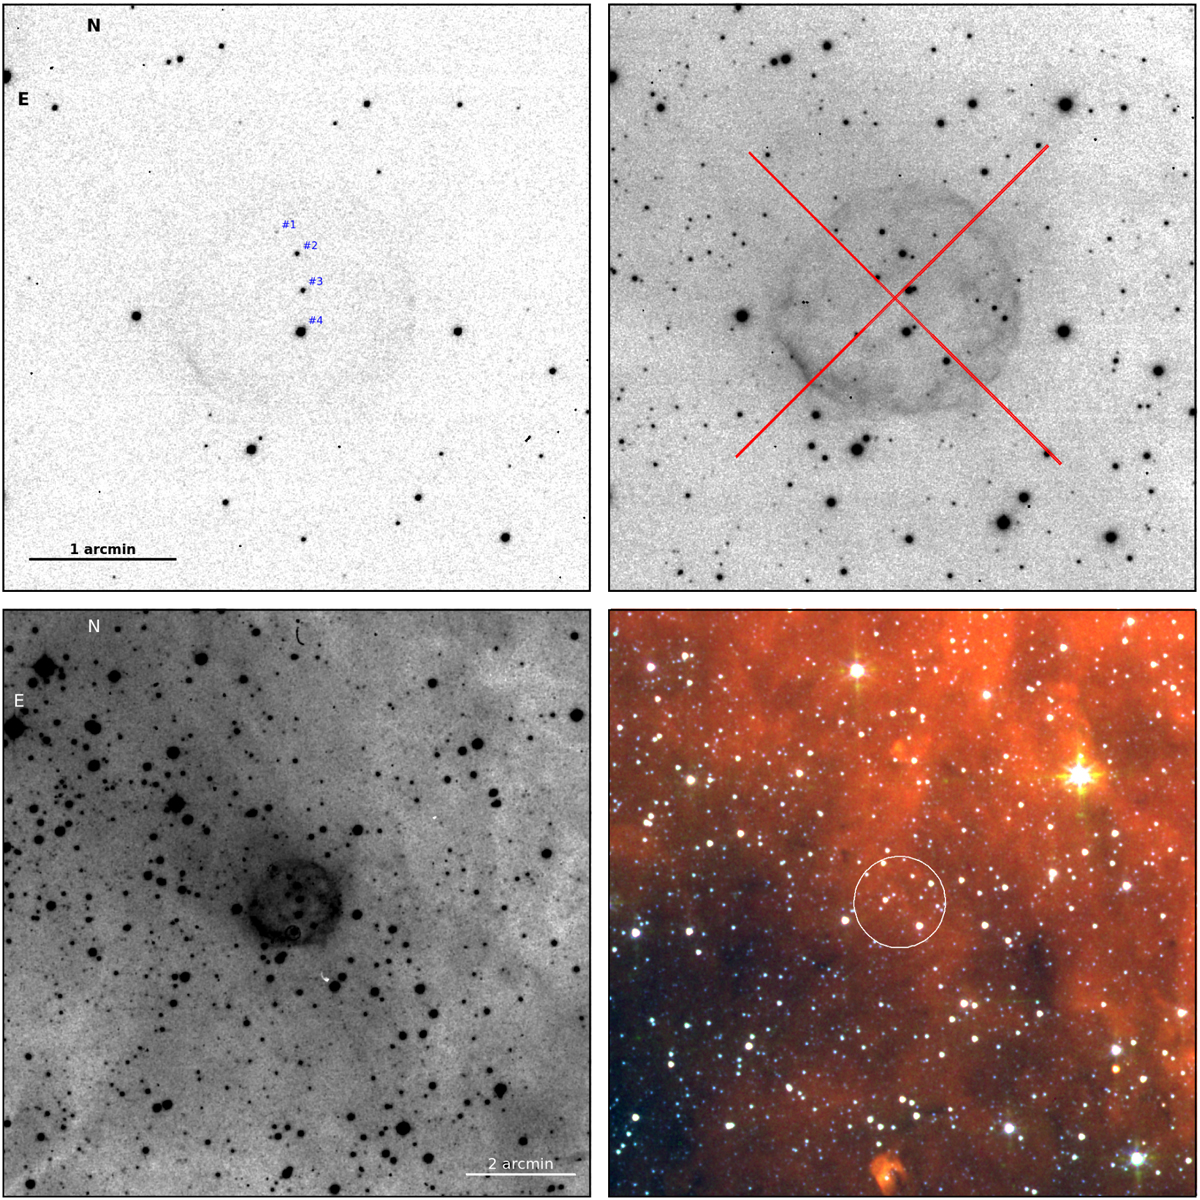
VPHAS+ u-SDSS (top-left) and Hα+[N II] (top-right) images centered on HaTr 5 (field of view ≈4 arcmin) and a wide field of view (≈10.5 arcmin) SHS Hα+[N II] image (bottom-left) and Spitzer IRAC color-composite picture (bottom-right) of HaTr 5. Stars detected in the u band projected onto HaTr 5 are labeled on the u-SDSS image, whereas the location and orientation of the two SOAR GHTS long-slits are overlaid on the Hα image. On the Spitzer IRAC picture, red, green, and blue colors correspond to the IRAC4 8 µm, IRAC3 5.8 µm, and IRAC2 4.5 µm bands, respectively, whereas the location of the nebula is marked by a white circle. The wide field of view images in the bottom panels highlight the general diffuse emission around HaTr 5, with no obvious connection between the mid-IR and optical nebular emissions.
Current usage metrics show cumulative count of Article Views (full-text article views including HTML views, PDF and ePub downloads, according to the available data) and Abstracts Views on Vision4Press platform.
Data correspond to usage on the plateform after 2015. The current usage metrics is available 48-96 hours after online publication and is updated daily on week days.
Initial download of the metrics may take a while.