Fig. 5
Download original image
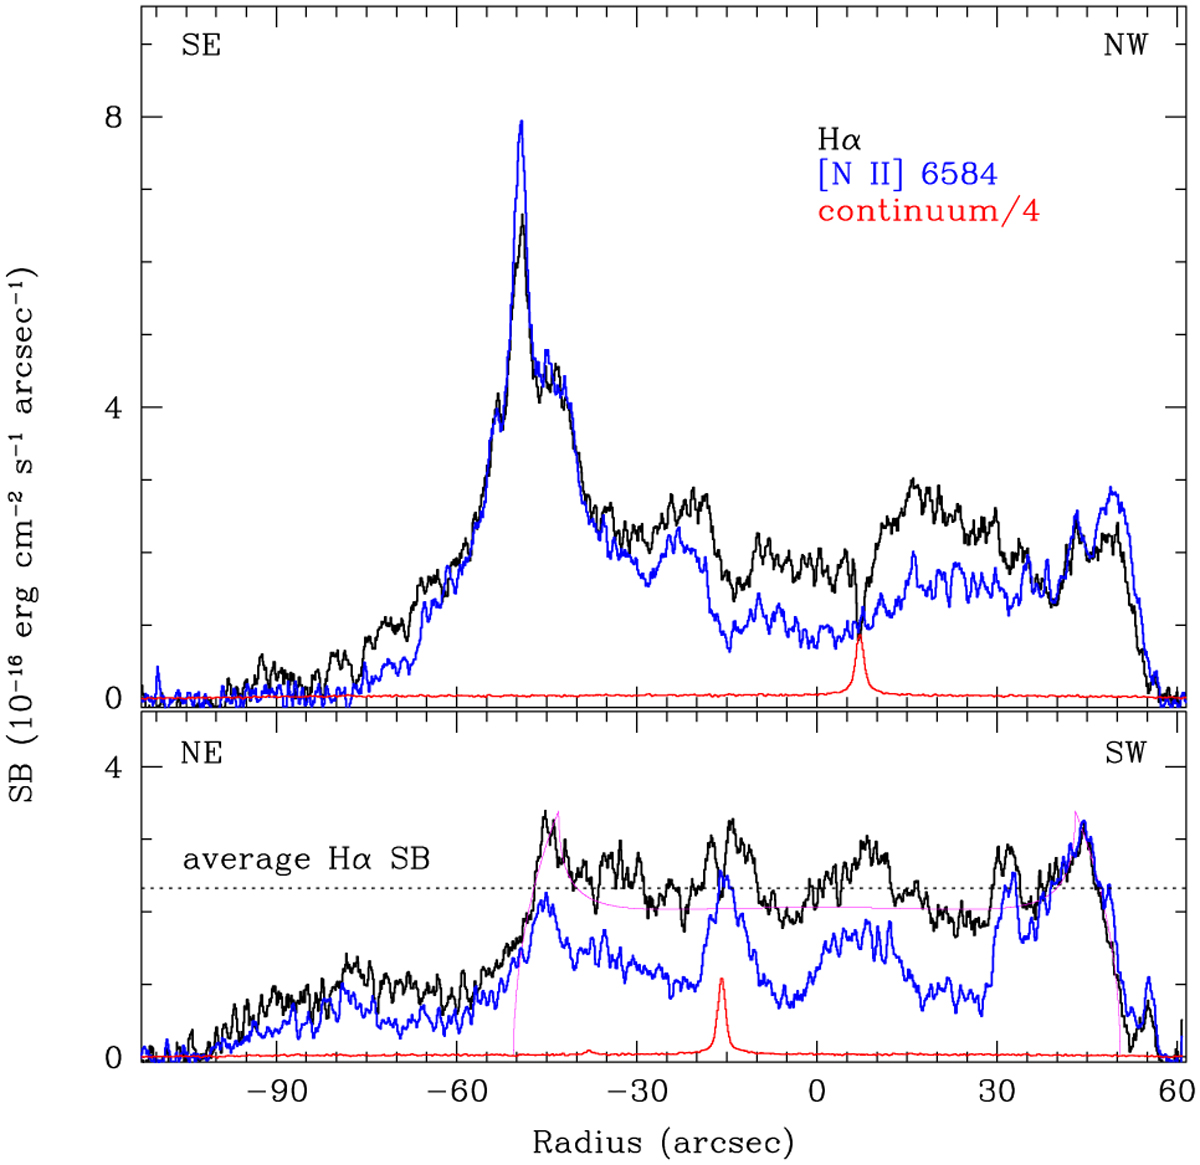
Continuum-subtracted Hα (black solid line) and [N II] (blue solid line) surface brightness profiles of HaTr 5 along the SE-NW at PA=135° (top) and NE-SW PA=45° (bottom) directions extracted from the high-dispersion SOAR GOODMAN spectra. The continuum emission scaled-down by a factor of four is shown in red, where the location of background stars registered by the slit provide accurate fiducial points. The horizontal thin-dotted line in the bottom panel marks the average value of the Hα surface brightness. The magenta line in the bottom-panel is a synthetic Hα emission line profile broadly describing the observed one (see text). Note that the surface brightness of the [N II] emission line is generally smaller than that of Hα, but at the southeast and southwest nebular edges.
Current usage metrics show cumulative count of Article Views (full-text article views including HTML views, PDF and ePub downloads, according to the available data) and Abstracts Views on Vision4Press platform.
Data correspond to usage on the plateform after 2015. The current usage metrics is available 48-96 hours after online publication and is updated daily on week days.
Initial download of the metrics may take a while.