Fig. 4
Download original image
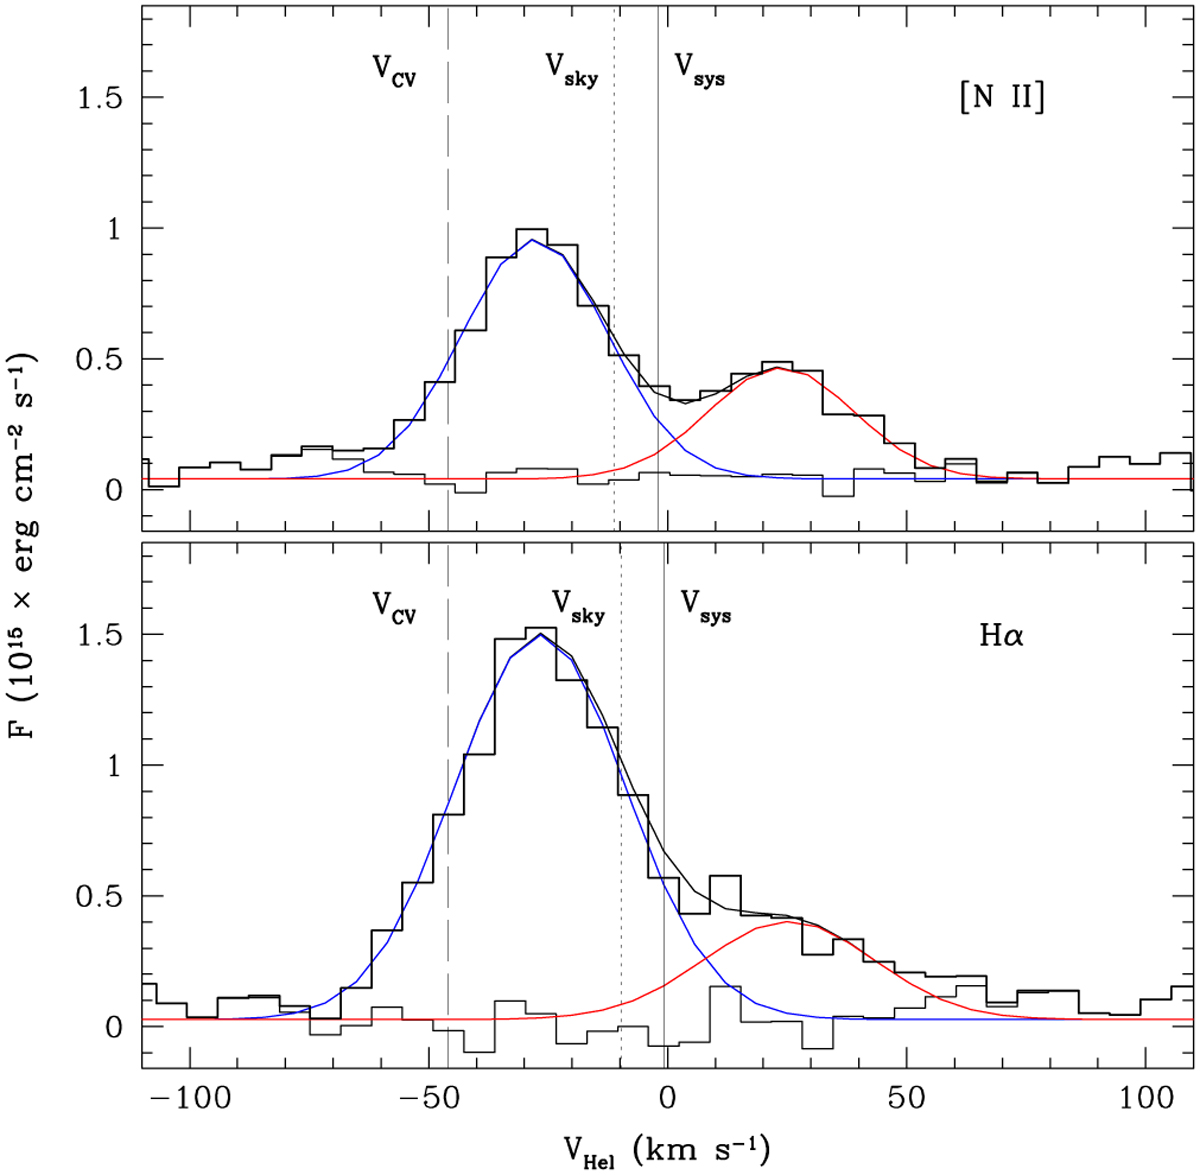
SOAR GHTS 1D spectrum (black thick histogram) with two- Gaussian fit of the [N II] (top) and Hα (bottom) emission lines (thin black line). Individual Gaussian curves are shown in blue and red and the residuals of the fit with a black thin histogram. The systemic velocity of HaTr 5 and J17014-4306, and the velocity of the background nebular emission are marked by vertical solid (Vsys), dashed (VCV), and dotted (Vsky) lines, respectively. The spectral dispersion corresponds to ≃6.4 km s−1 per pixel.
Current usage metrics show cumulative count of Article Views (full-text article views including HTML views, PDF and ePub downloads, according to the available data) and Abstracts Views on Vision4Press platform.
Data correspond to usage on the plateform after 2015. The current usage metrics is available 48-96 hours after online publication and is updated daily on week days.
Initial download of the metrics may take a while.