| Issue |
A&A
Volume 694, February 2025
|
|
|---|---|---|
| Article Number | A245 | |
| Number of page(s) | 9 | |
| Section | Extragalactic astronomy | |
| DOI | https://doi.org/10.1051/0004-6361/202451612 | |
| Published online | 19 February 2025 | |
Enhancing the localization of gravitational-wave hosts with SKYFAST: Rapid volume and inclination angle reconstruction
1
Dipartimento di Fisica e Astronomia, Università degli Studi di Firenze, Via Sansone 1, Sesto Fiorentino, (Firenze) I-50019, Italy
2
INFN, Sezione di Firenze, Sesto Fiorentino, (Firenze) I-50019, Italy
3
Dipartimento di Fisica “Enrico Fermi”, Università di Pisa, Largo Bruno Pontecorvo 3, Pisa I-56127, Italy
4
INFN, Sezione di Pisa, Largo Bruno Pontecorvo 3 Pisa I-56127, Italy
5
Dipartimento di Fisica e Astronomia “Galileo Galilei” Università di Padova, I-35131 Padova, Italy
6
INAF – Osservatorio Astronomico di Roma, Via Frascati 33, Monte Porzio Catone, (Rome) I-00078, Italy
⋆ Corresponding authors; This email address is being protected from spambots. You need JavaScript enabled to view it.
, This email address is being protected from spambots. You need JavaScript enabled to view it.
Received:
22
July
2024
Accepted:
14
January
2025
Abstract
Context. The scientific impact of GW170817 strongly supports the suggestion that we need an efficient electromagnetic follow-up campaign for gravitational-wave event candidates. The success of these campaigns critically depends on a fast and accurate localization of the source.
Aims. We present SKYFAST, an algorithm for the rapid identification of gravitational-wave hosts to optimize electromagnetic follow-up searches. The goal is to produce a list of the galaxies within the localization volume, ranked by their probability of being the host, along with an estimate of the inclination angle conditioned on the position of each galaxy.
Methods.SKYFAST runs alongside a full parameter estimation (PE) algorithm, from which posterior samples are taken. These samples are then used to reconstruct an analytical posterior of the sky position, luminosity distance, and inclination angle using a Dirichlet process Gaussian mixture model, which is a nonparametric Bayesian method.
Results. We show that SKYFAST can reconstruct an accurate localization using only a fraction (∼10%) of the total posterior samples produced by the PE. Moreover, SKYFAST generates a ranked list of the most probable hosts from a galaxy catalog of choice in a few minutes. This list includes information on the inclination angle posterior conditioned on the position of each candidate host. This breaks the degeneracy between inclination angle and luminosity distance.
Conclusions. The reconstruction of the posterior using fewer samples than the full PE can lead to significant time savings, depending on the PE algorithm employed. This is crucial for identifying the electromagnetic counterpart. The inclusion of the inclination angle information conditioned on the position of each galaxy can lead to an optimized electromagnetic follow-up.
Key words: gravitational waves / methods: data analysis / galaxies: general
© The Authors 2025
 Open Access article, published by EDP Sciences, under the terms of the Creative Commons Attribution License (https://creativecommons.org/licenses/by/4.0), which permits unrestricted use, distribution, and reproduction in any medium, provided the original work is properly cited.
This article is published in open access under the Subscribe to Open model. This email address is being protected from spambots. You need JavaScript enabled to view it. to support open access publication.
1. Introduction
The era of multi-messenger astronomy with gravitational waves (GWs) began on August 17, 2017, with the detection of the merger of the binary neutron star (BNS) GW170817 (Abbott et al. 2017a) by the Advanced LIGO (LIGO Scientific Collaboration 2015) and Advanced Virgo (Acernese et al. 2015) interferometers. This was immediately followed by the independent observation of the short gamma-ray burst (GRB) GRB 170817A by the Gamma-ray Burst Monitor on board Fermi (Goldstein et al. 2017) and the Spectrometer Anti-Coincidence Shield on board the International Gamma-Ray Astrophysics Laboratory (INTEGRAL) (Savchenko et al. 2017). An intense electromagnetic (EM) follow-up campaign was launched across the entire EM spectrum after this joint detection, and especially after the subsequent well-constrained, three-dimensional LIGO-Virgo source localization (see Abbott et al. 2017b and references therein). The campaign led to the discovery of an optical transient source, SSS17a/AT 2017gfo, located in the NGC 4993 galaxy (Coulter et al. 2017). This source was also observed in ultraviolet and infrared wavelengths and was then identified as a kilonova (Cowperthwaite et al. 2017; Evans et al. 2017; Arcavi et al. 2017a). The ensemble of all the GW and EM measurements associated with this event constitutes the first multi-messenger observation with GWs. This discovery led to a wide range of extraordinary results, including the identification that BNS mergers are progenitors of short GRBs, the evidence of a structure in GRB jets, the precise measurement of the GW propagation speed, and a new independent measurement of the Hubble constant (Mooley et al. 2018; Ghirlanda et al. 2019; Abbott et al. 2017c,d).
GW170817 remains the only multi-messenger GW event to date that was confidently measured (see, however, Graham et al. 2020; Connaughton et al. 2016; Ashton et al. 2021; Morton et al. 2023 and references therein), but we expect more multi-messenger events in the future as the sensitivity of GW facilities improves (see, e.g., Patricelli et al. 2022; Stratta & Pannarale 2022; Corsi et al. 2024; Colombo et al. 2022, 2024; Bhattacharjee et al. 2024). An EM counterpart is expected from the merger of binary systems that contain at least one neutron star, that is, BNSs and neutron star-black hole (NS-BH) binaries (Lattimer & Schramm 1974; Eichler et al. 1989). After the merger and subsequent GW generation, the GRB occurs, consisting of a prompt γ-ray emission with a duration of ≲2 s, and a multi-wavelength afterglow that is typically observable in the optical, X-ray, and radio bands for minutes, hours, days, and even months after the prompt emission. The optical and near-infrared transient associated with the kilonova is expected to appear hours or days after the prompt emission and progressively fade away. In this context, it is clear that a rapid and precise localization of the GW event is crucial for launching an effective EM follow-up campaign. When a GW event is detected, it currently takes from seconds to minutes for an initial estimate of the event localization with BAYESTAR (Singer & Price 2016), which is a Bayesian, non-Markov chain Monte Carlo (MCMC) algorithm for the rapid localization of GW events. The initial BAYESTAR volume maps are released to the astronomical community so that the hunt for the EM counterpart can start promptly (Singer et al. 2016a,b). However, to achieve a definitive, more precise localization of the GW event, the results of a full parameter estimation (PE) pipeline must be awaited, which generally takes longer because the posterior must be reconstructed for so many parameters, and because the sampling algorithms used to explore the likelihood are so complex.
We present SKYFAST, a new localization algorithm based on Bayesian nonparametrics. The code extends the idea introduced in Rinaldi & Del Pozzo (2022). SKYFAST takes as input the samples produced by a PE pipeline (e.g., LALInference; Veitch et al. 2015, Bilby; Ashton et al. 2019; Romero-Shaw et al. 2020; Morisaki et al. 2023, or JIMWong et al. 2023; Wouters et al. 2024) and uses them to reconstruct an analytic posterior distribution for the sky position, luminosity distance, and inclination angle of the GW event. The posterior is modeled as a weighted sum of multivariate Gaussians, whose weights, means, and covariance matrices are outcomes of a Dirichlet process Gaussian mixture model (DPGMM) (Del Pozzo et al. 2018; Rinaldi & Del Pozzo 2021). Specifically, we used the DPGMM implementation FIGARO (Rinaldi & Del Pozzo 2022, 2024).
Together with the reconstructed posterior, SKYFAST releases a skymap of the GW event and a ranked list of the most probable hosts from a galaxy catalog of choice. We used the GLADE+ catalog (Dálya et al. 2022) as an example to display the great potential of SKYFAST, but the algorithm can easily be adapted to work with any galaxy catalog. The ranked list includes the median and 90% credible intervals for the inclination angle posterior conditioned on the position of each galaxy. This information allows a specific modeling of the GRB structured jet emission based on the location of the event within the identified potential host galaxies. The inclusion of the inclination angle is a novel feature of SKYFAST. The LIGO-Virgo-KAGRA (LVK) Collaboration does not currently release the inclination angle posterior in the alerts for EM follow-up campaigns. We show that the inclination angle information provided by SKYFAST can be relevant for optimizing the follow-up tiling strategies and for tailoring the efforts to each candidate host, under the hypothesis that the GW event originated in that particular galaxy.
The features of the different PE algorithms determine how SKYFAST can be integrated into the pipeline. They also determine its speed performance, and which of its outputs can be used. Most importantly, SKYFAST can only be used to produce an intermediate analytical posterior reconstruction when the PE algorithm releases the samples during the analysis run, as is the case for MCMC samplers. This is not possible with nested-sampling algorithms, where posterior samples are only available at the end of the run. Nonetheless, SKYFAST can always be used on the final set of samples to produce a list of the most probable galaxy hosts. SKYFAST is publicly available1.
The paper is structured as follows: In Sect. 2 we outline the main features and outputs of SKYFAST; in Sect. 3 we validate its statistical robustness on a mock dataset of GW signals; in Sect. 4 we discuss the combination between SKYFAST and different PE algorithms, as well as the role SKYFAST can play in optimizing EM follow-up searches; and finally, we draw our conclusions in Sect. 5.
2. Executive summary
SKYFAST is a tool designed for the rapid reconstruction of the joint posterior of the localization parameters, namely, right ascension (α), declination (δ), luminosity distance (dL), and the inclination angle (θjn), which is defined as the angle between the direction of observation and the total angular momentum of the binary. To reconstruct the localization parameters, we followed the procedure discussed in Rinaldi & Del Pozzo (2022). A key difference, however, is that SKYFAST processes the posterior samples one by one, so that it can effectively work in parallel with any PE pipeline that releases the samples during the run. Moreover, differently from Rinaldi & Del Pozzo (2022) and from existing galaxy ranking tools (e.g., Salmon et al. 2020; NED 2019; Arcavi et al. 2017b; Ducoin et al. 2020), we also include the reconstruction of the inclination angle. The inclination angle is a key ingredient for estimating the expected temporal evolution of the multiwavelength flux associated with possible EM counterparts, such as GRB structured jet emission Ryan et al. (2020), and therefore, for evaluating their detectability.
SKYFAST takes the posterior samples produced by a PE pipeline as input and reconstructs an analytical posterior for the parameters {α, δ, dL, θjn} using FIGARORinaldi & Del Pozzo (2024), a publicly available2 inference code designed to estimate multivariate probability distributions using a DPGMM. A DPGMM is a nonparametric Bayesian method that, given a set of samples, reconstructs the distribution from which the samples were drawn as a mixture of multivariate Gaussians with means μk and covariances σk,
 (1)
(1)
where the number of components of the mixture NG and the mixing proportions wk are inferred from a Dirichlet process Ferguson (1973), Rasmussen (1999). For further details about the DPGMM, we refer to Del Pozzo et al. (2018) and Rinaldi & Del Pozzo (2021), who showed quantitatively that DPGMM can reconstruct a probability distribution that closely matches the actual distribution. To reconstruct the posterior distribution, samples are added to the mixture sequentially, one by one. If SKYFAST runs alongside an algorithm that produces posterior samples during the run, typically an MCMC, the Gaussian mixture is progressively updated as long as adding more samples no longer yields additional information. We quantitatively estimate the information encoded in the posterior using the information entropy, defined as in Shannon (1948),
 (2)
(2)
where pkN is the reconstructed posterior obtained with N samples, evaluated at the kth element of a discrete grid. S(N) is computed periodically as new posterior samples are added. Convergence is achieved when S(N) reaches a plateau, and, consequently, its derivative begins to oscillate around zero. This means that the posterior reconstructed with N samples has converged to the full PE posterior. We assume, as in Rinaldi & Del Pozzo (2022), that the reconstruction has converged to its target distribution when the derivative dS(N)/dN undergoes a given number of zero crossings. Empirical analysis shows that three zero crossings are an effective indicator of convergence. At this point, SKYFAST is ready to release an intermediate reconstructed posterior distribution that already contains the same amount of information as the posterior obtained using all samples.
For further details about the information entropy method we refer to Appendix A of Rinaldi & Del Pozzo (2022). Instead, when the PE is performed with nested sampling, posterior samples are generated directly at the end of the PE run. Therefore, depending on the PE method used to produce the posterior samples, one can choose whether to use SKYFAST in parallel with the PE algorithm, which saves time in the reconstruction of the localization posterior (MCMC), or after the PE, by passing all the samples at the end of the run (nested sampling).
The posterior obtained with SKYFAST is analytical, and because it is a mixture of Gaussians, it allows for the straightforward marginalization and conditioning on any subset of its parameters. Moreover, as shown in Rinaldi & Del Pozzo (2021), DPGMMs can reconstruct any probability distribution with a very good accuracy.
In the remainder of this section, we discuss the main outcomes of SKYFAST, using GW170817 as a reference example. Specifically, we used the posterior samples from Finstad et al. (2018)3.
The primary output of SKYFAST is the analytical joint posterior for {α, δ, dL, θjn}. In Figure 1, we compare the full PE posterior samples of GW170817 with the samples from posterior distributions reconstructed with SKYFAST. In particular, we used the posterior of the intermediate reconstruction, which is released immediately after convergence is reached. We considered all posterior samples, regardless of the PE algorithm used to generate them. For the purposes of this example, we computed the information entropy to determine how many samples are needed to accurately reconstruct the posterior of GW170817.
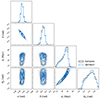 |
Fig. 1. Corner plot of the joint posterior distribution of {α, δ, dL, θjn} for GW170817. We compare the full PE posterior samples from Finstad et al. (2018) (black) with those obtained from the SKYFAST reconstruction after convergence is reached (blue). |
With an analytical posterior, it is straightforward to evaluate the probability of each galaxy in a given catalog of being the host of the GW event. We used the GLADE+ catalog Dálya et al. (2022), which is currently the most complete available catalog for EM follow-up of GW events. However, SKYFAST can easily be adapted to work with any catalog, which could be very useful for the specific requirements of different EM observatories. In its current form, SKYFAST produces a list of all galaxies from the GLADE+ catalog that fall within the 90% credible volume, ranked by their probability of being the host of the GW event according to their 3D position. Explicitly, the probability of being the host is obtained by evaluating the posterior distribution marginalized over the inclination angle at the position of each galaxy4.
In Figure 2 we show the sky localization region of GW170817 obtained using the intermediate posterior distribution, along with all the galaxies from the GLADE+ catalog that lie within its 90% credible volume, which is ∼150 Mpc3. In Table 1 we list the five most probable host galaxies for GW170817, with the true host, NGC 4993, in the third position.
Five most probable host galaxies for GW170817 from the GLADE+ catalog.
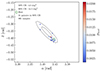 |
Fig. 2. Sky localization of GW170817 obtained from the intermediate posterior reconstruction. The solid black lines represent the 50% and 90% credible regions. The colored crosses denote the positions of galaxies from the GLADE+ catalog Dálya et al. (2022) that lie within the 90% credible region, ranked by their probability of being the host. The true host, NGC 4993, is marked with a green circle. |
We further exploited the analytical reconstruction of the posterior to condition the inclination angle distribution on the position of each galaxy that lay within the localization region. This breaks the degeneracy between dL and θjnUsman et al. (2019). Since the redshift measurements for most galaxies in the GLADE+ catalog are photometric, the uncertainty in the luminosity distance is typically on the order of a few percent and is hence non-negligible. To incorporate this uncertainty into our analysis, we assumed a Gaussian distribution for the measured galaxy distances and marginalized over it. In the last column of Table 1, we report the median value of θjn along with the 90% confidence intervals obtained from the posterior distribution conditioned on the position of each galaxy. These intervals encompass the uncertainty in the luminosity distance propagated from the error in the photometric redshift measurements. In Figure 3 we show a comparison between the inclination angle posterior distribution marginalized over the position parameters and conditioned on the position of NGC 4993. The conditioned posterior was computed by averaging over the distributions obtained by conditioning the posterior on 500 different positions drawn from a Gaussian distribution centered on the true NGC 4993 luminosity distance. The standard deviation was given by the photometric redshift measurement as reported in the GLADE+ catalog. The shaded areas denote the 68% and 90% credible regions. As expected, conditioning on a specific position instead of marginalizing over all position parameters results in a narrower inclination angle posterior. This occurs because fixing the position breaks the degeneracy between dL and θjn. Remarkably, the median value of θjn and its associated errors, obtained from the conditioned posterior for NGC 4993, are consistent with the values reported by Finstad et al. (2018)5.
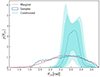 |
Fig. 3. Comparison between the inclination angle posterior distribution marginalized over the position parameters (green) and conditioned on the position of NGC 4993 (blue). The blue line shows the median of the distributions obtained by conditioning on 500 different positions extracted from a Gaussian distribution with the mean and standard deviation given by the photometric redshift measurement for NGC 4993 reported in the GLADE+ catalog. The shaded areas denote the 68% and 90% credible regions. For the sake of completeness, we added the histogram of posterior samples from Finstad et al. |
3. Validation of the algorithm on simulated datasets
In the following, we test the statistical robustness and performance of SKYFAST. In Section 3.1 we focus on the performance of intermediate posterior reconstruction, considering the typical fraction of samples and the time required to obtain the intermediate posterior distribution. We test its statistical robustness and provide a quantitative comparison with the final posterior. Although the primary intended use of SKYFAST is the localization of BNS events, we chose to test the algorithm using BBHs to evaluate its performance in a worst-case scenario. The detected BBHs are typically more distant than BNSs, which broadens their posteriors and potentially causes them to be harder to reconstruct with a DPGMM. The sampling configuration for BBHs is not meant to mimic a realistic situation, but rather to provide a scenario for testing the intemediate posterior reconstruction, especially in view of a Hamiltonian Monte Carlo (see Section 4 for further details on this topic). In Section 3.2 we instead show how SKYFAST performs in galaxy ranking, using BNS injected signals and closely following the PE settings used for low-latency PE by the LVK collaboration.
3.1. Intermediate posterior reconstruction
We tested the robustness of the intermediate reconstruction of the posterior distribution by running SKYFAST on a set of simulated BBH events. We injected 100 BBH signals into Gaussian noise based on the publicly available LVK sensitivity curves6. Specifically, we considered a network composed of the two advanced LIGO detectors and the advanced Virgo detector. For LIGO, we used the high-noise estimate for the fourth observing run (O4), and for Virgo, we used the power spectral density representative of the third observing run (O3) Abbott et al. (2016). We used the IMRPhenomD waveform Khan et al. (2016), Husa et al. (2016) for the signal injection and PE. The priors for all the parameters we used to generate the events are provided in Table 3. In particular, the localization parameters were randomly extracted from the GLADE+ catalog, resulting in a median luminosity distance of 954.7 Mpc, a median signal-to-noise ratio (S/N) of 18, and a recovery fraction of the 88%, setting S/N = 8 as the detection threshold. We used the Bilby-MCMC sampler Ashton & Talbot (2021) implemented in Bilby Ashton et al. (2019), Romero-Shaw et al. (2020), set to produce 5000 independent samples using ten parallel runs. Since we used an MCMC, the posterior samples were produced during the PE run and were saved periodically at checkpoints. With this setup, the median PE runtime was about one hour, and we therefore decided to save the checkpoints every five minutes.
In Figure 4 we compare the distribution of the total PE sampling time with the time required by SKYFAST to release the (intermediate) localization of the GW event. The latter was determined by the time that the PE algorithm took to produce the necessary number of samples for SKYFAST to meet the convergence criterion. Figure 5, on the other hand, shows the cumulative distribution of the ratio of the SKYFAST and PE runtimes. With this specific PE pipeline and settings, SKYFAST completed the intermediate posterior reconstruction, skymap generation, and ranking of the most probable host galaxies for 50%(90%) of the events in less than ∼20%(36%) of the total sampling time. The performance of SKYFAST is significantly influenced by the chosen PE pipeline and its specific configuration, as discussed further in Section 4.1. Figure 6 shows the cumulative distribution of the fraction of samples needed to achieve convergence. SKYFAST requires less than ∼11%(21%) of the total samples generated by the PE to achieve information entropy convergence and to reconstruct the intermediate posterior for 50%(90%) of the events. In contrast to naive expectations, the distribution of the sample fraction differs from that of the total PE time fraction shown in Figure 5. This difference is due to the burn-in inefficiency: During the initial burn-in period, the samplers produce correlated samples that cannot be used for analysis.
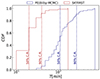 |
Fig. 4. Cumulative distribution of the total PE runtime and the time required by SKYFAST to produce the intermediate posterior reconstruction, the associated skymap, and the host galaxy ranking. We obtained the results shown in this plot using the Bilby-MCMC sampler to analyze 100 mock BBH events with the IMRPhenomD waveform. SKYFAST was run on Intel® Xeon® Gold 6140M processors with a 2.30 GHz clock rate. |
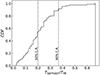 |
Fig. 5. Cumulative distribution of the fraction of the PE runtime needed for SKYFAST to achieve the information entropy convergence criterion and release all its outputs: Intermediate posterior reconstruction, skymap, and galaxy host ranking. The setup is the same as in Figure 4. |
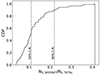 |
Fig. 6. Cumulative distribution of the fraction of total samples needed for SKYFAST to achieve the information entropy convergence criterion and release the intermediate posterior reconstruction, skymap, and galaxy host ranking. The setup is the same as in Figure 4. |
We tested the statistical robustness of the reconstructed intermediate posterior distribution by plotting the fraction of injected BBH events found within a credible region CRP as a function of the encompassed probability P for the single parameters α, δ, dL, and θjn, and the 2D and 3D localizations. The expected distribution is indeed a diagonal line. As shown in Figure 7, all the probability-probability plots lie on the diagonal within the 90% credible interval for the cumulative distribution computed from a beta distribution, as in Cameron (2011). This allowed us to assess that the intermediate posteriors reconstructed with SKYFAST are statistically unbiased.
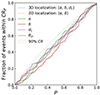 |
Fig. 7. Probability-probability plot for the intermediate posterior distributions of α, δ, dL, and θjn, and for the 2D and 3D localization posterior distributions. The dashed diagonal gray line shows the expected distribution, and the shaded areas show the corresponding 90% credible intervals. The setup is the same as in Figure 4. |
Last, to quantify how the intermediate and final marginal distributions differ, we computed the Jensen-Shannon (JS) distance, which for each parameter is around 0.05. This means that the intermediate distribution is very close to the final one.
3.2. Galaxy ranking
To evaluate the performance of SKYFAST in ranking the most probable hosts, we analyzed 50 simulated BNS signals. We injected these signals into Gaussian noise using the IMRPhenomD waveform, following the configuration discussed in Section 3.1. The binary parameters were extracted uniformly within the ranges in Table 3, except for the localization parameters, which were extracted randomly from the GLADE+ catalog, with a luminosity distance cut of 100 Mpc to have a reasonable number of galaxies in the localization volume. We performed the parameter estimation using Bilby with the DYNESTY sampler Speagle (2020), employing the reduced order quadrature (ROQ) technique Morisaki et al. (2023). This setup closely mirrors the online parameter estimation pipeline used by the LVK Collaboration7. However, with this configuration, posterior samples are only available at the end of the inference due to the nested-sampling scheme of DYNESTY. Consequently, we used SKYFAST directly on the final samples, that is, without the intermediate posterior reconstruction. In Table 2 we summarize the result of the injection and the ranking. Since the reconstruction of the posterior is based on a stochastic process, we tested the impact on the galaxy ranking by running SKYFAST another 50 times for each event. We found that the true host position is  out of
  galaxies in the localization region. Moreover, we tested the precision of the ranking between various events, and we found that the true host is ranked first 26 ± 6% of times, and within the top three (five) positions 44 ± 7% (51 ± 7%) of times.
Results of the injection and galaxy ranking for BNS signals.
Prior ranges for all parameters we used to simulate BBH and BNS injected signals.
The distribution of the time needed for SKYFAST to obtain the ranked host galaxy list from the posterior samples is shown in Figure 8. Most of the events require a runtime shorter than three minutes. The current online PE pipeline takes about 10 minutes on average to complete the inference for BNS events Morisaki et al. (2023). Our results suggest that by adding a few minutes, it is possible to obtain a list of the most probable host galaxies along with an estimate of the inclination angle conditioned on the position of each galaxy in the list8.
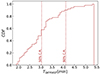 |
Fig. 8. Cumulative distribution of time needed by SKYFAST to reconstruct the posterior and to produce all the relevant information. The times refer to a Intel® Xeon® Gold 6140M processor with a 2.30 GHz clock rate. |
4. Discussion
In the following, we discuss the relevance of the various applications of SKYFAST. In Section 4.1 we describe that the performance of SKYFAST depends not only on the PE pipeline from which it takes the samples, but also on the specific setup within the same pipeline. In Section 4.2 we discuss the contribution that SKYFAST can make to optimize the EM follow-up searches. We highlight in particular that it is important to release the inclination angle information with the galaxy ranking.
4.1. Combination with different PE pipelines
We recall that the time-gain distribution shown in Figure 5 is sensitive not only to the algorithm used for the inference, but also to the specific PE setup. For example, running the same pipeline with more (fewer) independent samplers has the effect of decreasing (increasing) the time gain because of the burn-in inefficiency.
Releasing an accurate sky localization along with a list of potential host galaxies as soon as possible is of great relevance for GW events that are expected to have an EM counterpart, such as binary systems that contain at least one neutron star. The online PE in the LVK Collaboration currently uses the ROQ technique and the DYNESTY sampler. With this setup and using the IMRPhenomD waveform, the PE wall time for BNS events is about 10 minutes. As mentioned previously, it is not possible to access samples during the run with a nested sampler such as DYNESTY. Nonetheless, SKYFAST can still come into play immediately after the online PE process ends. By adding just a few minutes to the PE runtime, it becomes possible to generate an analytical reconstruction of the posterior using SKYFAST with all the samples produced by the PE. This posterior can then be used to generate a list of the most probable galaxy hosts within the GW event localization region, along with the associated estimate of θjn, as discussed in Section 2.
The full potential of SKYFAST can be realized when it is used in combination with Hamiltonian Monte Carlo (HMC) methods Neal (2012), which sample the posterior distribution more efficiently than traditional MCMC or nested-sampling methods. We have shown in Section 3.1 that SKYFAST can help to save a significant amount of time when it is used in combination with a Monte Carlo-based PE algorithm. However, a significant drawback of HMC algorithms is that they need to compute the gradient of the likelihood, and consequently, the gradient of the waveform. This task is computationally expensive and might make the entire pipeline inefficient. Based on the ongoing efforts in developing differentiable waveforms Margossian (2019), Edwards et al. (2024), Schmidt et al. (2021), we expect HMC to become the standard PE strategy in the future. A combination of SKYFAST with HMC would further reduce the time required to obtain accurate localization and galaxy host information.
4.2. Galaxy ranking and inclination angle
As discussed in the previous sections, SKYFAST produces a list of the galaxies within the 90% credible volume of the analyzed GW event, ranked according to their probability of being the host based on their position. When the PE pipeline that is used to produce the samples does not provide access to the samples during the run, SKYFAST can be run right after the inference is complete. It then generates the ranked list within minutes.
A feature that differentiates SKYFAST from other galaxy ranking tools (e.g., Salmon et al. 2020; NED 2019; Arcavi et al. 2017b; Ducoin et al. 2020) is that it can compute the inclination angle posterior conditioned on the position of each galaxy in the list. The LVK GCN notices and circulars currently do not include information on the inclination angle. However, we integrated this parameter into the SKYFAST posterior reconstruction as it could play a crucial role in optimizing the EM follow-up campaign. Specifically, the inclination angle of the binary system relative to our line of sight affects the multiwavelength light curve of possible EM counterparts such as GRBs. To further illustrate this point, we return to our working example, GW170817/GRB 170817A. In Figure 9, we plot the expected GRB afterglow light curves in the X-ray band, assuming the event is located in each of the first three galaxies listed in Table 1. We computed the light curves using afterglowpyRyan et al. (2020), assuming a Gaussian profile for the structured GRB jet. We adopted the best-fit GRB parameters for GW170817 obtained by Ryan et al. (2020) (see their Table 3). However, we used the luminosity distance and inclination angle values reported for each galaxy in Table 1. The shaded areas represent the uncertainties in the luminosity curves associated with the 90% credible intervals of the inclination angle estimate. The different inclination angle posteriors obtained by conditioning on the position of each galaxy have a significant impact on the afterglow peak luminosity and peak time. The vertical lines indicate the times when the luminosity peak is expected to occur if the event were located in each of the three potential hosts identified by SKYFAST, revealing an order-of-magnitude discrepancy that is mainly driven by variations in the inclination angle posteriors among the galaxies9. In certain cases (e.g., ESO 575−055 and partially, ESO 508−014), the smallest inclination angles within the 90% credible intervals are comparable to the half-width of the jet core. This means that a time-decreasing light curve is typically observed for GRBs that are viewed on-axis. The shape of the light curve affects the detectability of the EM emission. As an example, we compared the simulated X-ray light curves with the limiting luminosity that can be reached by Swift/XRT, considering an exposure time of 60 s and a distance of 40 Mpc. The afterglow could be detected until approximately 1.5 (2.5) days after the merger if the host galaxy were ESO 575−055 or ESO 508−014, respectively. To potentially detect the afterglow emission if the host galaxy were NGC 4993, a much longer exposure time is needed.
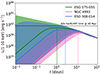 |
Fig. 9. Impact of different conditioned inclination angle posteriors on the expected GRB afterglow light curve in the X-ray band. The solid lines show the expected luminosity curve for the median inclination angle of each galaxy, as reported in Table 1. The shaded areas represent the uncertainty in the luminosity curve, reflecting the 90% credible intervals of the inclination angle. The dashed colored lines indicate the times of the luminosity peaks. We report the 60-second sensitivity limit of Swift/XRT Gehrels et al. (2004), Evans et al. (2016) at a distance of 40 Mpc, which is comparable to the distances of all potential hosts of GW170817. |
Our aim with the previous example was to show that the conditioned inclination angle posteriors, along with a GRB jet model and the sensitivity limits of various instruments at the distance of the potential host galaxy, play a crucial role in determining whether and when the afterglow emission can be observed with a specific EM facility. Since it strongly depends on the candidate host galaxy, the inclination angle information can be very useful for optimizing the observational strategy, thereby maximizing the chances of detecting a potential EM counterpart and identifying the true host galaxy. As a consequence, SKYFAST can significantly contribute to optimizing the EM follow-up campaign by providing essential information to design a tiling strategy tailored to each potential host galaxy in the list. Finally, the information on the inclination angle could be used to estimate the likelihood that a transient source that is detected during the EM follow-up campaign is the counterpart to (or is unrelated to) a GW event.
5. Conclusions
We presented SKYFAST, a new tool for the rapid localization of GW events and the ranking of the most probable galaxy hosts. SKYFAST uses Bayesian nonparametrics to reconstruct an analytical posterior distribution of the sky position, luminosity distance, and inclination angle from the posterior samples produced by a PE pipeline. If the PE algorithm produces posterior samples during the run, as in the case of MCMC or HMC, the reconstructed posterior is updated as new samples are produced. Since the DPGMM reconstruction typically requires fewer samples than the full PE, this feature leads to significant time gains, which can be crucial for the prompt identification of the EM counterpart. When the posterior samples are instead only available after the inference is completed, as in the case of nested-sampling algorithms, the reconstruction with SKYFAST is performed only at the end of the PE run.
Together with the reconstructed posterior, SKYFAST releases a list of all the galaxies from a catalog of choice that are contained within the 90% credible volume of the GW event, ranked by their probability of being the host. We used the GLADE+ catalog as an example, but the algorithm has the great advantage of being easily interfaced with any galaxy catalog. We tested SKYFAST on the posterior samples of GW170817. We found that the reconstructed posterior agrees with the final PE results and that the sky localization area is also compatible with the area reported in the literature. We ranked all the galaxies in the 90% credible volume, and the true host, NGC 4993, was the third most probable host. Based on the analytical form of the reconstructed posterior, SKYFAST can easily infer the inclination angle posterior conditioned on the position of each galaxy in the list. This not only breaks the degeneracy between dL and θjn, resulting in a more stringent inclination angle constraint, but also allows for more precise predictions of the GRB afterglow observed light curves that are expected if the GW event were located in each potential galaxy host. Interestingly, we found that the light curves can vary significantly among galaxies, mainly due to variations in the conditioned inclination angle posterior. The conditioned inclination angle posterior, combined with the sensitivity of different instruments at the distance of potential hosts, is crucial for predicting whether and when each instrument can detect GRB afterglow emission. This depends on the galaxy to which it is pointed and helps choose an optimal exposure time to maximize the chance of detection.
We tested the statistical robustness of SKYFAST by running it on a population of 100 simulated BBH events. We built PP-plots for the posteriors of all the reconstructed parameters, as well as for the 2D and 3D localizations. We found that the reconstructed posterior is unbiased and accurately describes the distribution from which the input samples are taken. Additionally, we found that SKYFAST is able to release the reconstructed posterior within one-fifth (one-third) of the total PE runtime for 50% (90%) of the GW events, using fewer than one-tenth (one-fifth) of the samples. However, we note that the exact values of the time and sample fractions depend on the PE pipeline used and its specific setup (e.g., the number of independent samplers and parallelization scheme). To test the performance of SKYFAST in ranking the most probable galaxy hosts, we ran it on 50 simulated BNS events. Specifically, we produced the input samples with Bilby, using a nested-sampling scheme accelerated with the ROQ technique. With this setup, the PE runtime is 8 minutes, while the SKYFAST runtime is 1−2 minutes on average. These times depend on the computational power of the machines that are used and can be further reduced with next-generation processors. Regarding galaxy ranking, given that the median luminosity distance of our BNSs was around 70 Mpc, we found an average of 30 galaxies in the 90% credible volume, with the true host in the fifth position.
In conclusion, SKYFAST is a lightweight and user-friendly tool designed to reconstruct analytical posteriors for the sky localization, luminosity distance, and inclination angle from posterior samples generated by a PE pipeline. The code achieves these tasks in a fraction of the PE runtime. Even when real-time sample access is not available during PE, SKYFAST can be launched immediately after PE completion to provide a ranked list of potential galaxy hosts within just one or two minutes. A novel feature of SKYFAST compared to other tools is the inclusion of the inclination angle information, which is crucial for astronomers to plan optimized EM follow-up strategies. Last, SKYFAST can be used offline for various purposes, such as cross-correlating GW events with different galaxy catalogs to infer values of H0 and other cosmological parameters.
The posterior samples are publicly available at https://github.com/sugwg/gw170817-inclination-angle
We converted the measured galaxy redshift to the luminosity distance using the Planck18 cosmology Planck Collaboration VI (2020).
The total runtime for this event is ∼1 minute on an Apple MacBook Pro with an M3 chip.
The LVK sensitivity curves are publicly available at https://dcc.ligo.org/LIGO-T2000012/public
All the findings presented in Section 3 were obtained running SKYFAST on Intel® Xeon® Gold 6140M processors with a 2.30 GHz clock rate. The runtime can be further reduced by using more powerful processors. For instance, the average time needed to run SKYFAST on a GW event with a few thousand samples on an Apple® M3 Pro chip is about one minute.
The differences among the various light curves arise not only from the different inclination angle posteriors obtained by conditioning on the positions of the various galaxies, but also from the positions of the galaxies themselves. However, because the localization volume found for GW170817 is limited, the impact of the positions is subdominant compared to that of the inclination angle reconstructions.
Acknowledgments
We thank the anonymous referee for useful comments that improved the manuscript. We thank Stefano Rinaldi for providing the scratch from which SKYFAST was developed and for his assistance with FIGARO. We thank Gianluca Maria Guidi and Francesco Pannarale for useful discussions and for carefully reading the manuscript. This material is based upon work supported by NSF’s LIGO Laboratory which is a major facility fully funded by the National Science Foundation. This work has been supported by the project BIGA – “Boosting Inference for Gravitational-wave Astrophysics” funded by the MUR Progetti di Ricerca di Rilevante Interesse Nazionale (PRIN) Bando 2022 – grant 20228TLHPE – CUP I53D23000630006. GD acknowledges financial support from the National Recovery and Resilience Plan (PNRR), Mission 4 Component 2 Investment 1.4 – National Center for HPC, Big Data and Quantum Computing – funded by the European Union – NextGenerationEU – CUP B83C22002830001. AR acknowledges financial support from the Supporting TAlent in ReSearch@University of Padova (STARS@UNIPD) for the project “Constraining Cosmology and Astrophysics with Gravitational Waves, Cosmic Microwave Background and Large-Scale Structure cross-correlations”.
References
- Abbott, B. P., Abbott, R., Abbott, T. D., et al. 2016, Liv. Rev. Relat., 19, 1 [NASA ADS] [CrossRef] [Google Scholar]
- Abbott, B. P., Abbott, R., Abbott, T. D., et al. 2017a, Phys. Rev. Lett., 119, 161101 [Google Scholar]
- Abbott, B. P., Abbott, R., Abbott, T. D., et al. 2017b, ApJ, 848, L12 [Google Scholar]
- Abbott, B. P., Abbott, R., Abbott, T. D., et al. 2017c, ApJ, 848, L13 [CrossRef] [Google Scholar]
- Abbott, B. P., Abbott, R., Abbott, T. D., et al. 2017d, Nature, 551, 85 [Google Scholar]
- Acernese, F., Agathos, M., Agatsuma, K., et al. 2015, Class. Quant. Grav., 32, 024001 [Google Scholar]
- Arcavi, I., Hosseinzadeh, G., Andrew Howell, D., et al. 2017a, Nature, 551, 64 [NASA ADS] [CrossRef] [Google Scholar]
- Arcavi, I., McCully, C., Hosseinzadeh, G., et al. 2017b, ApJ, 848, L33 [NASA ADS] [CrossRef] [Google Scholar]
- Ashton, G., & Talbot, C. 2021, MNRAS, 507, 2037 [NASA ADS] [CrossRef] [Google Scholar]
- Ashton, G., Huebner, M., Lasky, P. D., et al. 2019, ApJS, 241, 27 [NASA ADS] [CrossRef] [Google Scholar]
- Ashton, G., Ackley, K., Hernandez, I. M. N., & Piotrzkowski, B. 2021, Class. Quant. Grav., 38, 235004 [NASA ADS] [CrossRef] [Google Scholar]
- Bhattacharjee, S., Banerjee, S., Bhalerao, V., et al. 2024, MNRAS, 528, 4255 [NASA ADS] [CrossRef] [Google Scholar]
- Cameron, E. 2011, PASA, 28, 128 [Google Scholar]
- Colombo, A., Salafia, O. S., Gabrielli, F., et al. 2022, ApJ, 937, 79 [NASA ADS] [CrossRef] [Google Scholar]
- Colombo, A., Duqué, R., Salafia, O. S., et al. 2024, A&A, 686, A265 [NASA ADS] [CrossRef] [EDP Sciences] [Google Scholar]
- Connaughton, V., Burns, E., Goldstein, A., et al. 2016, ApJ, 826, L6 [NASA ADS] [CrossRef] [Google Scholar]
- Corsi, A., Barsotti, L., Berti, E., et al. 2024, ArXiv e-prints [arXiv:2402.13445] [Google Scholar]
- Coulter, D. A., Foley, R. J., Kilpatrick, C. D., et al. 2017, Science, 358, 1556 [NASA ADS] [CrossRef] [Google Scholar]
- Cowperthwaite, P. S., Berger, E., Villar, V. A., et al. 2017, ApJ, 848, L17 [CrossRef] [Google Scholar]
- Dálya, G., Díaz, R., Bouchet, F. R., et al. 2022, MNRAS, 514, 1403 [CrossRef] [Google Scholar]
- Del Pozzo, W., Berry, C. P., Ghosh, A., et al. 2018, MNRAS, 479, 601 [NASA ADS] [Google Scholar]
- Ducoin, J. G., Corre, D., Leroy, N., & Le Floch, E. 2020, MNRAS, 492, 4768 [NASA ADS] [CrossRef] [Google Scholar]
- Edwards, T. D. P., Wong, K. W. K., Lam, K. K. H., et al. 2024, Phys. Rev. D, 110, 064028 [NASA ADS] [CrossRef] [Google Scholar]
- Eichler, D., Livio, M., Piran, T., & Schramm, D. N. 1989, Nature, 340, 126 [NASA ADS] [CrossRef] [Google Scholar]
- Evans, P. A., Kennea, J. A., Palmer, D. M., et al. 2016, MNRAS, 462, 1591 [Erratum: MNRAS 484, 2362 (2019)] [NASA ADS] [CrossRef] [Google Scholar]
- Evans, P. A., Cenko, S. B., Kennea, J. A., et al. 2017, Science, 358, 1565 [NASA ADS] [CrossRef] [Google Scholar]
- Ferguson, T. S. 1973, Ann. Stat., 1, 209 [CrossRef] [Google Scholar]
- Finstad, D., De, S., Brown, D. A., Berger, E., & Biwer, C. M. 2018, ApJ, 860, L2 [NASA ADS] [CrossRef] [Google Scholar]
- Gehrels, N., Chincarini, G., Giommi, P., et al. 2004, ApJ, 611, 1005 [Erratum: ApJ 621, 558 (2005)] [Google Scholar]
- Ghirlanda, G., Salafia, O. S., Paragi, Z., et al. 2019, Science, 363, 968 [NASA ADS] [CrossRef] [Google Scholar]
- Goldstein, A., Veres, P., Burns, E., et al. 2017, ApJ, 848, L14 [CrossRef] [Google Scholar]
- Graham, M. J., Ford, K. E. S., McKernan, B., et al. 2020, Phys. Rev. Lett., 124, 251102 [NASA ADS] [CrossRef] [Google Scholar]
- Husa, S., Khan, S., Hannam, M., et al. 2016, Phys. Rev. D, 93, 044006 [NASA ADS] [CrossRef] [Google Scholar]
- Khan, S., Husa, S., Hannam, M., et al. 2016, Phys. Rev. D, 93, 044007 [Google Scholar]
- Lattimer, J. M., & Schramm, D. N. 1974, ApJ, 192, L145 [NASA ADS] [CrossRef] [Google Scholar]
- LIGO Scientific Collaboration (Aasi, J., et al.) 2015, Class. Quant. Grav., 32, 074001 [Google Scholar]
- Margossian, C. C. 2019, WIREs Data Mining and Knowledge Discovery, 9 [Google Scholar]
- Mooley, K. P., Frail, D. A., Dobie, D., et al. 2018, ApJ, 868, L11 [Google Scholar]
- Morisaki, S., Smith, R., Tsukada, L., et al. 2023, Phys. Rev. D, 108, 123040 [NASA ADS] [CrossRef] [Google Scholar]
- Morton, S. L., Rinaldi, S., Torres-Orjuela, A., et al. 2023, Phys. Rev. D, 108, 123039 [NASA ADS] [CrossRef] [Google Scholar]
- Neal, R. M. 2012, ArXiv e-prints [arXiv:1206.1901] [Google Scholar]
- NED 2019, NED Gravitational Wave Follow-up (GWF) Service, https://doi.org/10.26132/NED3 [Google Scholar]
- Patricelli, B., Bernardini, M. G., Mapelli, M., et al. 2022, MNRAS, 513, 4159 [Erratum: MNRAS 514, 3395 (2022)] [NASA ADS] [CrossRef] [Google Scholar]
- Planck Collaboration VI. 2020, A&A, 641, A6 [Erratum: A&A 652, C4 (2021)] [NASA ADS] [CrossRef] [EDP Sciences] [Google Scholar]
- Rasmussen, C. 1999, Advances in Neural Information Processing Systems, 12 [Google Scholar]
- Rinaldi, S., & Del Pozzo, W. 2021, MNRAS, 509, 5454 [NASA ADS] [CrossRef] [Google Scholar]
- Rinaldi, S., & Del Pozzo, W. 2022, MNRAS, 517, L5 [NASA ADS] [CrossRef] [Google Scholar]
- Rinaldi, S., & Del Pozzo, W. 2024, JOSS, 9, 6589 [NASA ADS] [CrossRef] [Google Scholar]
- Romero-Shaw, I. M., Talbot, C., Biscoveanu, S., et al. 2020, MNRAS, 499, 3295 [NASA ADS] [CrossRef] [Google Scholar]
- Ryan, G., van Eerten, H., Piro, L., & Troja, E. 2020, ApJ, 896, 166 [CrossRef] [Google Scholar]
- Salmon, L., Hanlon, L., Jeffrey, R. M., & Martin-Carrillo, A. 2020, A&A, 634, A32 [NASA ADS] [CrossRef] [EDP Sciences] [Google Scholar]
- Savchenko, V., Ferrigno, C., Kuulkers, E., et al. 2017, ApJ, 848, L15 [NASA ADS] [CrossRef] [Google Scholar]
- Schmidt, S., Breschi, M., Gamba, R., et al. 2021, Phys. Rev. D, 103, 043020 [NASA ADS] [CrossRef] [Google Scholar]
- Shannon, C. E. 1948, Bell Syst. Tech. J., 27, 623 [CrossRef] [Google Scholar]
- Singer, L. P., & Price, L. R. 2016, Phys. Rev. D, 93, 024013 [CrossRef] [Google Scholar]
- Singer, L. P., Chen, H.-Y., Holz, D. E., et al. 2016a, ApJ, 829, L15 [NASA ADS] [CrossRef] [Google Scholar]
- Singer, L. P., Chen, H.-Y., Holz, D. E., et al. 2016b, ApJS, 226, 10 [NASA ADS] [CrossRef] [Google Scholar]
- Speagle, J. S. 2020, MNRAS, 493, 3132 [Google Scholar]
- Stratta, G., & Pannarale, F. 2022, Universe, 8, 459 [CrossRef] [Google Scholar]
- Usman, S. A., Mills, J. C., & Fairhurst, S. 2019, ApJ, 877, 82 [NASA ADS] [CrossRef] [Google Scholar]
- Veitch, J., Raymond, V., Farr, B., et al. 2015, Phys. Rev. D, 91, 042003 [NASA ADS] [CrossRef] [Google Scholar]
- Wong, K. W. K., Isi, M., & Edwards, T. D. P. 2023, ApJ, 958, 129 [NASA ADS] [CrossRef] [Google Scholar]
- Wouters, T., Pang, P. T. H., Dietrich, T., & Van Den Broeck, C. 2024, Phys. Rev. D, 110, 083033 [NASA ADS] [CrossRef] [Google Scholar]
All Tables
Prior ranges for all parameters we used to simulate BBH and BNS injected signals.
All Figures
|
Fig. 1. Corner plot of the joint posterior distribution of {α, δ, dL, θjn} for GW170817. We compare the full PE posterior samples from Finstad et al. (2018) (black) with those obtained from the SKYFAST reconstruction after convergence is reached (blue). |
| In the text | |
|
Fig. 2. Sky localization of GW170817 obtained from the intermediate posterior reconstruction. The solid black lines represent the 50% and 90% credible regions. The colored crosses denote the positions of galaxies from the GLADE+ catalog Dálya et al. (2022) that lie within the 90% credible region, ranked by their probability of being the host. The true host, NGC 4993, is marked with a green circle. |
| In the text | |
|
Fig. 3. Comparison between the inclination angle posterior distribution marginalized over the position parameters (green) and conditioned on the position of NGC 4993 (blue). The blue line shows the median of the distributions obtained by conditioning on 500 different positions extracted from a Gaussian distribution with the mean and standard deviation given by the photometric redshift measurement for NGC 4993 reported in the GLADE+ catalog. The shaded areas denote the 68% and 90% credible regions. For the sake of completeness, we added the histogram of posterior samples from Finstad et al. |
| In the text | |
|
Fig. 4. Cumulative distribution of the total PE runtime and the time required by SKYFAST to produce the intermediate posterior reconstruction, the associated skymap, and the host galaxy ranking. We obtained the results shown in this plot using the Bilby-MCMC sampler to analyze 100 mock BBH events with the IMRPhenomD waveform. SKYFAST was run on Intel® Xeon® Gold 6140M processors with a 2.30 GHz clock rate. |
| In the text | |
|
Fig. 5. Cumulative distribution of the fraction of the PE runtime needed for SKYFAST to achieve the information entropy convergence criterion and release all its outputs: Intermediate posterior reconstruction, skymap, and galaxy host ranking. The setup is the same as in Figure 4. |
| In the text | |
|
Fig. 6. Cumulative distribution of the fraction of total samples needed for SKYFAST to achieve the information entropy convergence criterion and release the intermediate posterior reconstruction, skymap, and galaxy host ranking. The setup is the same as in Figure 4. |
| In the text | |
|
Fig. 7. Probability-probability plot for the intermediate posterior distributions of α, δ, dL, and θjn, and for the 2D and 3D localization posterior distributions. The dashed diagonal gray line shows the expected distribution, and the shaded areas show the corresponding 90% credible intervals. The setup is the same as in Figure 4. |
| In the text | |
|
Fig. 8. Cumulative distribution of time needed by SKYFAST to reconstruct the posterior and to produce all the relevant information. The times refer to a Intel® Xeon® Gold 6140M processor with a 2.30 GHz clock rate. |
| In the text | |
|
Fig. 9. Impact of different conditioned inclination angle posteriors on the expected GRB afterglow light curve in the X-ray band. The solid lines show the expected luminosity curve for the median inclination angle of each galaxy, as reported in Table 1. The shaded areas represent the uncertainty in the luminosity curve, reflecting the 90% credible intervals of the inclination angle. The dashed colored lines indicate the times of the luminosity peaks. We report the 60-second sensitivity limit of Swift/XRT Gehrels et al. (2004), Evans et al. (2016) at a distance of 40 Mpc, which is comparable to the distances of all potential hosts of GW170817. |
| In the text | |
Current usage metrics show cumulative count of Article Views (full-text article views including HTML views, PDF and ePub downloads, according to the available data) and Abstracts Views on Vision4Press platform.
Data correspond to usage on the plateform after 2015. The current usage metrics is available 48-96 hours after online publication and is updated daily on week days.
Initial download of the metrics may take a while.