Fig. 3.
Download original image
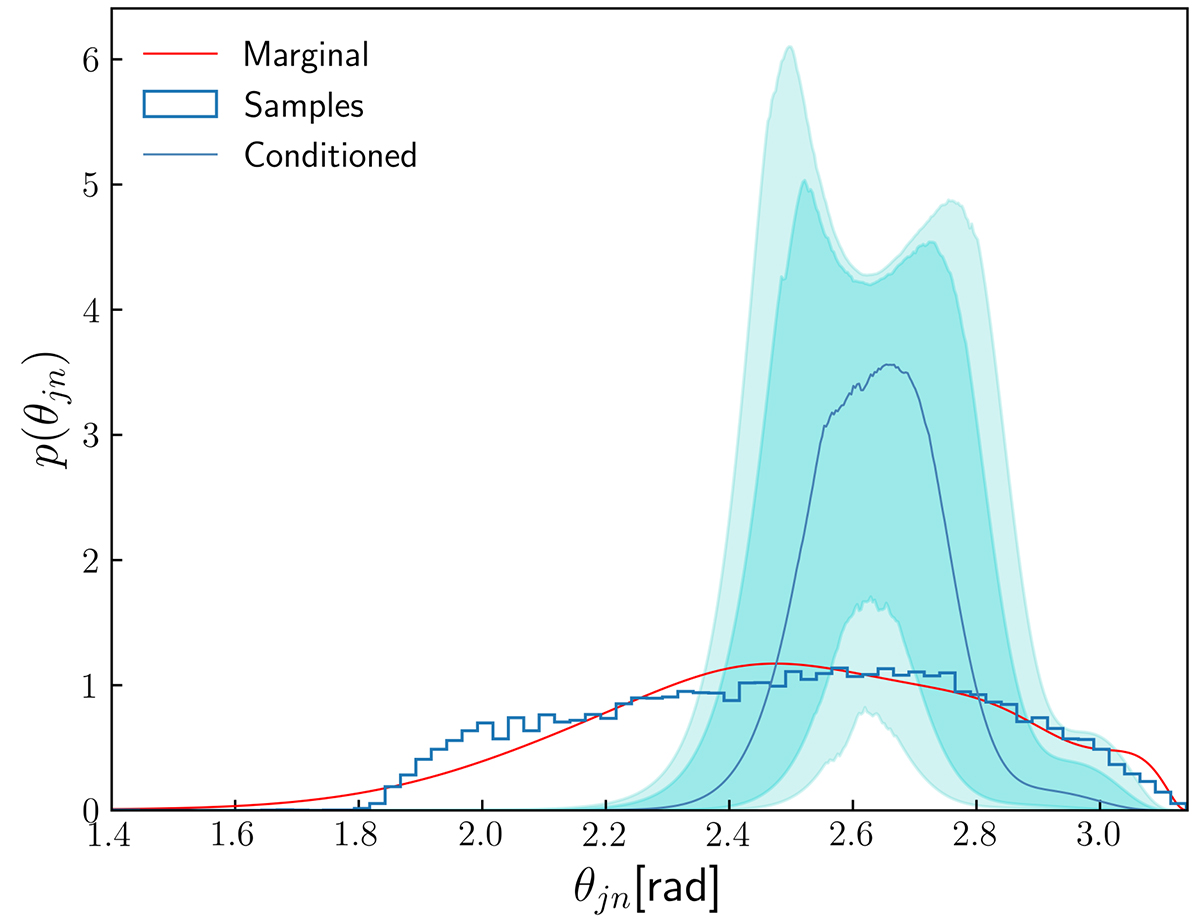
Comparison between the inclination angle posterior distribution marginalized over the position parameters (green) and conditioned on the position of NGC 4993 (blue). The blue line shows the median of the distributions obtained by conditioning on 500 different positions extracted from a Gaussian distribution with the mean and standard deviation given by the photometric redshift measurement for NGC 4993 reported in the GLADE+ catalog. The shaded areas denote the 68% and 90% credible regions. For the sake of completeness, we added the histogram of posterior samples from Finstad et al.
Current usage metrics show cumulative count of Article Views (full-text article views including HTML views, PDF and ePub downloads, according to the available data) and Abstracts Views on Vision4Press platform.
Data correspond to usage on the plateform after 2015. The current usage metrics is available 48-96 hours after online publication and is updated daily on week days.
Initial download of the metrics may take a while.