Fig. 9.
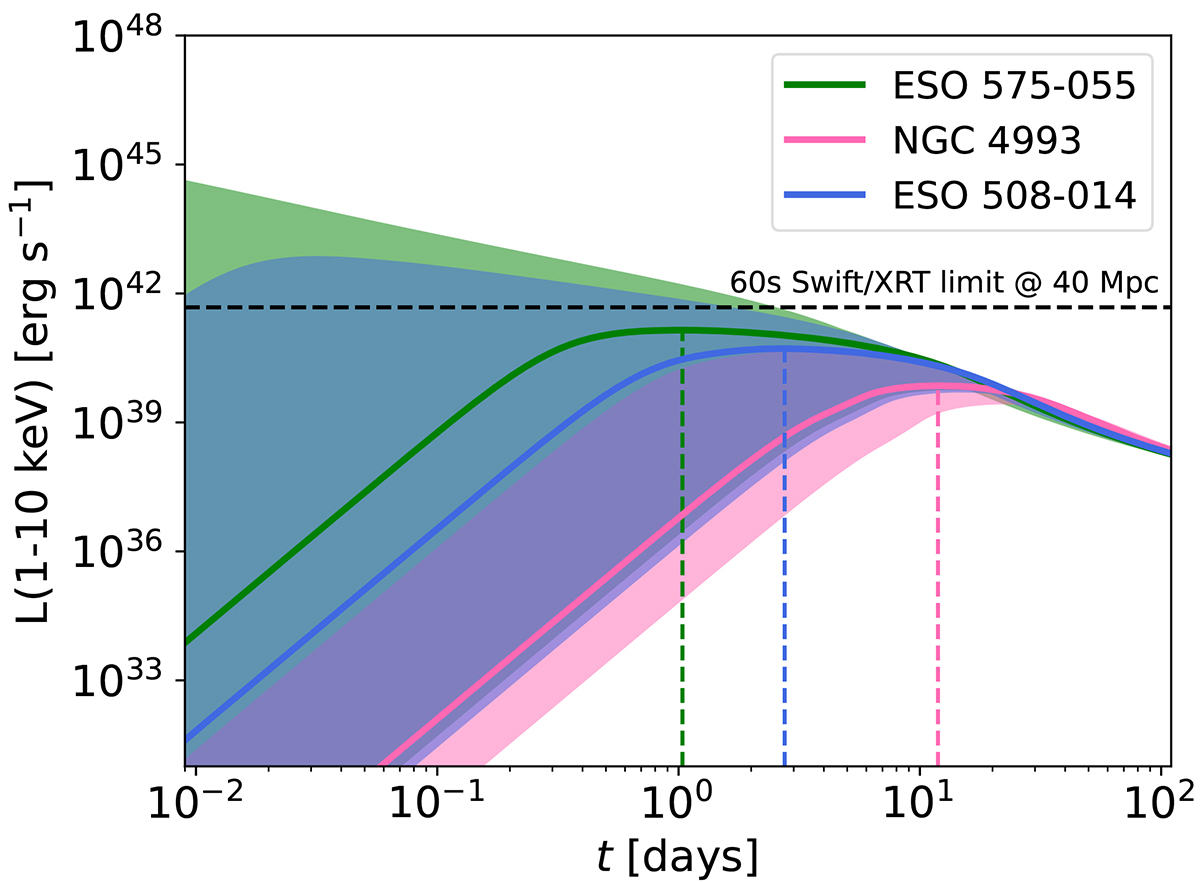
Download original image
Impact of different conditioned inclination angle posteriors on the expected GRB afterglow light curve in the X-ray band. The solid lines show the expected luminosity curve for the median inclination angle of each galaxy, as reported in Table 1. The shaded areas represent the uncertainty in the luminosity curve, reflecting the 90% credible intervals of the inclination angle. The dashed colored lines indicate the times of the luminosity peaks. We report the 60-second sensitivity limit of Swift/XRT Gehrels et al. (2004), Evans et al. (2016) at a distance of 40 Mpc, which is comparable to the distances of all potential hosts of GW170817.
Current usage metrics show cumulative count of Article Views (full-text article views including HTML views, PDF and ePub downloads, according to the available data) and Abstracts Views on Vision4Press platform.
Data correspond to usage on the plateform after 2015. The current usage metrics is available 48-96 hours after online publication and is updated daily on week days.
Initial download of the metrics may take a while.