Open Access
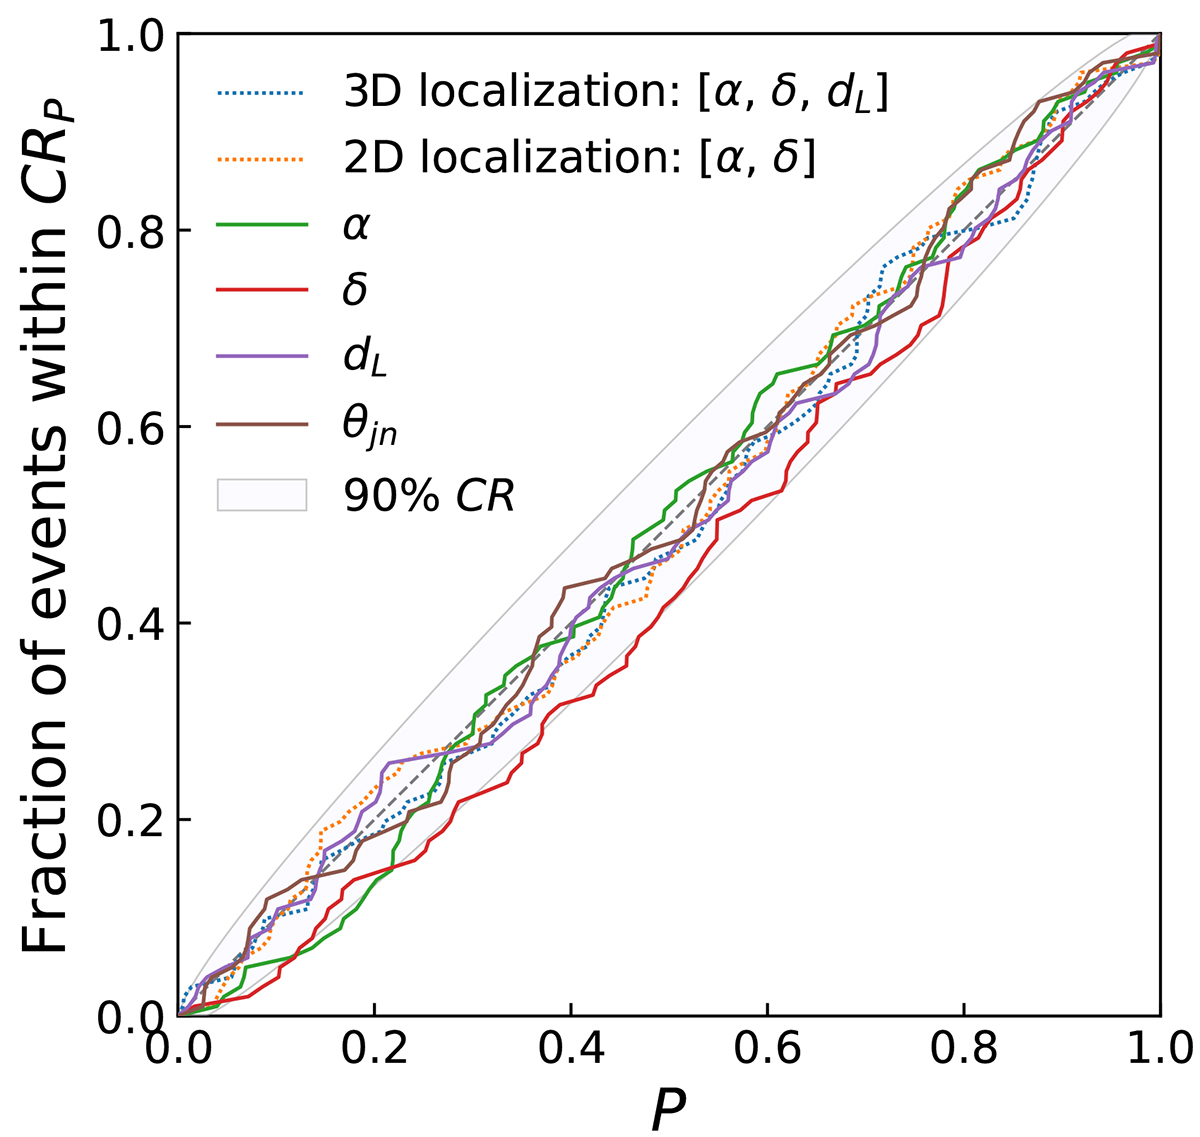
Fig. 7.
Download original image
Probability-probability plot for the intermediate posterior distributions of α, δ, dL, and θjn, and for the 2D and 3D localization posterior distributions. The dashed diagonal gray line shows the expected distribution, and the shaded areas show the corresponding 90% credible intervals. The setup is the same as in Figure 4.
Current usage metrics show cumulative count of Article Views (full-text article views including HTML views, PDF and ePub downloads, according to the available data) and Abstracts Views on Vision4Press platform.
Data correspond to usage on the plateform after 2015. The current usage metrics is available 48-96 hours after online publication and is updated daily on week days.
Initial download of the metrics may take a while.