| Issue |
A&A
Volume 694, February 2025
|
|
|---|---|---|
| Article Number | A47 | |
| Number of page(s) | 7 | |
| Section | The Sun and the Heliosphere | |
| DOI | https://doi.org/10.1051/0004-6361/202451320 | |
| Published online | 31 January 2025 | |
RIS: Regularized imaging spectroscopy for STIX on board Solar Orbiter
1
MIDA, Dipartimento di Matematica, Università di Genova, via Dodecaneso 35, 16146 Genova, Italy
2
Department of Mathematics, TUM School of Computation, Information and Technology, Technische Universität München, Boltzmannstraße 3, 85748 Garching b. München, Germany
3
Bioengineering Center, Institute of Biological and Medical Imaging, Helmholtz Munich, Ingolstädter Landstraße 1, 85764 Neuherberg, Germany
4
Dipartimento di Scienze Matematiche Giuseppe Luigi Lagrange, Politecnico di Torino, Corso Duca degli Abruzzi 24, 10129 Torino, Italy
5
Istituto Nazionale di Astrofisica, Osservatorio Astrofisico di Torino, via Osservatorio 20, 10025 Pino Torinese, Italy
⋆ Corresponding authors; This email address is being protected from spambots. You need JavaScript enabled to view it.
, This email address is being protected from spambots. You need JavaScript enabled to view it.
, This email address is being protected from spambots. You need JavaScript enabled to view it.
Received:
1
July
2024
Accepted:
19
December
2024
Abstract
Context. The generation of spatially resolved count spectra and of cubes of count maps at different energies via imaging spectroscopy is one of the main goals of solar hard X-ray missions based on Fourier imaging. Thus, so far, for these telescopes, this goal has been realized via the generation of either count maps that are independently reconstructed in the different energy channels or electron flux maps reconstructed via a deconvolution of the approximate forms for the bremsstrahlung cross-section.
Aims. Our aim is to introduce a regularized imaging spectroscopy method (RIS), whereby the regularization implemented in the count space imposes a smoothing constraint across contiguous energy channels, without the need for computing any deconvolution of the bremsstrahlung effect.
Methods. STIX records imaging data, while computing the visibilities in the spatial frequency domain. Our RIS is a sequential scheme in which part of the information coded in the image is reconstructed at a specific energy channel and transferred to the reconstruction process at a contiguous channel via a visibility interpolation computed by means of variably scaled kernels (VSKs).
Results. In the case of STIX visibilities recorded during the November 11, 2022 flaring event, we show that RIS is able to generate hard X-ray maps, whose morphology is seen to smoothly evolve from one energy channel to the contiguous one; accordingly, from these maps, it is possible to infer spatially resolved count spectra characterized by a notable numerical stability. We also show that the performance of this approach is robust with respect to both the image reconstruction method and the count energy channel utilized to trigger the sequential process.
Conclusions. We conclude that RIS is not only an appropriate, but also an effective and necessary approach to constructing image cubes from STIX visibilities that are characterized by smooth behavior across count energies. Thus, it allows for the generation of numerically stable (and, thus, physically reliable) local count spectra.
Key words: methods: data analysis / techniques: imaging spectroscopy / telescopes / Sun: flares / Sun: X-rays / gamma rays
© The Authors 2025
 Open Access article, published by EDP Sciences, under the terms of the Creative Commons Attribution License (https://creativecommons.org/licenses/by/4.0), which permits unrestricted use, distribution, and reproduction in any medium, provided the original work is properly cited.
This article is published in open access under the Subscribe to Open model. This email address is being protected from spambots. You need JavaScript enabled to view it. to support open access publication.
1. Introduction
Imaging spectroscopy in solar hard X-ray imaging (Piana et al. 2022) consists of providing reconstructions of hard X-ray count maps at different count energy channels. On the other hand, it also aims to deliver spatially resolved count spectra. From a scientific viewpoint, imaging spectroscopy allows us to infer information about the characteristics of the location of the acceleration region (Battaglia & Benz 2006; Xu et al. 2008; Martínez Oliveros et al. 2011; Guo et al. 2012) and even to study the physics of electron transport within the source (Petrosian & Chen 2010; Volpara et al. 2024).
In recent decades, imaging spectroscopy has been one of the main science goals of space missions that have been designed to generate measurements representing samples of the Fourier transform of the incoming radiation flux (i.e., visibilities) for energy values in the range between a few kiloelectron volts (keV) and a few tenths of keV. Notable examples of Fourier-based instruments developed in this context include the Reuven Ramaty high-energy solar spectroscopic imager (RHESSI, Lin et al. 2002; Hurford et al. 2002), Spectrometer Telescope for Imaging X-rays (STIX, Krucker et al. 2020; Massa et al. 2023), and Hard X-ray Imager (HXI, Zhang et al. 2019).
In the case of these Fourier-based imagers, the traditional approach to imaging spectroscopy applies Fourier inversion methods to sets of visibilities to obtain spatial images at different count energies (Battaglia & Benz 2006; Xu et al. 2008; Martínez Oliveros et al. 2011). This approach is simple, but not optimal. Indeed, each image is reconstructed using a visibility set that is completely independent of those used to make images in adjacent energy bins, which implies that reconstructions corresponding to adjacent count energy bins are uncorrelated and may present substantial differences from each other. Therefore, stacking these images leads to nonphysical fluctuations in the spatially resolved count spectra, which makes their interpretation problematic.
To address this issue, a more sophisticated method has been developed within the RHESSI and STIX frameworks, in which the observed visibility spectra obtained at points in the spatial frequency domain were inverted by means of a regularization method providing electron flux visibility spectra smoothed along the electron energy direction (Piana et al. 2007; Prato et al. 2009; Volpara et al. 2024). These latter ones can be utilized to both reconstruct electron flux images and, once they are projected back to the count space, regularized count spectra. By construction, these spectra vary smoothly along the count energy direction. However, the main weakness of this approach is in its computational complexity. In fact, in this case spatially resolved regularized count spectra are obtained by first inverting the original experimental visibility spectra, which is an intrinsically ill-posed problem (Bertero et al. 2021). Furthermore, to do so, a specific model for the bremsstrahlung cross-section must be assumed, which requires an approximation of the electron–ion interaction process (Koch & Motz 1959). Finally, the regularized count spectra can be obtained by means of a back-projection onto the count space, which requires the use of a numerical integration (Volpara et al. 2024).
The objective of the present paper is to introduce an approach to imaging spectroscopy for visibility-based hard X-ray telescopes that addresses the two previous limitations; namely, this approach aims to introduce a regularization constraint across the count energies without any spectral inversion process and, therefore, without the need to previously construct any electron flux maps. The starting point of the regularized imaging spectroscopy method (RIS) is an interpolation/extrapolation method based on the use of variably scaled kernels (VSKs), which allow for an advanced approach to numerical approximation. As a result, a priori information can be easily plugged into the interpolation process by means of the appropriate scale functions (Bozzini et al. 2015). In the case of both RHESSI and STIX, VSKs have proven to be very effective at interpolating visibilities in the frequency plane, while a non-linear iterative scheme (Piana & Bertero 1997) applied to the interpolated visibility surface was able to provide physically reliable reconstructions of the flaring source (Perracchione et al. 2021a, 2023).
In the present context, we decided to use VSKs and iterative image reconstruction as the computational engine of a regularized imaging spectroscopy approach that can be formulated according to the following scheme:
-
Given a visibility set at a starting triggering count energy channel, ϵ0, apply any visibility-based image reconstruction method to obtain the corresponding triggering map.
-
Apply a Fourier transform to compute the scale function corresponding to the reconstruction obtained in the previous step.
-
Given the visibility set in an energy channel, ϵ1, adjacent to ϵ0, apply the VSK with the scale function obtained in the previous step to realize interpolation in the spatial frequency plane.
-
Apply the constrained iterative method in order to obtain the reconstruction of the count map at an energy, ϵ1.
-
Repeat the process up to a given final energy channel, ϵI.
Of course, the actual implementation of this scheme, and, consequently, its effectiveness in reproducing a smooth spectral evolution of the flaring morphology, may depend on the choice of the count energy channel, ϵ0, and of the visibility-based image reconstruction method used at step 1 to trigger the process. After presenting the mathematical description of RIS, the present study validates its performances in the case of experimental STIX visibilities recorded in correspondence with the November 11, 2022 event. We also assess the impact on the reconstructions’ reliability of different choices of the triggering energy and image reconstruction method.
The plan of the paper is as follows. Section 2 illustrates the mathematical setup of VSK-based regularized imaging spectroscopy. Section 3 describes the range of applications against STIX observations. Our conclusions are given in Sect. 4.
2. Mathematical formulation of the method
In the context of Fourier-based imagers, the image reconstruction problem can be written as
 (1)
(1)
where A is the discretized version of the Fourier transform sampled at a set of points  inside a disk B in the (u, v) plane; V is the vector whose n components are the complex experimental visibilities observed by the telescope at a specific energy channel, ϵ0, and in a specific time window. Finally, f is the vector whose components are the discretized values of the incoming radiation flux. Any visibility-based imaging method provides an (either linear or non-linear) estimate ℱα of A−1 such that
 (2)
(2)
is the reconstructed image at the energy channel, ϵ0. The subscript α denotes the fact that image reconstruction relies on some regularization process, tuned by means of a regularization parameter, α. Regularization reduces the numerical instabilities introduced by the limited number of Fourier samples at disposal. However, here this regularization only offers a spatial significance, and does not introduce any smoothing effect along the spectral direction. As a consequence, the reconstruction provided by ℱα, when applied to the visibility set recorded by STIX at a contiguous energy interval, ϵ1, is totally uncorrelated with the reconstruction provided by the same method at ϵ0; this is significantly unreliable from a physical viewpoint.
2.1. Interpolation/extrapolation procedure
The present study shows that a smoothing constraint in the spectral direction for imaging spectroscopy can be introduced by using numerical interpolation in the spatial frequency plane based on radial basis functions (RBFs) and VSKs. According to Perracchione et al. (2021a,b), this approach constructs the interpolant of the visibilities
 (3)
(3)
where
 (4)
(4)
and
 (5)
(5)
In Eq. (5), ϕ is an appropriately chosen RBF, ∥ ⋅ ∥ is the Euclidean norm, and ψ is a scale function encoding prior information on the flaring source. Once ϕ and ψ have been chosen, the numerical solution of Eqs. (3)–(5) leads to the determination of the coefficients {ak}k = 1n and then to the computation of the interpolated visibility surface  such that
 (6)
(6)
where the knots  are picked up on a regular mesh in the (u, v) plane with N2 ≫ n. Therefore, interpolation leads from Eq. (1) to
 (7)
(7)
where  is the Fourier transform now discretized over an N2 × N2 grid,
  is the N2 × 1 vector containing all the interpolated visibilities, and
  is the N2 × 1 solution vector. The inversion of Eq. (7) can be performed by means of several regularization methods, although the projected Landweber iterative scheme (Piana & Bertero 1997; Perracchione et al. 2021b) proved to have super-resolving powers, thanks to the iterative application of the convex projector onto the set of vectors with non-negative components, which allows us to improve the spatial resolution associated to the point spread function (PSF) of the instrument (Allavena et al. 2012).
2.2. RIS: Regularized imaging spectroscopy in the count space
VSK-based interpolation/extrapolation in the visibility domain is the computational tool that allows the realization of RIS in the count space; namely, without the need to construct the electron maps via bremsstrahlung de-convolution. Given an input visibility vector, Vϵ0, at a specific triggering count energy channel, ϵ0, the initialization step first applies any Fourier-based image reconstruction to generate the triggering reconstructed image, fϵ0. The Fourier transform of fϵ0 is chosen as scaling function, ψϵ0. Given the visibility set at ϵ1 (which is contiguous to ϵ0), a VSK-based interpolation with ψϵ0 as the scale function allows us to compute the visibility surface,  . Finally, the application of the projected iterative scheme to obtain fϵ1 concludes the initialization step.
Now, the sequential loop is made over a set of contiguous count energies {ϵi}i = 2I, in such a way that the Fourier transform of  at energy ϵi − 1 is used as the scale function for the generation of the visibility surface at an energy, ϵi. Then, the new
  is computed by means of the usual projected iterative scheme. Therefore, this approach realizes regularization along the spectral direction by exploiting the scale function to transfer some topographical information from two contiguous energy channels. A pictorial description of this scheme, when applied to STIX data, is illustrated in Fig. 1, which also contains the outcome of each step of the algorithm.
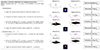 |
Fig. 1. Regularized imaging spectroscopy (RIS) algorithm and the outcomes corresponding to each one of its steps. |
From a technical viewpoint, the application of RIS to STIX observations shown in the next section has been realized by means of an implementation that utilizes the Matern C0 kernel
 (8)
(8)
as a RBF, where η is the so-called shape parameter. Furthermore, the stopping rule for the projected Landweber scheme is based on a check of the χ2 values, and the initialization vector is fϵi(0) = 0 for each i = 1, …, I. Then, the sequential image reconstruction is interrupted at the energy channel where the signal-to-noise ratio (S/N) is too low to guarantee a reliable count map. Finally, as far as the measurements are concerned, in the applications below we utilize 24 of the 30 STIX sub-collimators (because the highest resolution grids are not yet completely calibrated). This corresponds to a visibility set made of 48 experimental visibilities overall, where 24 visibilities are measured by STIX and the other 24 are generated accounting for the fact that V(−u, −v) is equal to the complex conjugate of V(u, v). Further, the disk B has a radius of 0.03 arcsec−1.
3. Applications to STIX visibilities
To demonstrate the performance of RIS in the case of STIX data, we considered the November 11, 2022 event, in the time window between 01:30:00 and 01:32:00 UT. The sequence of energy channels was made of 9 2-keV-wide channels starting from 4 − 6 keV to 20 − 22 keV, plus one 3-keV-wide channel at 22 − 25 keV. Figure 2 shows some light-curves corresponding to the event, and some level curves of the STIX map at 4 − 6 keV (in red) and 22 − 25 keV (in green) as superimposed on the EUV map recorded by the Atmospheric Imaging Assembly on board the Solar Dynamics Observatory (SDO/AIA). The reconstruction method utilized for generating these level curves is a constrained maximum entropy method implemented in the MEM_GE routine of the STIX ground software (Massa et al. 2020).
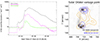 |
Fig. 2. Hard X-ray emission of the November 11, 2022 event in the time window between 01:30:00 and 01:32:00 UT. Left panel: STIX light-curves corresponding to three energy channels. Right panel: level curves of the count emission provided by MEM_GE and superimposed to the 1600 Å emission recorded by SDO/AIA (the AIA data have been appropriately reprojected in order to account for the Solar Orbiter and SDO different vantage points). The red level curves correspond to the thermal emission in the energy range of 4 − 6 keV, while the green ones correspond to the non-thermal emission in the energy range of 22 − 25 keV. |
The two top rows of Fig. 3 contain the count maps corresponding to the November 11, 2022 event provided by RIS. The reconstruction used to trigger the scheme is the one provided by MEM_GE in correspondence of the visibility set recorded by STIX at 4 − 6 keV (see the map in the top-left panel in the first row of the figure). Here, the regularized reconstructions are compared to the reconstructions provided by MEM_GE in the two bottom rows, from the same visibility sets but without any correlation constraint across consecutive energy channels. We note that the morphology of the maps obtained using the RIS approach is consistent with those produced by MEM_GE, when applied to uncorrelated sets of visibilities. However, we remark that MEM_GE slightly shrinks the size of the reconstructed sources, so we would expect the actual sources to be larger than those provided by this method. The comparison clearly points out that regularization nicely implies a smooth and realistic evolution of the flaring morphology, while the uncorrelated maps suffer some numerical instability particularly at high energies, where the S/N of the STIX counts significantly decreases. Indeed, while the maps obtained with MEM_GE exhibit abrupt variations across contiguous energy channels, this behavior is not observed when using RIS. For instance, the shape of the upper source changes significantly between the 18 − 20 keV, 20 − 22 keV, and 22 − 25 keV energy bands in the reconstructions provided by MEM_GE; whereas it remains more stable in the maps obtained with RIS. Similarly, a pronounced change in morphology is visible between 4 − 6 keV and 6 − 8 keV in the lower panel of Fig. 3. In contrast, the maps generated by the RIS approach show only smooth, physically sound variations between energy channels.
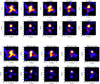 |
Fig. 3. Comparison between the maps provided at contiguous energy channels by the RIS method and the reconstructions provided by MEM_GE at the same channels. Top: reconstructions provided by RIS using the MEM_GE reconstruction at the top left panel as triggering image. Bottom: reconstructions provided by MEM_GE. |
The main advantage of this approach to imaging spectroscopy is in the possibility to reconstruct numerically stable spatially resolved count spectra. This potentiality is illustrated in Fig. 4, where local count spectra obtained from the regularized maps in Fig. 3 are compared to the ones obtained from maps reconstructed by MEM_GE, independently at each one of the same energy channels. The points in the flaring region at which these local spectra are computed are identified by the colored crosses in the map at the top left panel of the figure. The uncertainly shown by the error bars are obtained by means of a confidence strip approach. The observed visibilities have been perturbed 20 times, using a Gaussian distribution with constant standard deviation. Then, the MEM_GE algorithm and the RIS approach are applied to each perturbed realization of the visibilities to obtain the recovered maps. Finally, the standard deviation of the count spectra obtained from the different map realizations is computed. Once again, regularization implies numerical stability and smaller uncertainties, as demonstrated by error bars that are systematically smaller than the ones characterizing the not-regularized spectra; however, this does not modify the overall shape of the local count spectra.
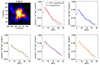 |
Fig. 4. Local count spectra corresponding to the points highlighted by the colored crosses superimposed to the map at the top left panel (RIS map in the energy range 6 − 8 keV). The local spectra obtained by using the maps in Fig. 3 provided by RIS are in solid line, while the ones obtained by using the maps in the same figure but provided by MEM_GE when independently applied at each energy channel are in dashed line. |
In such applications, RIS can be triggered by images reconstructed by means of different image reconstruction methods and can start its sequential process from any energy channel; the only condition is for the energy channels involved in the process to be contiguous. Therefore, one of the possible validation issues related to this approach is concerned with robustness with respect to these two degrees of freedom. The left panel of Fig. 5 compares the χ2 values computed from RIS maps generated by using triggering images reconstructed by MEM_GE, CLEAN (Högbom 1974) and a forward-fit algorithm realized by means of particle swarm optimization (PSO) (Volpara et al. 2022). In all these cases, the triggering energy is the 4 − 6 keV energy channel. To show the reliability of RIS maps, the left panel in the figure also shows the χ2 values obtained from maps provided by the MEM_GE algorithm, with no correlation constraint across the energies. We point out that, as expected, the best overall results (i.e., the lowest χ2 values) are obtained when the map that triggers the process is obtained with MEM_GE algorithm, which is considered the best visibility-based image reconstruction method in this context. The right panel does the same in the case of three different choices of the triggering energy channel when, in all cases, the triggering image is the ones provided by MEM_GE. Specifically, the triggering energies are ϵ0 = 4 − 6 keV (i.e., regularization proceeds from low to high energies), ϵ0 = 14 − 16 keV (i.e. regularization starts at an intermediate energy and from that proceeds to both low and high energies), and ϵ0 = 22 − 25 keV (i.e. regularization proceeds from high to low energies). In all these cases, the χ2 values are rather stable and decreases consistently from low to high energies, given that χ2 is normalized with respect to the experimental standard deviation, which is lower at low energies. Interestingly, the best fit associated to the regularization flow from high to low energies is more accurate than the one associated to the low-to-high-energy flow, which has a rather immediate physical interpretation. Indeed, bremsstrahlung implies that high-energy photons (and the corresponding counts) are produced by a small number of electrons. As a consequence, when the triggering energy is high, regularization flows along the same direction of the increase in the physics-induced uncertainty.
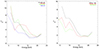 |
Fig. 5. Robustness of RIS with respect to the reconstruction method applied to generate the triggering image and on the triggering energy. Left panel: χ2 values at different energies when the triggering image is reconstrcuted by means of MEM_GE (black), forward-fit with PSO (red) and CLEAN (green). The χ2 values provided by MEM_GE independently at each energy channel are shown in blue. Right panel: χ2 values at different energies when the triggering energy corresponds to the lowest channel and the regularization process flows from low to high energies (black), the triggering energy corresponds to the highest channel and the regularization process flows from high to low energies (red), and the triggering energy has an intermediate value with the regularization process flowing along both directions (green). |
4. Conclusions
The RIS regularization method is aimed at the reconstruction of count maps from STIX visibilities at different energy channels, characterized by a smooth behavior across such energies. This smoothing constraint is imposed by means of a sequential scheme based on the use of VSK interpolation in the spatial frequency domain. The main advantage of this approach is that from these regularized maps, it is possible to produce spatially resolved count spectra characterized by unprecedented numerical stability. In addition, RIS is robust with respect to the choice of both the reconstruction method applied to generate the image that triggers the regularization process and the triggering energy channel.
In our opinion, the next area of research relevant to the use of RIS may see two possible developments. First, from a physical viewpoint, the systematic use of regularized local count spectra will allow for a spectroscopy-based and reliable description of the interplay of thermal and non-thermal mechanisms in solar flares at different locations in the flaring region. Second, from a methodological viewpoint, the RIS approach might be extended to a regularized approach to dynamical studies of the flaring emission, where the VSK-based smoothing constraint will be realized across contiguous time intervals.
Finally, we point out that the RIS tool may be used to re-analyse the events observed by RHESSI and to explore regularization along the energy channels. In the case of visibility levels currently recorded by HXI, it will allow us to improve our investigation of the energy evolution of solar flares1.
The RIS tool can be currently reached at the MIDA group github (https://github.com/theMIDAgroup/RIS_codes) and will be uploaded in the STIX ground software at one of the next releases of the software.
Acknowledgments
Solar Orbiter is a space mission of international collaboration between ESA and NASA, operated by ESA. The STIX instrument is an international collaboration between Switzerland, Poland, France, Czech Republic, Germany, Austria, Ireland, and Italy. AV, MP, and AMM acknowledge the support of the “Accordo ASI/INAF Solar Orbiter: Supporto scientifico per la realizzazione degli strumenti Metis, SWA/DPU e STIX nelle Fasi D-E”, and the HORIZON Europe ARCAFF Project, grant No. 101082164. MP also acknowledges financial support under the National Recovery and Resilience Plan (NRRP), Mission 4, Component 2, Investment 1.1, Call for tender No. 104 published on 2.2.2022 by the Italian Ministry of University and Research (MUR), funded by the European Union – NextGenerationEU – Project Title “Inverse Problems in Imaging Sciences (IPIS)” – CUP D53D23005740006 – Grant Assignment Decree No. 973 adopted on 30/06/2023 by the Italian Ministry of Ministry of University and Research (MUR). EP kindly acknowledges the support of the Fondazione Compagnia di San Paolo within the framework of the Artificial Intelligence Call for Proposals, AIxtreme project (ID Rol: 71708) and the support of the project NODES within the MUR – M4C2 1.5 of PNRR, grant agreement no.ECS00000036. AV, EP, AMM and MP are members of the Gruppo Nazionale per il Calcolo Scientifico – Istituto Nazionale di Alta Matematica (GNCS – INdAM).
References
- Allavena, S., Piana, M., Benvenuto, F., & Massone, A. M. 2012, Inverse Problems& Imaging, 6, 147 [CrossRef] [Google Scholar]
- Battaglia, M., & Benz, A. O. 2006, A&A, 456, 751 [NASA ADS] [CrossRef] [EDP Sciences] [Google Scholar]
- Bertero, M., Boccacci, P., & De Mol, C. 2021, Introduction to Inverse Problems in Imaging (CRC Press) [Google Scholar]
- Bozzini, M., Lenarduzzi, L., Rossini, M., & Schaback, R. 2015, IMA Journal of Numerical Analysis, 35, 199 [CrossRef] [Google Scholar]
- Guo, J., Emslie, A. G., Kontar, E. P., et al. 2012, A&A, 543, A53 [NASA ADS] [CrossRef] [EDP Sciences] [Google Scholar]
- Högbom, J. 1974, ApJS, 15, 417 [Google Scholar]
- Hurford, G., Schmahl, E., Schwartz, R., et al. 2002, Sol. Phys., 210, 61 [NASA ADS] [CrossRef] [Google Scholar]
- Koch, H. W., & Motz, J. W. 1959, Reviews of Modern Physics, 31, 920 [NASA ADS] [CrossRef] [Google Scholar]
- Krucker, S., Hurford, G. J., Grimm, O., et al. 2020, A&A, 642, A15 [NASA ADS] [CrossRef] [EDP Sciences] [Google Scholar]
- Lin, R., Dennis, B., Hurford, G., et al. 2002, Sol. Phys., 210, 3 [NASA ADS] [CrossRef] [Google Scholar]
- Martínez Oliveros, J. C., Couvidat, S., Schou, J., et al. 2011, Sol. Phys., 269, 269 [CrossRef] [Google Scholar]
- Massa, P., Schwartz, R., Tolbert, A., et al. 2020, ApJ, 894, 46 [NASA ADS] [CrossRef] [Google Scholar]
- Massa, P., Hurford, G. J., Volpara, A., et al. 2023, Sol. Phys., 298, 114 [NASA ADS] [CrossRef] [Google Scholar]
- Perracchione, E., Massa, P., Massone, A. M., & Piana, M. 2021a, ApJ, 919, 133 [NASA ADS] [CrossRef] [Google Scholar]
- Perracchione, E., Massone, A. M., & Piana, M. 2021b, Inverse Problems, 37, 105001 [NASA ADS] [CrossRef] [Google Scholar]
- Perracchione, E., Camattari, F., Volpara, A., et al. 2023, The Astrophysical Journal Supplement Series, 268, 68 [NASA ADS] [CrossRef] [Google Scholar]
- Petrosian, V., & Chen, Q. 2010, ApJ, 712, L131 [NASA ADS] [CrossRef] [Google Scholar]
- Piana, M., & Bertero, M. 1997, Inverse Probl., 13, 441 [NASA ADS] [CrossRef] [Google Scholar]
- Piana, M., Emslie, A. G., Massone, A. M., & Dennis, B. R. 2022, Hard X-ray Imaging of Solar Flares (Springer), 164 [CrossRef] [Google Scholar]
- Piana, M., Massone, A. M., Hurford, G. J., et al. 2007, ApJ, 665, 846 [CrossRef] [Google Scholar]
- Prato, M., Piana, M., Emslie, A. G., et al. 2009, SIAM Journal on Imaging Sciences, 2, 910 [CrossRef] [Google Scholar]
- Volpara, A., Massa, P., Perracchione, E., et al. 2022, A&A, 668, A145 [NASA ADS] [CrossRef] [EDP Sciences] [Google Scholar]
- Volpara, A., Massa, P., Krucker, S., et al. 2024, A&A, 684, A185 [NASA ADS] [CrossRef] [EDP Sciences] [Google Scholar]
- Xu, Y., Emslie, A. G., & Hurford, G. J. 2008, ApJ, 673, 576 [NASA ADS] [CrossRef] [Google Scholar]
- Zhang, Z., Chen, D.-Y., Wu, J., et al. 2019, Research in Astronomy and Astrophysics, 19, 160 [NASA ADS] [CrossRef] [Google Scholar]
All Figures
|
Fig. 1. Regularized imaging spectroscopy (RIS) algorithm and the outcomes corresponding to each one of its steps. |
| In the text | |
|
Fig. 2. Hard X-ray emission of the November 11, 2022 event in the time window between 01:30:00 and 01:32:00 UT. Left panel: STIX light-curves corresponding to three energy channels. Right panel: level curves of the count emission provided by MEM_GE and superimposed to the 1600 Å emission recorded by SDO/AIA (the AIA data have been appropriately reprojected in order to account for the Solar Orbiter and SDO different vantage points). The red level curves correspond to the thermal emission in the energy range of 4 − 6 keV, while the green ones correspond to the non-thermal emission in the energy range of 22 − 25 keV. |
| In the text | |
|
Fig. 3. Comparison between the maps provided at contiguous energy channels by the RIS method and the reconstructions provided by MEM_GE at the same channels. Top: reconstructions provided by RIS using the MEM_GE reconstruction at the top left panel as triggering image. Bottom: reconstructions provided by MEM_GE. |
| In the text | |
|
Fig. 4. Local count spectra corresponding to the points highlighted by the colored crosses superimposed to the map at the top left panel (RIS map in the energy range 6 − 8 keV). The local spectra obtained by using the maps in Fig. 3 provided by RIS are in solid line, while the ones obtained by using the maps in the same figure but provided by MEM_GE when independently applied at each energy channel are in dashed line. |
| In the text | |
|
Fig. 5. Robustness of RIS with respect to the reconstruction method applied to generate the triggering image and on the triggering energy. Left panel: χ2 values at different energies when the triggering image is reconstrcuted by means of MEM_GE (black), forward-fit with PSO (red) and CLEAN (green). The χ2 values provided by MEM_GE independently at each energy channel are shown in blue. Right panel: χ2 values at different energies when the triggering energy corresponds to the lowest channel and the regularization process flows from low to high energies (black), the triggering energy corresponds to the highest channel and the regularization process flows from high to low energies (red), and the triggering energy has an intermediate value with the regularization process flowing along both directions (green). |
| In the text | |
Current usage metrics show cumulative count of Article Views (full-text article views including HTML views, PDF and ePub downloads, according to the available data) and Abstracts Views on Vision4Press platform.
Data correspond to usage on the plateform after 2015. The current usage metrics is available 48-96 hours after online publication and is updated daily on week days.
Initial download of the metrics may take a while.