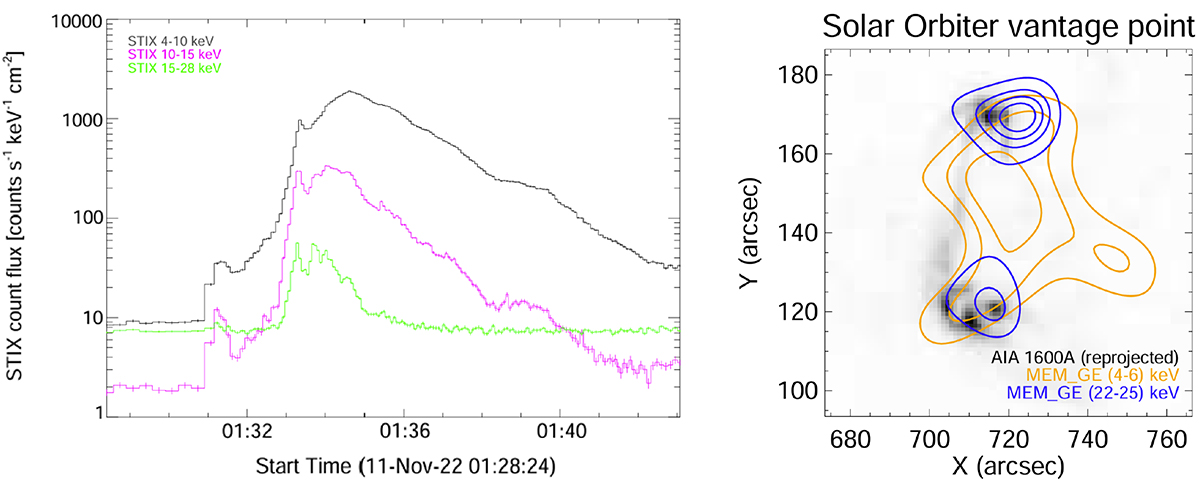
Fig. 2.
Download original image
Hard X-ray emission of the November 11, 2022 event in the time window between 01:30:00 and 01:32:00 UT. Left panel: STIX light-curves corresponding to three energy channels. Right panel: level curves of the count emission provided by MEM_GE and superimposed to the 1600 Å emission recorded by SDO/AIA (the AIA data have been appropriately reprojected in order to account for the Solar Orbiter and SDO different vantage points). The red level curves correspond to the thermal emission in the energy range of 4 − 6 keV, while the green ones correspond to the non-thermal emission in the energy range of 22 − 25 keV.
Current usage metrics show cumulative count of Article Views (full-text article views including HTML views, PDF and ePub downloads, according to the available data) and Abstracts Views on Vision4Press platform.
Data correspond to usage on the plateform after 2015. The current usage metrics is available 48-96 hours after online publication and is updated daily on week days.
Initial download of the metrics may take a while.