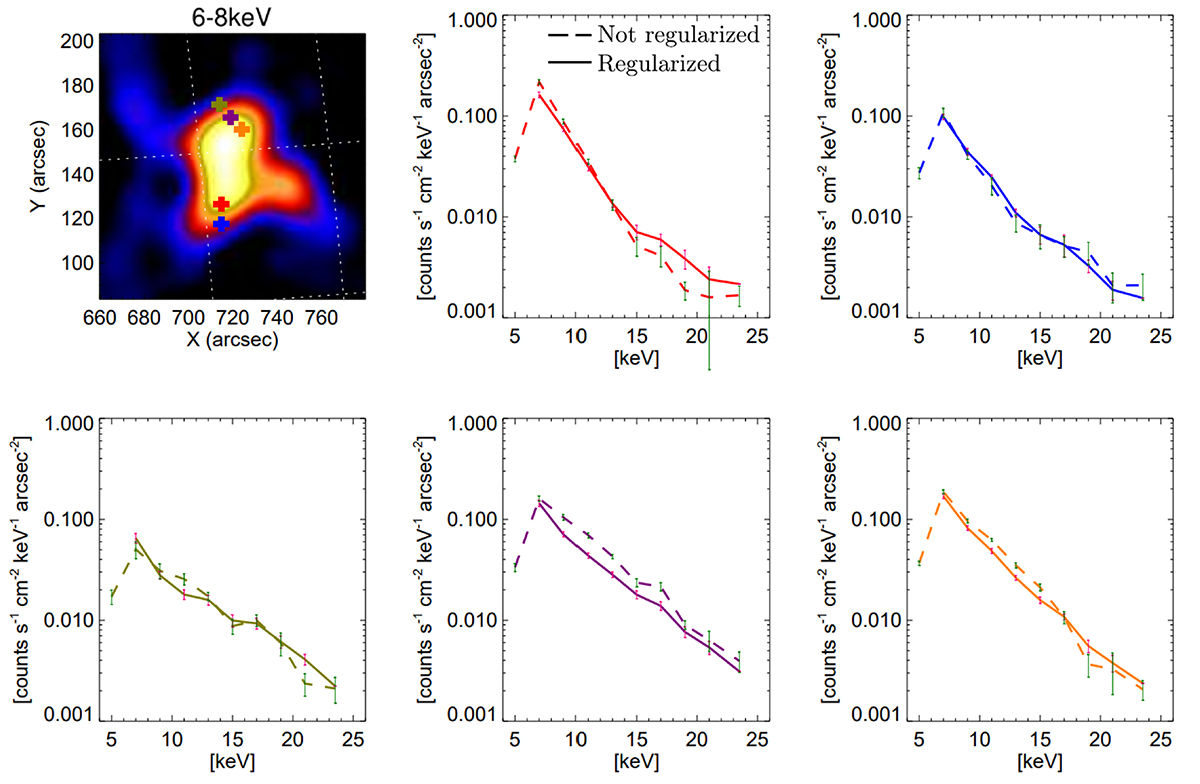
Fig. 4.
Download original image
Local count spectra corresponding to the points highlighted by the colored crosses superimposed to the map at the top left panel (RIS map in the energy range 6 − 8 keV). The local spectra obtained by using the maps in Fig. 3 provided by RIS are in solid line, while the ones obtained by using the maps in the same figure but provided by MEM_GE when independently applied at each energy channel are in dashed line.
Current usage metrics show cumulative count of Article Views (full-text article views including HTML views, PDF and ePub downloads, according to the available data) and Abstracts Views on Vision4Press platform.
Data correspond to usage on the plateform after 2015. The current usage metrics is available 48-96 hours after online publication and is updated daily on week days.
Initial download of the metrics may take a while.