| Issue |
A&A
Volume 693, January 2025
|
|
|---|---|---|
| Article Number | A309 | |
| Number of page(s) | 10 | |
| Section | Extragalactic astronomy | |
| DOI | https://doi.org/10.1051/0004-6361/202452932 | |
| Published online | 29 January 2025 | |
Behind the dust veil: A panchromatic view of an optically dark galaxy at z = 4.82
1
Cosmic Dawn Center (DAWN), Copenhagen, Denmark
2
DTU-Space, Technical University of Denmark, Elektrovej 327, DK-2800 Kgs. Lyngby, Denmark
3
Niels Bohr Institute, University of Copenhagen, Jagtvej 128, DK-2200 Copenhagen, Denmark
4
Leiden Observatory, Leiden University, NL-2300 RA Leiden, The Netherlands
5
Instituto de Física, Pontificia Universidad Católica de Valparaíso, Casilla 4059, Valparaíso, Chile
6
Université Paris-Saclay, Université Paris Cité, CEA, CNRS, AIM, Paris, France
7
Department of Space, Earth, & Environment, Chalmers University of Technology, Chalmersplatsen 4, 412 96 Gothenburg, Sweden
8
Department of Physics, University of Helsinki, PO Box 64 00014 Helsinki, Finland
9
Max-Planck-Institut für Astronomie, Königstuhl 17, D-69117 Heidelberg, Germany
10
Academia Sinica Institute of Astronomy and Astrophysics (ASIAA), No. 1, Section 4, Roosevelt Rd., Taipei 106216, Taiwan
11
Department of Astronomy, University of Massachusetts, Amherst, MA 01003, USA
12
Hiroshima Astrophysical Science Center, Hiroshima University, 1-3-1 Kagamiyama, Higashi-Hiroshima, Hiroshima 739-8526, Japan
13
National Astronomical Observatory of Japan, 2-21-1, Osawa, Mitaka, Tokyo, Japan
14
Technical University of Munich, TUM School of Natural Sciences, Department of Physics, James-Franck-Str. 1, D-85748 Garching, Germany
15
Max-Planck-Institut für Astrophysik, Karl-Schwarzschild-Str. 1, D85748 Garching, Germany
16
Instituto de Física y Astronomía, Universidad de Valparaíso, Avda. Gran Bretana 1111, Valparaíso, Chile
17
Institute for Astronomy, University of Edinburgh, Royal Observatory, Blackford Hill, Edinburgh EH9 3HJ, UK
18
Department of Astronomy, Columbia University, New York, NY 10027, USA
19
University of Bologna– Department of Physics and Astronomy “Augusto Righi” (DIFA), Via Gobetti 93/2, I-40129 Bologna, Italy
20
INAF–Osservatorio di Astrofisica e Scienza dello Spazio, Via Gobetti 93/3, I-40129 Bologna, Italy
21
Caltech/IPAC, 1200 E. California Boulevard, Pasadena, CA 91125, USA
22
Department of Computer Science, Aalto University, PO Box 15400 Espoo 00 076, Finland
23
Center for Computational Astrophysics, Flatiron Institute, 162 Fifth Avenue, New York, NY 10010, USA
24
Department of Astronomy, The University of Texas at Austin, Austin, TX 78712, USA
25
Kapteyn Astronomical Institute, University of Groningen, Landleven 12, 9747 AD Groningen, The Netherlands
26
University of Bologna, Department of Physics and Astronomy (DIFA), Via Gobetti 93/2, I-40129 Bologna, Italy
27
Space Telescope Science Institute, 3700 San Martin Drive, Baltimore, MD 21218, USA
28
Department of Physics & Astronomy, University of California Los Angeles, 430 Portola Plaza, Los Angeles, CA 90095, USA
⋆ Corresponding authors; This email address is being protected from spambots. You need JavaScript enabled to view it.
, This email address is being protected from spambots. You need JavaScript enabled to view it.
Received:
8
November
2024
Accepted:
12
December
2024
Abstract
Optically dark dusty star-forming galaxies (DSFGs) play an essential role in massive galaxy formation at early cosmic time; however, their nature remains elusive. Here, we present a detailed case study of all the baryonic components of a z = 4.821 DSFG, XS55. Selected from the ultra-deep COSMOS-XS 3 GHz map with a red SCUBA-2 450 μm/850 μm colour, XS55 was followed up with ALMA 3 mm line scans and spectroscopically confirmed to be at z = 4.821 via detections of the CO(5-4) and [CI](1-0) lines. JWST/NIRCam imaging reveals that XS55 is a F150W drop-out with a red F277W/F444W colour and a complex morphology: a compact central component embedded in an extended structure with a likely companion. XS55 is tentatively detected in X-rays with both Chandra and XMM-Newton, suggesting an active galactic nucleus nature. By fitting a panchromatic spectral energy distribution spanning from near-infrared to radio wavelengths, we reveal that XS55 is a massive main-sequence galaxy with a stellar mass of M* = (5 ± 1)×1010 M⊙ and a star formation rate of SFR = 540 ± 177 M⊙ yr−1. The dust of XS55 is optically thick in the far-infrared with a surprisingly cold dust temperature of Tdust = 33 ± 2 K, making XS55 one of the coldest DSFGs at z > 4 known to date. This work unveils the nature of a radio-selected F150W drop-out, suggesting the existence of a population of DSFGs hosting active black holes embedded in optically thick dust.
Key words: galaxies: active / galaxies: general / galaxies: ISM
Marie Curie Fellow.
© The Authors 2025
 Open Access article, published by EDP Sciences, under the terms of the Creative Commons Attribution License (https://creativecommons.org/licenses/by/4.0), which permits unrestricted use, distribution, and reproduction in any medium, provided the original work is properly cited.
This article is published in open access under the Subscribe to Open model. This email address is being protected from spambots. You need JavaScript enabled to view it. to support open access publication.
1. Introduction
Optically faint or dark galaxies are a population of massive dusty star-forming galaxies (DSFGs) that are faint or undetected in deep optical images, while bright at longer wavelengths. This population includes but is not limited to the following samples: sub-millimetre galaxies (SMGs) (e.g., Walter et al. 2012), H-band drop-outs (e.g., Wang et al. 2019; Alcalde Pampliega et al. 2019; Smail et al. 2023), Ks-faint (e.g., Smail et al. 2021), Hubble Space Telescope (HST)-dark or faint galaxies (e.g., Franco et al. 2018; Pérez-González et al. 2023; Xiao et al. 2023; Gómez-Guijarro et al. 2023), and radio-selected near-infrared (NIR) dark galaxies (Algera et al. 2020; Talia et al. 2021; Enia et al. 2022; van der Vlugt et al. 2023; Gentile et al. 2024a,b). Recent studies have revealed that this population contributes significantly (10 − 40%) to the cosmic star formation rate density in the early Universe (z ∼ 3 − 6, Wang et al. 2019; Fudamoto et al. 2021; Talia et al. 2021; Enia et al. 2022; Shu et al. 2022; Xiao et al. 2023), and dominates the massive end of the stellar mass function at z ∼ 3 − 8 (Wang et al. 2019; Gottumukkala et al. 2024). This indicates that this population plays a significant role in cosmic star formation history, even up to 50% when the contribution is estimated from Lyman break galaxy selected samples at z ∼ 3 (Enia et al. 2022), but has been largely missed by previous optical/NIR surveys. Thanks to the unprecedented sensitivity and long wavelength coverage, the James Webb Space Telescope (JWST) can efficiently detect these objects and allows for detailed studies and a large sample census of optically faint galaxies. For example, Barrufet et al. (2023) studied the stellar emission of a sample of 30 HST-dark sources in the CEERS field with red colours through 1.6–4.4 μm in JWST/NIRCam filters, revealing them all to be heavily dust-obscured massive main-sequence galaxies that contribute significantly to the star formation rate density at high redshift. In a NIRSpec study of 23 HST-dark galaxies, Barrufet et al. (2024) found the majority to be massive (log(M*/M⊙) > 9.8) and highly attenuated (AV > 2) star-forming galaxies with a broad range of recent star formation activities. Kokorev et al. (2023) studied the multi-wavelength properties of an HST-dark galaxy at zspec = 2.58 with JWST/NIRCam data, revealing it to be a massive disc galaxy with log(M⋆/M⊙) > 11 and optically thick dust in the far-infrared (FIR). They also found that such objects would not be detected in JWST filters bluer than F356W if placed at z > 4, and becoming JWST-dark at z > 6 at current depths of major JWST surveys. Given their extreme faintness in optical and NIR wavelengths, and brightness in the FIR, sub-millimetre facilities like the Atacama Large Millimeter Array (ALMA) and Northern Extended Millimeter Array (NOEMA) are more efficient at confirming their redshifts via detecting CO and/or [CI] lines (e.g., Weiß et al. 2009; Walter et al. 2012; Riechers et al. 2013, 2017; Jin et al. 2019, 2022; Casey et al. 2019; Birkin et al. 2021; Chen et al. 2022; Gentile et al. 2024b), which hence revealed vigorous star-bursting activities with obscured star formation rates, SFR ∼ 300 − 3000 M⊙/yr, and large gas reservoirs, log Mgas/M⊙ ∼ 10.5 − 11.5, in these massive systems (e.g., Riechers et al. 2013; Jin et al. 2022). However, the spectroscopic sample is still small and strongly biased towards sources with the brightest sub-millimetre fluxes. Consequently, studies of this population strongly rely on photometric redshifts, which entail the risk of catastrophic failures. For example, Ling et al. (2024) reported an optically dark photo−z > 7 DSFG candidate using ten bands of JWST photometry; however, it was eventually confirmed at spec−z = 2.625 by Jin et al. (2024) via multiple CO and [CI] line detections. Evidently, robust spectroscopic confirmation is essential to uncover the nature of these extreme dusty objects.
Despite the limited sample of spectroscopically confirmed DSFGs, recent studies have revealed optically faint or dark DSFGs have optically thick dust in FIR, massive gas reservoirs, and an elevated star formation efficiency (SFE) compared to main-sequence galaxies (Jin et al. 2019, 2022; Kokorev et al. 2023). Nevertheless, it remains unclear whether active galactic nuclei (AGNs) are present in these systems. As both X-ray and optical AGN features can be severely attenuated by dust, the AGN fraction of DSFGs could be largely underestimated (Franco et al. 2018). Therefore, panchromatic studies including deep radio observations (e.g, Delvecchio et al. 2017; Algera et al. 2020; van der Vlugt et al. 2021, 2023; Gentile et al. 2024b) are key to identify potential AGN activity in these systems. As previous studies focussed either on the stellar or interstellar medium (ISM) components, comprehensive studies of all baryonic components (stellar, dust, and gas) and AGN activity are essential to unveil their nature.
In this paper, we report the spectroscopic confirmation of the radio-selected DSFG XS55 and provide a panchromatic view of its stellar, dust, and gas components and associated AGN activity. We adopt a flat cosmology with H0 = 70 km s−1 Mpc−1, ΩM = 0.27, and ΩΛ = 0.73, and use a Chabrier (2003) initial mass function. All magnitudes are in the AB system (Oke 1974).
2. Selection and data
2.1. Selection
XS55 was originally selected in the COSMOS-XS (Algera et al. 2020; van der Vlugt et al. 2021) catalogue with an ID = 55; hence, we dubbed it XS55. It is detected in the ultra-deep COSMOS-XS S-band image with S3 GHz = 6.35 ± 0.96 μJy, but undetected in the less deep COSMOS 3 GHz map (rms = 2.5 μJy, Smolčić et al. 2017), and detected in the MeerKAT image with S1.3 GHz = 10.9 ± 2.1 μJy (Jarvis et al. 2016; Heywood et al. 2022; Hale et al. 2024). XS55 has no optical counterpart (i.e. it is optically dark) and is not included in the COSMOS2020 catalogue (Weaver et al. 2022). It drops out in JWST F115W and F150W images, but is detected in IRAC 4.5 μm (Fig. 1) and tentatively detected (∼3σ) in the ALMA 2 mm MORA map (Casey et al. 2021). By performing the super-deblending technique (Jin et al. 2018; Liu et al. 2018) with the radio prior, we measured the deblended Herschel and SCUBA-2 photometry of XS55. Interestingly, it is not detected in Herschel images (3σ limiting depths: 250 μm = 5.3 mJy, 350 μm = 8.0 mJy, 500 μm = 8.7 mJy, Jin et al. 2018), but it is well detected in two SCUBA-2 bands, 450 μm (Gao et al. 2024) and 850 μm (Simpson et al. 2019), with a red 450 μm/850 μm colour (S450 μm = 5.6 ± 1.4 mJy, S850 μm = 5.7 ± 0.8 mJy). Assuming typical dust templates from Magdis et al. (2012), the red SCUBA-2 colour suggests a FIR photometric redshift of z > 6. Consequently, XS55 was followed up by two ALMA 3 mm line scan projects in Cycle 9 (ID: 2022.1.00884, PI: R. Gobat; ID: 2022.1.00863.S, PI: J. Hodge).
2.2. ALMA
The two ALMA programmes were observed for a total of 1.9 hours on source. The frequency set-ups are identical in the two programs, adopting the same set-ups as in Jin et al. (2019) and covering 84–108 GHz with three tunings. We produced measurement sets with the Common Astronomy Software Applications (CASA, McMullin et al. 2007) pipeline for each observation programme. Following the methods presented in Jin et al. (2022), Zhou et al. (2024), and Sillassen et al. (2024), the calibrated data were converted to a uv table format and analysed with the GILDAS software package in uv space. To enhance the signals, the uv tables from the two programs were combined using the task uv_merge. The final products reach a continuum sensitivity of 9.6 μJy/beam with a spatial resolution of  , and a line sensitivity of 12 mJy/beam over 500 km/s at ∼99 GHz. As is shown in Fig. 2 and Section 3.1, we robustly detect continuum (∼14σ) and two lines (∼10σ and ∼4σ). The dust continuum is well fitted by a point-source model using GILDAS uvfit, while fitting with an elliptical Gaussian does not yield useful constraints. Therefore, the dust continuum is unresolved, and we have placed an upper limit on the continuum size using Eq. (2) from Gómez-Guijarro et al. (2022) (Table 2).
Measured properties of XS55 emission lines.
Fitted and inferred physical properties of XS55.
2.3. JWST
XS55 was observed with JWST/NIRCam in the F115W, F150W, F277W, and F444W bands, as part of the COSMOS-Web survey (Casey et al. 2023). We used the image product versions from the Dawn JWST Archive (DJA1, Valentino et al. 2023), and furthermore verified that these are consistent with the COSMOS-Web team’s map (Shuntov et al. in prep.). XS55 is well detected in both F277W (∼10σ) and F444W (∼36σ), but not detected in both F115W and F150W (< 3σ), consistent with the H drop-out selection from Wang et al. (2019).
2.4. X-ray
The COSMOS field has been fully observed in soft (0.5–2.0 keV) and hard (2.0–10 keV) X-rays with both XMM-Newton (50 ks per pointing, PI: G. Hasinger; Hasinger et al. 2007) and Chandra (∼180 ks exposure) as part of the Chandra COSMOS (C-COSMOS, PI: M. Elvis; Elvis et al. 2009) and Chandra COSMOS Legacy (PI: F. Civano; Civano et al. 2016) surveys. As is shown in Figs. 1 and 3, XS55 is tentatively detected in the soft X-ray band of Chandra with a 2.1σ significance, and detected in the stacked soft, medium, and hard X-ray XMM-Newton images with a 3.1σ significance.
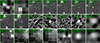 |
Fig. 1. Multi-wavelength cut-out images of XS55. The instrument, wavelength, and field of view are shown in green text in each panel. |
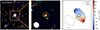 |
Fig. 3. Multi-wavelength images of XS55. Left: COSMOS-XS 3 GHz map (van der Vlugt et al. 2021) overlaid with 2, 3σ 0.5 − 7 keV contours from Chandra, smoothed with a 1″ Gaussian, in purple. Middle: JWST colour image of XS55 representing F115W+F105W, F277W, and F444W as blue, green, and red channels, respectively. Overlaid are ALMA 3 mm continuum emission contours at 5, 8, and 11σ, with the beam size shown as a white ellipse. Right: Moment-1 map of CO(5-4) masked at 3σ in moment-0, overlaid with integrated CO(5-4) at 3, 4, and 5σ levels and JWST/F444W contours at 5, 8, and 11σ levels in yellow and black, respectively. |
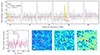 |
Fig. 2. ALMA 3 mm observations of XS55. Top: ALMA 3 mm spectrum of XS55. The red line shows the line-free continuum, and the dotted blue line indicates the flux error per channel at a 1σ level. The spectroscopic redshift is shown in text, along with the velocity width of the channels. Bottom left: Velocity space spectrum of CO(5-4) (blue) and [CI](1-0) (red) at z = 4.8214, the uncertainty per channel is shown as dashed lines. Bottom right: Continuum and continuum-subtracted moment-0 line maps of XS55. Contour levels are 5, 8, and 11σ for the continuum, and 3, 4, and 5σ for the line maps. The beam size is shown as a white ellipse, and the peak JWST/F444W position is marked by a grey cross. |
3. Results
3.1. Redshift identification
After extracting the ALMA spectra in all spectral windows, we combined them into a single 1D spectrum (Fig. 2), and ran a line-searching algorithm, as in Jin et al. (2019), to search for emission line features with the highest significance. The continuum was fitted with a power law with fixed slope of 3.7 in frequency (assuming β ≈ 1.7, Magdis et al. 2012; Sillassen et al. 2024), masking out the channels of significant emission lines. The detected emission lines were fitted with a Gaussian profile in the continuum subtracted spectrum. XS55 is detected in the 3 mm continuum at ∼14σ with a flux of 134.2 ± 9.3 μJy at ∼96 GHz. One line is detected at 98.99 GHz at 9.8σ (see Fig. 2), and we searched for other lines in the spectrum consistent with this detection. We found a 3.9σ detection at 84.58 GHz. The two lines are consistent with CO(5-4) and [CI](1-0) at z = 4.8214 ± 0.0004. We note that there is a slight velocity offset between the CO and CI line peaks of ∼141 km/s (Fig. 2). By defining the [CI] line range using the velocity range of the CO line, the [CI] S/N is 3.3σ, yielding a low Pchance = 0.4%, where Pchance is the chance probability of finding a spurious second line (Jin et al. 2019). Further, we compared the redshift solution with the NIR spectral energy distribution (SED) fitted redshift probability distribution PDF(z) of LePhare in the COSMOS-Web catalogue ( , Shuntov et al. in prep.), and found they are in excellent agreement (Fig. 4). For a sanity check, we tested the redshift solution of z = 3.66 in the case of the bright line being CO(4-3), as this redshift is seemingly consistent with the second peak of the NIR PDF(z). However, we found that z = 3.66 is very unlikely, because (1) the z = 3.66 [CI](1-0) is not detected at the expected frequency of 105.6 GHz (< 1σ), and (2) the SED fitting at z = 3.66 yields an abnormally high dust-mass-to-stellar-mass fraction, 0.09 < Mdust/M* < 0.13, which is > 10× above typical values (e.g., Donevski et al. 2020), again disfavouring the z = 3.66 solution. Therefore, a multitude of evidence confirms the redshift of XS55 to be z = 4.8214 ± 0.0004.
3.2. Morphology
We modelled the F277W and F444W morphology of XS55 using Galfit (Peng et al. 2010). We adopted three separate components in both F277W and F444W: a compact central emission, a diffuse central emission, and a companion component to the south-east. The NIRCam PSFs were obtained using Webbpsf (Perrin et al. 2014) with a pixel scale of  . We considered two cases: one case using a point source (compact component) together with two Sérsic profiles (diffuse component and companion), and another case with three separate Sérsic profiles. In the case using a point source and two Sérsic models in F444W, there is a ring of emission left in the residual (Fig. A.1, middle right), suggesting that the brightest part of the galaxy is marginally resolved, or the PSF modelling is imperfect. In the case of the three Sérsic profiles, there are no clear structures, as would be expected with random noise (Fig. A.1-top). In the three-Sérsic-profile model of F444W, the compact component has a size of
  , corresponding to Re = 0.40 ± 0.05 kpc, with a Sérsic index of n < 1.2, while the diffuse emission and the companion have sizes and Sérsic indices of Re = 1.7 ± 0.1 kpc, n = 0.37 ± 0.08, and Re = 1.1 ± 0.1 kpc, n = 0.61 ± 0.33, respectively (tab:sizes). In F444W, 33 ± 3% of the total flux is coming from the compact component, while 53 ± 3% is coming from the extended diffuse component, and 14 ± 3% is coming from the companion. In JWST/F277W, the fit of the compact component yields a bulge-like n = 2.6 ± 0.8 model with Re = 0.58 ± 0.07 kpc (tab:sizes), providing 87 ± 2% of the total flux. The diffuse component cannot be fitted, and the fit to the companion yields a n = 2.0 ± 1.4 model with Re = 1.7 ± 0.5 kpc, providing 13 ± 2% of the total flux (sec:morphology and tab:sizes). At this redshift, [OIII]λλ4959, 5007 and Hβ fall within the JWST/F277W filter; consequently, the flux is possibly boosted by line emission (Fig. 4).
3.3. FIR SED
To estimate the dust mass (Mdust) and temperature (Tdust), we fitted the FIR and sub-millimetre photometry of XS55 with a modified black-body (MBB) model (Magdis et al. 2012) using the code mercurius (Witstok et al. 2022). We explored two cases: one assuming optically thin dust and another assuming ‘self-consistent’ optically thick dust. In the optically thick case, we placed an upper limit on the emitting area based on the half-light radius of the galaxy in JWST/F444W (9.08 kpc2; sec:morphology). The resulting fit and corresponding parameters are shown in Fig. B.1 and Table 2. In both cases, the IR spectral index, βIR, is consistent with a weighted average of βIR = 2.0 ± 0.1. In the optically thin case, we recovered a low dust temperature of  , with an accompanying high dust mass of
  . On the other hand, the optically thick dust yields a higher
  and a lower
  .
.
To construct a panchromatic SED of XS55, we fitted the stellar, AGN, and dust components using STARDUST (Kokorev et al. 2021) and available photometry from optical to radio wavelengths, yielding an IR luminosity of LIR = (5.4 ± 1.8)×1012 L⊙ and SFRIR = 540 ± 180 M⊙ yr−1. For the stellar component, we recovered the stellar mass log(M*/M⊙) = 10.7 ± 0.1, attenuated by Av = 2.2 ± 0.3 mag. As an additional check, we also fitted the stellar part of the spectrum (up to F444W) using Bagpipes2 (Carnall et al. 2018), using the same parameters as in Jin et al. (2024), yielding physical properties similar to those from STARDUST, log(M*, bagpipes/M⊙) = 10.7 ± 0.1, Av, bagpipes = 2.1 ± 0.3. The physical parameters calculated with LePhare in the COSMOS-Web catalogue (Shuntov et al. in prep.) also agree with our results (log(M*, LePhare/M⊙) = 10.8 ± 0.3, E(B − V)LePhare = 1.1). The resulting panchromatic SED and corresponding properties from STARDUST, and the MBB fit from mercurius, are shown in Fig. 4 and Table 2.
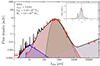 |
Fig. 4. NIR to radio SED of XS55, fitted using STARDUST (Kokorev et al. 2021). The total SED (black) is shown with its different components: stellar (blue), dust (red), and radio (magenta). An optically thick MBB (Magdis et al. 2012), fitted with mercurius (Witstok et al. 2022), is shown with a green line. The MBB is not accounted for in the total SED fit. The radio component was extrapolated using the stellar-mass-dependent IR-radio relation from Delvecchio et al. (2021). The NIR PDF(z) of XS55 is shown as an inset with the spec-z marked by a vertical red line. |
3.4. Molecular gas mass and far-infrared lines
With the derived dust mass, we inferred a molecular gas mass (Mmol) using the standard gas-to-dust mass ratio of star-forming galaxies (δgdr = 100, assuming solar metallicity, Magdis et al. 2012), yielding  and
and  . Furthermore, based on the detection of the [CI](1-0) line (tab:measuredSPSUNDSCRproperties), we inferred the molecular gas mass, Mmol/αCI = (1.8 ± 0.5)×1011/αCI M⊙, where
  (Dunne et al. 2022), which is consistent with other calibrations (Valentino et al. 2018; Heintz & Watson 2020). Adopting instead αCI = 4.1 ± 1.4 M⊙ K−1 km−1 s pc−2 from Frias Castillo et al. (2024) for high-z SMGs yields Mmol = (4.3 ± 1.9)×1010 M⊙. Interestingly, the CO(5-4) emission is marginally resolved in the north-east to south-west direction (see Figs. 2 and 3), as the minor axis of the CO emission as well as the continuum source are unresolved, and we obtained upper limits on their sizes using Eq. (2) of Gómez-Guijarro et al. (2022). We measured the size of the integrated CO(5-4) emission by fitting an elliptical Gaussian in uv space with GILDAS/uvfit, and obtained Re = 1.79 ± 1.22 kpc with PA = 28 ± 20 deg. We constructed the CO(5-4) moment-1 map using the Cube Analysis and Rendering Tool for Astronomy (CARTA; Comrie et al. 2021, Fig. 3-right). In the moment-1 map, there is a clear velocity gradient, with the highest redshifted velocity being 70 km/s and the highest blueshifted velocity being −130 km/s. This velocity gradient is comparable to that of the radio selected NIR-dark galaxies from Gentile et al. (2024b). We discuss the possible interpretations of the extended CO(5-4) emission in Sect. 4.2.
3.5. Obscured active galactic nucleus
XS55 is tentatively detected in X-ray with both Chandra and XMM-Newton (Figs. 3, 1). Using a 3″ radius aperture that corresponds to the mean PSF of the Chandra COSMOS Legacy Survey (Civano et al. 2016), we detected three counts in the 0.5–2 keV band of Chandra. This corresponds to a flux of f[0.5 − 2 keV] = (1.15 ± 0.54)×10−16 erg s−1 cm−2 adopting the conversion rate from Civano et al. (2016). Since XS55 is extremely dusty, this flux should be considered a lower limit, yielding a soft X-ray luminosity of L[0.5 − 2 keV] > 2.81 × 1043 erg s−1. Using the soft X-ray to bolometric luminosity correction from Lusso et al. (2012), we obtained a bolometric luminosity of Lbol > 5.35 × 1044 erg s−1. XS55 would be an X-ray selected AGN using the criterion from Riccio et al. (2023) (i.e. L0.2 − 2.3keV ≥ 3 × 1042 erg s−1). Due to the low significance of the X-ray detection, we cannot exclude that the detection could be spurious, or is originating from star formation. XS55 does not show excess radio emission compared to the infrared radio correlation of Delvecchio et al. (2021); however, this could be due to the large scatter of IR-radio correlation that is largely unconstrained at z ∼ 5 (Delvecchio et al. 2021). Furthermore, while radio excess is a clear indicator of AGN activity, X-ray AGNs are not necessarily radio-loud.
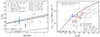 |
Fig. 5. Dust properties of XS55. Left: Dust temperature vs. redshift for XS55 and literature samples. The Td − z relation of main-sequence galaxies from Schreiber et al. (2018) is shown as a black line, with the uncertainty as the shaded grey area. The literature samples are from Riechers et al. (2013, 2014, 2017), Marrone et al. (2018), Pavesi et al. (2018), Faisst et al. (2020), Jin et al. (2019, 2022), Fudamoto et al. (2023), and Algera et al. (2024a,b). The CMB temperature as a function of redshift is shown as a dashed black line. Right: Infrared luminosity surface density as a function of dust temperature, assuming optically thick dust. The surface density limit as defined by the Stefan-Boltzman law of optically thin dust is shown as a black line, while grey-bodies with varying λeff are shown as dashed lines. The literature samples are from Simpson et al. (2017), Hodge et al. (2019), and Jin et al. (2019, 2022). |
4. Discussion
4.1. Intrinsically cold or optically thick dust
To determine whether XS55 is intrinsically cold, or optically thick dust is making it appear cold, we applied three methods of diagnosing optically thick dust from Jin et al. (2022): (1) We compared the molecular gas masses derived from [CI](1-0) emission with gas mass inferred by both thin and thick Mdust. We find that the lower gas mass from the thick dust model is in good agreement with the [CI]-derived gas mass, assuming δgdr = 100 and α[CI] = 17 ± 3 M⊙ K−1 km−1 s pc−2, while the gas mass from the thin dust model is likely overestimated. (2) We estimated the dust opacity at 100 μm, τ100 μm = κρRe, where κ is adopted from Jones et al. (2013), and ρ is the volumetric dust density assuming spherical symmetry, using Re from dust continuum (Re < 1.76 kpc). This yields τ100 μm, thin > 1.6, and τ100 μm, thick > 1.2. Furthermore, we calculated the surface SFR density and find ΣSFR > 37 M⊙ yr−1 kpc−2. With both τ100 μm > 1 and ΣSFR > 20 M⊙ yr−1 kpc−2, the dust is hence optically thick (Jin et al. 2022). (3) We derived a lower limit for the IR luminosity surface density, ΣIR > 3.7 × 10¹¹ L⊙ kpc−2, and placed it on the ΣIR − Tdust diagram. As is seen in Fig. 5-right, the thin case is clearly violating the black-body Stefan-Boltzmann law, and the optically thick case is more favourable. Therefore, these pieces of evidence together imply that the dust of XS55 is optically thick in the FIR.
Interestingly, the recovered Tdust assuming optically thick dust remains cold. Compared to the redshift evolution of Tdust in main-sequence galaxies (Schreiber et al. 2018; Jin et al. 2022), the thick dust solution is 0.13 dex (∼4σ) below the relation (Fig. 5). This makes XS55 one of the coldest DSFGs at z > 4 discovered to date (e.g., Faisst et al. 2020; Jin et al. 2022; Algera et al. 2024a). Since the dust temperature is proportional to the radiation field (i.e., ⟨U⟩=(Td/18.9)6.04, Magdis et al. 2012), and the radiation field is proportional to the ratio of SFE to metallicity (i.e., ⟨U⟩∝SFE/Z, Magdis et al. 2012), and given that XS55 has typical SFE of DSFGs, the intrinsically low dust temperature could suggest a high metallicity in XS55, where the cooling is more efficient.
4.2. Origin of extended CO(5-4)
Interestingly, the CO(5-4) is more extended than the dust continuum size and shows a tentative velocity gradient. These properties could suggest a rotating molecular disc (e.g., Rizzo et al. 2023) with compact star formation (e.g., Cochrane et al. 2019). However, given the low spatial resolution of the CO data, high-resolution data are needed to confirm whether it is a rotating disc (e.g., Rowland et al. 2024). As is suggested by the complex JWST morphology, a galaxy interaction or merger can also account for the extended CO(5-4) emission. Furthermore, given the possible AGN nature of XS55 and that the CO(5-4) is only resolved in one direction, a molecular outflow driven by a central AGN (e.g., Lutz et al. 2020) is also a potential scenario. To disentangle the above scenarios, a high-resolution [CII] follow-up would be ideal to reveal the kinematics of XS55.
4.3. Why this source is optically faint
In nearly all terms, XS55 is a normal but massive main-sequence star-forming galaxy at z = 4.8214, within 2σ of the Schreiber et al. (2015) main-sequence relation (ΔMS(SFR/SFRMS) = 2.4 ± 0.9). Its SFE, and thereby its depletion time of 300 ± 100 Myr, is comparable to other optically faint galaxies at similar redshift (e.g., Jin et al. 2019, 2022). However, with the compact stellar (Re = 1.72 ± 0.13 kpc) and dust continuum (Re < 1.76 kpc) sizes, XS55 falls 2.6× below the mass-size relation of main-sequence galaxies (Ward et al. 2024). The compact size, together with a massive amount of dust, could explain the optically faint nature of this source, in agreement with observations from Gómez-Guijarro et al. (2023) and simulations from Cochrane et al. (2024).
5. Conclusions
By combining ALMA spectroscopy with JWST imaging and multi-wavelength ancillary data in the COSMOS field, we have presented a detailed study of a newly discovered, radio-selected, optically faint galaxy, XS55. ALMA detections of the CO(5-4) and [CI](1-0) lines places the source at z = 4.8214, and reveals the presence of large amounts of dust in the ISM (Mdust = (1.7 ± 0.5)×109 M⊙). XS55 is a compact massive main-sequence galaxy with an extremely cold dust temperature and optically thick FIR emission. The F444W size of the source falls below the mass-size relation. The tentative X-ray emission and the compactness of the central component suggest the presence of an AGN. The compactness together with the massive amount of cold dust in XS55 naturally explain its optical faintness.
Acknowledgments
We thank the anonymous referee for constructive comments, improving this manuscript. This paper makes use of the following ALMA data: ADS/JAO.ALMA#2022.1.00884.S, 2022.1.00863.S and 2021.1.00225.S. ALMA is a partnership of ESO (representing its member states), NSF (USA) and NINS (Japan), together with NRC (Canada), MOST and ASIAA (Taiwan), and KASI (Republic of Korea), in cooperation with the Republic of Chile. The Joint ALMA Observatory is operated by ESO, AUI/NRAO and NAOJ. Some of the data products presented herein were retrieved from the Dawn JWST Archive (DJA). DJA is an initiative of the Cosmic Dawn Center (DAWN). The Cosmic Dawn Center (DAWN) is funded by the Danish National Research Foundation under grant DNRF140. SJ acknowledges financial support from the European Union’s Horizon Europe research and innovation program under the Marie Skłodowska-Curie grant No. 101060888. GEM and SJ acknowledge the Villum Fonden research grants 37440 and 13160. JH acknowledges support from the ERC Consolidator Grant 101088676 (“VOYAJ”). CCC acknowledges the support of the Taiwan National Science and Technology Council (111-2112M-001-045-MY3), as well as the Academia Sinica through the Career Development Award (AS-CDA-112-M02). KK acknowledges support from the Knut and Alice Wallenberg Foundation (KAW 2017.0292 and 2019.0443).
References
- Alcalde Pampliega, B., Pérez-González, P. G., Barro, G., et al. 2019, ApJ, 876, 135 [NASA ADS] [CrossRef] [Google Scholar]
- Algera, H. S. B., van der Vlugt, D., Hodge, J. A., et al. 2020, ApJ, 903, 139 [Google Scholar]
- Algera, H. S. B., Inami, H., De Looze, I., et al. 2024a, MNRAS, 533, 3098 [NASA ADS] [CrossRef] [Google Scholar]
- Algera, H. S. B., Inami, H., Sommovigo, L., et al. 2024b, MNRAS, 527, 6867 [Google Scholar]
- Barrufet, L., Oesch, P. A., Weibel, A., et al. 2023, MNRAS, 522, 449 [NASA ADS] [CrossRef] [Google Scholar]
- Barrufet, L., Oesch, P., Marques-Chaves, R., et al. 2024, arXiv e-prints [arXiv:2404.08052] [Google Scholar]
- Birkin, J. E., Weiss, A., Wardlow, J. L., et al. 2021, MNRAS, 501, 3926 [Google Scholar]
- Carnall, A. C., McLure, R. J., Dunlop, J. S., & Davé, R. 2018, MNRAS, 480, 4379 [Google Scholar]
- Casey, C. M., Zavala, J. A., Aravena, M., et al. 2019, ApJ, 887, 55 [Google Scholar]
- Casey, C. M., Zavala, J. A., Manning, S. M., et al. 2021, ApJ, 923, 215 [NASA ADS] [CrossRef] [Google Scholar]
- Casey, C. M., Kartaltepe, J. S., Drakos, N. E., et al. 2023, ApJ, 954, 31 [NASA ADS] [CrossRef] [Google Scholar]
- Chabrier, G. 2003, PASP, 115, 763 [Google Scholar]
- Chen, C.-C., Liao, C.-L., Smail, I., et al. 2022, ApJ, 929, 159 [NASA ADS] [CrossRef] [Google Scholar]
- Civano, F., Marchesi, S., Comastri, A., et al. 2016, ApJ, 819, 62 [Google Scholar]
- Cochrane, R. K., Hayward, C. C., Anglés-Alcázar, D., et al. 2019, MNRAS, 488, 1779 [NASA ADS] [CrossRef] [Google Scholar]
- Cochrane, R. K., Anglés-Alcázar, D., Cullen, F., & Hayward, C. C. 2024, ApJ, 961, 37 [NASA ADS] [CrossRef] [Google Scholar]
- Comrie, A., Wang, K.-S., Hsu, S.-C., et al. 2021, https://doi.org/10.5281/zenodo.4905459 [Google Scholar]
- Delvecchio, I., Smolčić, V., Zamorani, G., et al. 2017, A&A, 602, A3 [NASA ADS] [CrossRef] [EDP Sciences] [Google Scholar]
- Delvecchio, I., Daddi, E., Sargent, M. T., et al. 2021, A&A, 647, A123 [NASA ADS] [CrossRef] [EDP Sciences] [Google Scholar]
- Donevski, D., Lapi, A., Małek, K., et al. 2020, A&A, 644, A144 [NASA ADS] [CrossRef] [EDP Sciences] [Google Scholar]
- Dunne, L., Maddox, S. J., Papadopoulos, P. P., Ivison, R. J., & Gomez, H. L. 2022, MNRAS, 517, 962 [NASA ADS] [CrossRef] [Google Scholar]
- Elvis, M., Civano, F., Vignali, C., et al. 2009, ApJS, 184, 158 [Google Scholar]
- Enia, A., Talia, M., Pozzi, F., et al. 2022, ApJ, 927, 204 [NASA ADS] [CrossRef] [Google Scholar]
- Faisst, A. L., Fudamoto, Y., Oesch, P. A., et al. 2020, MNRAS, 498, 4192 [NASA ADS] [CrossRef] [Google Scholar]
- Franco, M., Elbaz, D., Béthermin, M., et al. 2018, A&A, 620, A152 [NASA ADS] [CrossRef] [EDP Sciences] [Google Scholar]
- Frias Castillo, M., Rybak, M., Hodge, J. A., et al. 2024, arXiv e-prints [arXiv:2404.05596] [Google Scholar]
- Fudamoto, Y., Oesch, P. A., Schouws, S., et al. 2021, Nature, 597, 489 [CrossRef] [Google Scholar]
- Fudamoto, Y., Inoue, A. K., & Sugahara, Y. 2023, MNRAS, 521, 2962 [NASA ADS] [CrossRef] [Google Scholar]
- Gao, Z.-K., Lim, C.-F., Wang, W.-H., et al. 2024, ApJ, 971, 117 [NASA ADS] [CrossRef] [Google Scholar]
- Gentile, F., Talia, M., Behiri, M., et al. 2024a, ApJ, 962, 26 [NASA ADS] [CrossRef] [Google Scholar]
- Gentile, F., Talia, M., Daddi, E., et al. 2024b, A&A, 687, A288 [NASA ADS] [CrossRef] [EDP Sciences] [Google Scholar]
- Gómez-Guijarro, C., Elbaz, D., Xiao, M., et al. 2022, A&A, 658, A43 [NASA ADS] [CrossRef] [EDP Sciences] [Google Scholar]
- Gómez-Guijarro, C., Magnelli, B., Elbaz, D., et al. 2023, A&A, 677, A34 [NASA ADS] [CrossRef] [EDP Sciences] [Google Scholar]
- Gottumukkala, R., Barrufet, L., Oesch, P. A., et al. 2024, MNRAS, 530, 966 [NASA ADS] [CrossRef] [Google Scholar]
- Hale, C. L., Heywood, I., Jarvis, M. J., et al. 2024, MNRAS, 536, 2187 [Google Scholar]
- Hasinger, G., Cappelluti, N., Brunner, H., et al. 2007, ApJS, 172, 29 [NASA ADS] [CrossRef] [Google Scholar]
- Heintz, K. E., & Watson, D. 2020, ApJ, 889, L7 [Google Scholar]
- Heywood, I., Jarvis, M. J., Hale, C. L., et al. 2022, MNRAS, 509, 2150 [Google Scholar]
- Hodge, J. A., Smail, I., Walter, F., et al. 2019, ApJ, 876, 130 [Google Scholar]
- Jarvis, M., Taylor, R., Agudo, I., et al. 2016, in MeerKAT Science: On the Pathway to the SKA, 6 [Google Scholar]
- Jin, S., Daddi, E., Liu, D., et al. 2018, ApJ, 864, 56 [Google Scholar]
- Jin, S., Daddi, E., Magdis, G. E., et al. 2019, ApJ, 887, 144 [Google Scholar]
- Jin, S., Daddi, E., Magdis, G. E., et al. 2022, A&A, 665, A3 [NASA ADS] [CrossRef] [EDP Sciences] [Google Scholar]
- Jin, S., Sillassen, N. B., Hodge, J., et al. 2024, A&A, 690, L16 [NASA ADS] [CrossRef] [EDP Sciences] [Google Scholar]
- Jones, A. P., Fanciullo, L., Köhler, M., et al. 2013, A&A, 558, A62 [NASA ADS] [CrossRef] [EDP Sciences] [Google Scholar]
- Kokorev, V. I., Magdis, G. E., Davidzon, I., et al. 2021, ApJ, 921, 40 [NASA ADS] [CrossRef] [Google Scholar]
- Kokorev, V., Jin, S., Magdis, G. E., et al. 2023, ApJ, 945, L25 [NASA ADS] [CrossRef] [Google Scholar]
- Ling, C., Sun, B., Cheng, C., et al. 2024, ApJ, 969, L28 [NASA ADS] [CrossRef] [Google Scholar]
- Liu, D., Daddi, E., Dickinson, M., et al. 2018, ApJ, 853, 172 [Google Scholar]
- Lusso, E., Comastri, A., Simmons, B. D., et al. 2012, MNRAS, 425, 623 [Google Scholar]
- Lutz, D., Sturm, E., Janssen, A., et al. 2020, A&A, 633, A134 [NASA ADS] [CrossRef] [EDP Sciences] [Google Scholar]
- Magdis, G. E., Daddi, E., Béthermin, M., et al. 2012, ApJ, 760, 6 [NASA ADS] [CrossRef] [Google Scholar]
- Marrone, D. P., Spilker, J. S., Hayward, C. C., et al. 2018, Nature, 553, 51 [NASA ADS] [CrossRef] [Google Scholar]
- McMullin, J. P., Waters, B., Schiebel, D., Young, W., & Golap, K. 2007, in Astronomical Data Analysis Software and Systems XVI, eds. R. A. Shaw, F. Hill, & D. J. Bell, Astronomical Society of the Pacific Conference Series, 376, 127 [Google Scholar]
- Oke, J. B. 1974, ApJS, 27, 21 [Google Scholar]
- Pavesi, R., Riechers, D. A., Sharon, C. E., et al. 2018, ApJ, 861, 43 [Google Scholar]
- Peng, C. Y., Ho, L. C., Impey, C. D., & Rix, H.-W. 2010, AJ, 139, 2097 [Google Scholar]
- Pérez-González, P. G., Barro, G., Annunziatella, M., et al. 2023, ApJ, 946, L16 [CrossRef] [Google Scholar]
- Perrin, M. D., Sivaramakrishnan, A., Lajoie, C.-P., et al. 2014, in Space Telescopes and Instrumentation 2014: Optical, Infrared, and Millimeter Wave, eds. J. M. Oschmann, Jr. M. Clampin, G. G. Fazio, & H. A. MacEwen, Society of Photo-Optical Instrumentation Engineers (SPIE) Conference Series, 9143, 91433X [CrossRef] [Google Scholar]
- Riccio, G., Yang, G., Małek, K., et al. 2023, A&A, 678, A164 [NASA ADS] [CrossRef] [EDP Sciences] [Google Scholar]
- Riechers, D. A., Bradford, C. M., Clements, D. L., et al. 2013, Nature, 496, 329 [Google Scholar]
- Riechers, D. A., Carilli, C. L., Capak, P. L., et al. 2014, ApJ, 796, 84 [Google Scholar]
- Riechers, D. A., Leung, T. K. D., Ivison, R. J., et al. 2017, ApJ, 850, 1 [Google Scholar]
- Rizzo, F., Roman-Oliveira, F., Fraternali, F., et al. 2023, A&A, 679, A129 [NASA ADS] [CrossRef] [EDP Sciences] [Google Scholar]
- Rowland, L. E., Hodge, J., Bouwens, R., et al. 2024, MNRAS, 535, 2068 [Google Scholar]
- Schreiber, C., Pannella, M., Elbaz, D., et al. 2015, A&A, 575, A74 [NASA ADS] [CrossRef] [EDP Sciences] [Google Scholar]
- Schreiber, C., Elbaz, D., Pannella, M., et al. 2018, A&A, 609, A30 [NASA ADS] [CrossRef] [EDP Sciences] [Google Scholar]
- Shu, X., Yang, L., Liu, D., et al. 2022, ApJ, 926, 155 [NASA ADS] [CrossRef] [Google Scholar]
- Sillassen, N. B., Jin, S., Magdis, G. E., et al. 2024, A&A, 690, A55 [NASA ADS] [CrossRef] [EDP Sciences] [Google Scholar]
- Simpson, J. M., Smail, I., Swinbank, A. M., et al. 2017, ApJ, 839, 58 [NASA ADS] [CrossRef] [Google Scholar]
- Simpson, J. M., Smail, I., Swinbank, A. M., et al. 2019, ApJ, 880, 43 [NASA ADS] [CrossRef] [Google Scholar]
- Smail, I., Dudzevičiūtė, U., Stach, S. M., et al. 2021, MNRAS, 502, 3426 [NASA ADS] [CrossRef] [Google Scholar]
- Smail, I., Dudzevičiūtė, U., Gurwell, M., et al. 2023, ApJ, 958, 36 [NASA ADS] [CrossRef] [Google Scholar]
- Smolčić, V., Novak, M., Bondi, M., et al. 2017, A&A, 602, A1 [Google Scholar]
- Talia, M., Cimatti, A., Giulietti, M., et al. 2021, ApJ, 909, 23 [NASA ADS] [CrossRef] [Google Scholar]
- Valentino, F., Magdis, G. E., Daddi, E., et al. 2018, ApJ, 869, 27 [Google Scholar]
- Valentino, F., Brammer, G., Gould, K. M. L., et al. 2023, ApJ, 947, 20 [NASA ADS] [CrossRef] [Google Scholar]
- van der Vlugt, D., Algera, H. S. B., Hodge, J. A., et al. 2021, ApJ, 907, 5 [NASA ADS] [CrossRef] [Google Scholar]
- van der Vlugt, D., Hodge, J. A., Jin, S., et al. 2023, ApJ, 951, 131 [NASA ADS] [CrossRef] [Google Scholar]
- Walter, F., Decarli, R., Carilli, C., et al. 2012, Nature, 486, 233 [Google Scholar]
- Wang, T., Schreiber, C., Elbaz, D., et al. 2019, Nature, 572, 211 [Google Scholar]
- Ward, E., de la Vega, A., Mobasher, B., et al. 2024, ApJ, 962, 176 [NASA ADS] [CrossRef] [Google Scholar]
- Weaver, J. R., Kauffmann, O. B., Ilbert, O., et al. 2022, ApJS, 258, 11 [NASA ADS] [CrossRef] [Google Scholar]
- Weiß, A., Ivison, R. J., Downes, D., et al. 2009, ApJ, 705, L45 [CrossRef] [Google Scholar]
- Witstok, J., Smit, R., Maiolino, R., et al. 2022, MNRAS, 515, 1751 [Google Scholar]
- Xiao, M. Y., Elbaz, D., Gómez-Guijarro, C., et al. 2023, A&A, 672, A18 [NASA ADS] [CrossRef] [EDP Sciences] [Google Scholar]
- Zhou, L., Wang, T., Daddi, E., et al. 2024, A&A, 684, A196 [NASA ADS] [CrossRef] [EDP Sciences] [Google Scholar]
Appendix A: Morphology
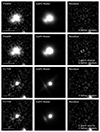 |
Fig. A.1. Morphological fit of XS55 in JWST/F444W (top and middle row) and JWST/F277W (bottom row). The different components of each fit are stated in the right column of each row. |
Effective radii and Sérsic indices from Galfit
Appendix B: FIR fitting
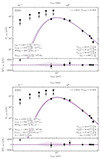 |
Fig. B.1. Mercurius FIR SEDs of XS55. Left: FIR-SED assuming optically thin dust. Right: FIR-SED assuming self-consistent optically thick dust, assuming an upper limit on the emission area of 9.08 kpc2 (half-light radius of diffuse disc-like component in JWST/F444W). |
All Tables
All Figures
|
Fig. 1. Multi-wavelength cut-out images of XS55. The instrument, wavelength, and field of view are shown in green text in each panel. |
| In the text | |
|
Fig. 3. Multi-wavelength images of XS55. Left: COSMOS-XS 3 GHz map (van der Vlugt et al. 2021) overlaid with 2, 3σ 0.5 − 7 keV contours from Chandra, smoothed with a 1″ Gaussian, in purple. Middle: JWST colour image of XS55 representing F115W+F105W, F277W, and F444W as blue, green, and red channels, respectively. Overlaid are ALMA 3 mm continuum emission contours at 5, 8, and 11σ, with the beam size shown as a white ellipse. Right: Moment-1 map of CO(5-4) masked at 3σ in moment-0, overlaid with integrated CO(5-4) at 3, 4, and 5σ levels and JWST/F444W contours at 5, 8, and 11σ levels in yellow and black, respectively. |
| In the text | |
|
Fig. 2. ALMA 3 mm observations of XS55. Top: ALMA 3 mm spectrum of XS55. The red line shows the line-free continuum, and the dotted blue line indicates the flux error per channel at a 1σ level. The spectroscopic redshift is shown in text, along with the velocity width of the channels. Bottom left: Velocity space spectrum of CO(5-4) (blue) and [CI](1-0) (red) at z = 4.8214, the uncertainty per channel is shown as dashed lines. Bottom right: Continuum and continuum-subtracted moment-0 line maps of XS55. Contour levels are 5, 8, and 11σ for the continuum, and 3, 4, and 5σ for the line maps. The beam size is shown as a white ellipse, and the peak JWST/F444W position is marked by a grey cross. |
| In the text | |
|
Fig. 4. NIR to radio SED of XS55, fitted using STARDUST (Kokorev et al. 2021). The total SED (black) is shown with its different components: stellar (blue), dust (red), and radio (magenta). An optically thick MBB (Magdis et al. 2012), fitted with mercurius (Witstok et al. 2022), is shown with a green line. The MBB is not accounted for in the total SED fit. The radio component was extrapolated using the stellar-mass-dependent IR-radio relation from Delvecchio et al. (2021). The NIR PDF(z) of XS55 is shown as an inset with the spec-z marked by a vertical red line. |
| In the text | |
|
Fig. 5. Dust properties of XS55. Left: Dust temperature vs. redshift for XS55 and literature samples. The Td − z relation of main-sequence galaxies from Schreiber et al. (2018) is shown as a black line, with the uncertainty as the shaded grey area. The literature samples are from Riechers et al. (2013, 2014, 2017), Marrone et al. (2018), Pavesi et al. (2018), Faisst et al. (2020), Jin et al. (2019, 2022), Fudamoto et al. (2023), and Algera et al. (2024a,b). The CMB temperature as a function of redshift is shown as a dashed black line. Right: Infrared luminosity surface density as a function of dust temperature, assuming optically thick dust. The surface density limit as defined by the Stefan-Boltzman law of optically thin dust is shown as a black line, while grey-bodies with varying λeff are shown as dashed lines. The literature samples are from Simpson et al. (2017), Hodge et al. (2019), and Jin et al. (2019, 2022). |
| In the text | |
|
Fig. A.1. Morphological fit of XS55 in JWST/F444W (top and middle row) and JWST/F277W (bottom row). The different components of each fit are stated in the right column of each row. |
| In the text | |
|
Fig. B.1. Mercurius FIR SEDs of XS55. Left: FIR-SED assuming optically thin dust. Right: FIR-SED assuming self-consistent optically thick dust, assuming an upper limit on the emission area of 9.08 kpc2 (half-light radius of diffuse disc-like component in JWST/F444W). |
| In the text | |
Current usage metrics show cumulative count of Article Views (full-text article views including HTML views, PDF and ePub downloads, according to the available data) and Abstracts Views on Vision4Press platform.
Data correspond to usage on the plateform after 2015. The current usage metrics is available 48-96 hours after online publication and is updated daily on week days.
Initial download of the metrics may take a while.