Fig. 2.
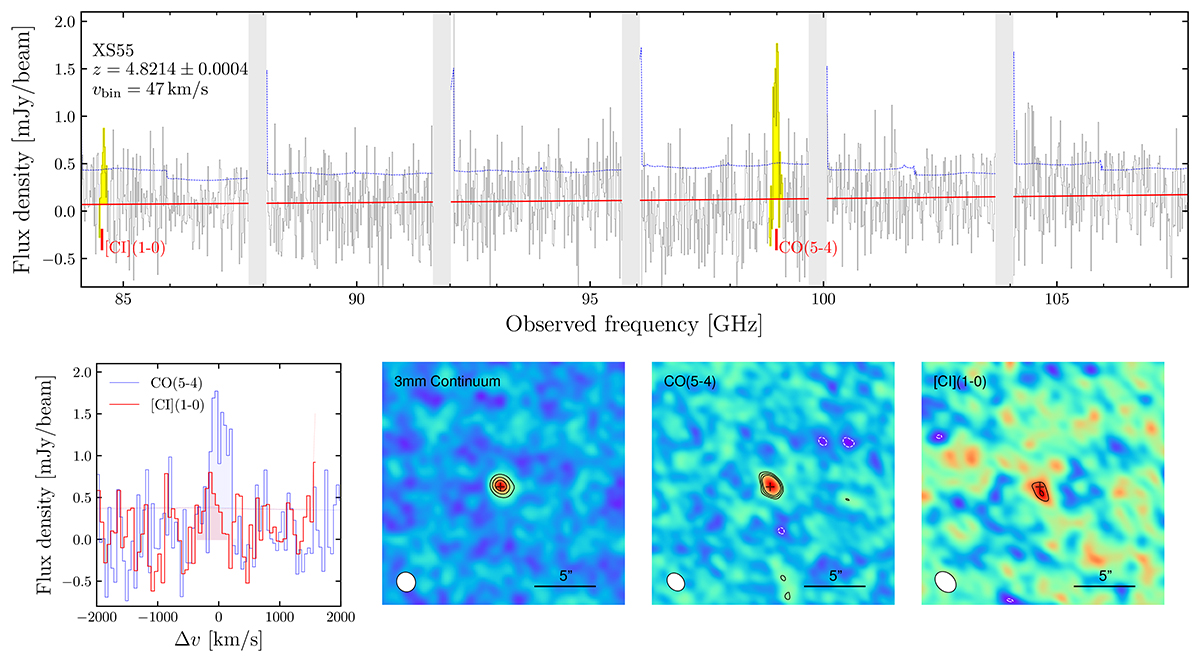
Download original image
ALMA 3 mm observations of XS55. Top: ALMA 3 mm spectrum of XS55. The red line shows the line-free continuum, and the dotted blue line indicates the flux error per channel at a 1σ level. The spectroscopic redshift is shown in text, along with the velocity width of the channels. Bottom left: Velocity space spectrum of CO(5-4) (blue) and [CI](1-0) (red) at z = 4.8214, the uncertainty per channel is shown as dashed lines. Bottom right: Continuum and continuum-subtracted moment-0 line maps of XS55. Contour levels are 5, 8, and 11σ for the continuum, and 3, 4, and 5σ for the line maps. The beam size is shown as a white ellipse, and the peak JWST/F444W position is marked by a grey cross.
Current usage metrics show cumulative count of Article Views (full-text article views including HTML views, PDF and ePub downloads, according to the available data) and Abstracts Views on Vision4Press platform.
Data correspond to usage on the plateform after 2015. The current usage metrics is available 48-96 hours after online publication and is updated daily on week days.
Initial download of the metrics may take a while.