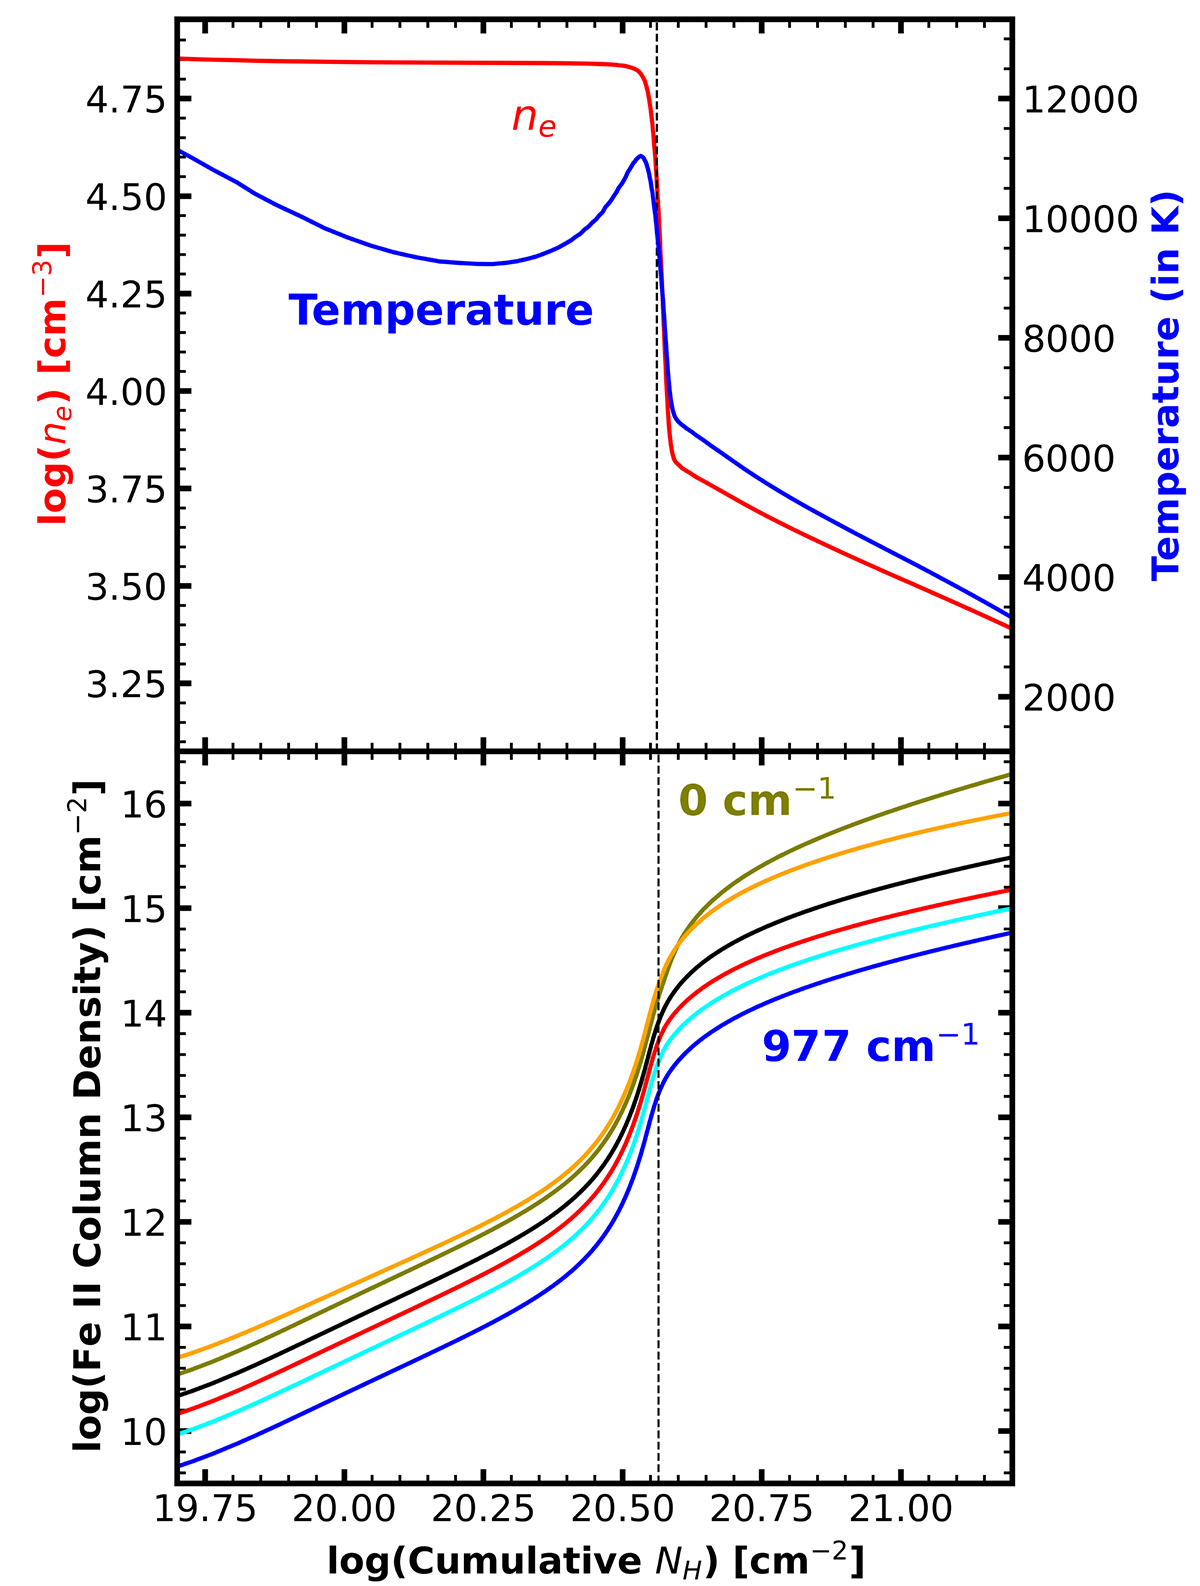
Fig. 8.
Download original image
Physical structure of the photoionized cloud vs. the total hydrogen column density for log(nH) = 4.8 [cm−3]. The top panels show the variation in the electron density and temperature within the cloud. The bottoms panels show the cumulative column density of each Fe II level detected in the spectra. The dashed vertical black line marks the H I ionization front.
Current usage metrics show cumulative count of Article Views (full-text article views including HTML views, PDF and ePub downloads, according to the available data) and Abstracts Views on Vision4Press platform.
Data correspond to usage on the plateform after 2015. The current usage metrics is available 48-96 hours after online publication and is updated daily on week days.
Initial download of the metrics may take a while.