Fig. 6.
Download original image
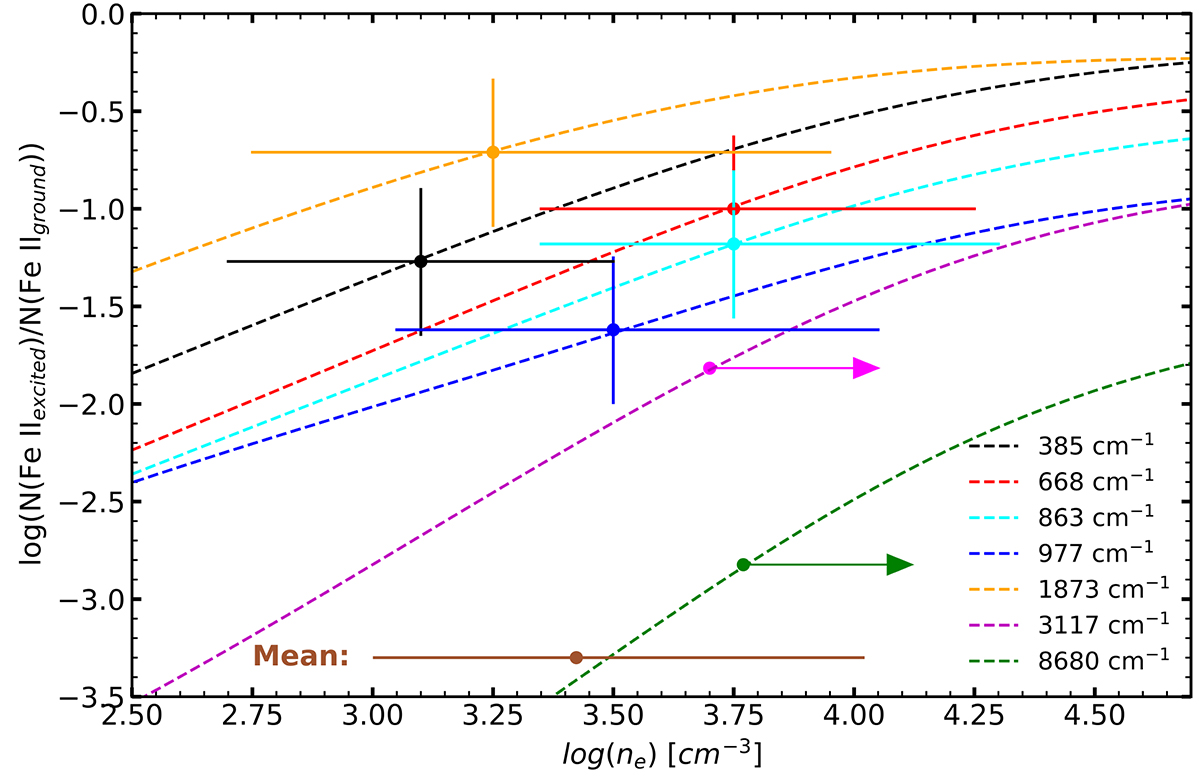
Theoretical population ratios for different Fe II* transitions for Te = 5000 K (determined from our CLOUDY modeling; dashed curves). The solid crosses represent the observed column density ratios and their corresponding error (which includes the error determined in Sect. 3.3). The arrows represent the lower limits obtained from possibly saturated troughs corresponding to these energy levels. The mean ne along with its errors obtained from all the levels is shown in brown.
Current usage metrics show cumulative count of Article Views (full-text article views including HTML views, PDF and ePub downloads, according to the available data) and Abstracts Views on Vision4Press platform.
Data correspond to usage on the plateform after 2015. The current usage metrics is available 48-96 hours after online publication and is updated daily on week days.
Initial download of the metrics may take a while.