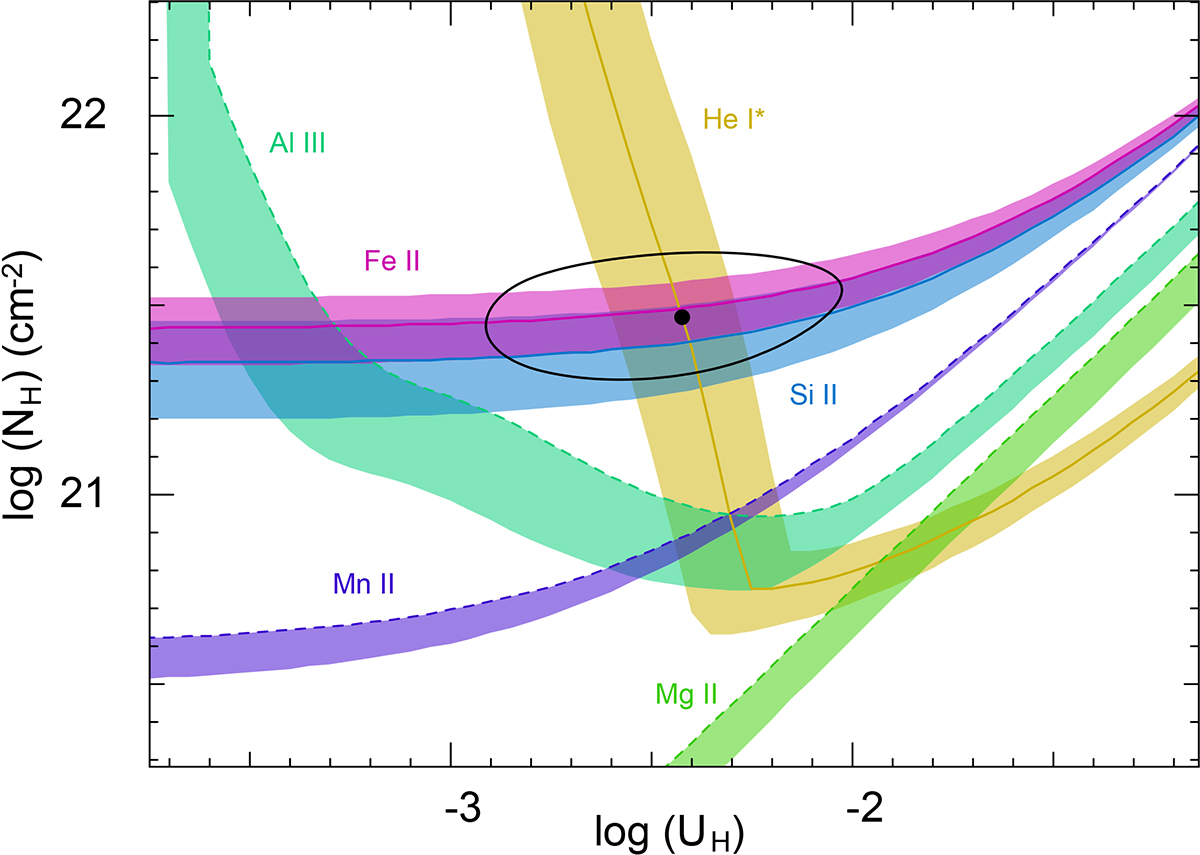
Fig. 5.
Download original image
log NH vs. log UH phase-space plot, with constraints based on the measured total ionic column densities (sum of the column densities of the ground state and all the observed excited states). The measurements are shown as solid curves, and the dashed curves show lower limits. The shaded regions denote the errors associated with each Nion. The phase-space solution with minimized χ2 is shown as a black dot surrounded by a black ellipse indicating the 1σ error.
Current usage metrics show cumulative count of Article Views (full-text article views including HTML views, PDF and ePub downloads, according to the available data) and Abstracts Views on Vision4Press platform.
Data correspond to usage on the plateform after 2015. The current usage metrics is available 48-96 hours after online publication and is updated daily on week days.
Initial download of the metrics may take a while.