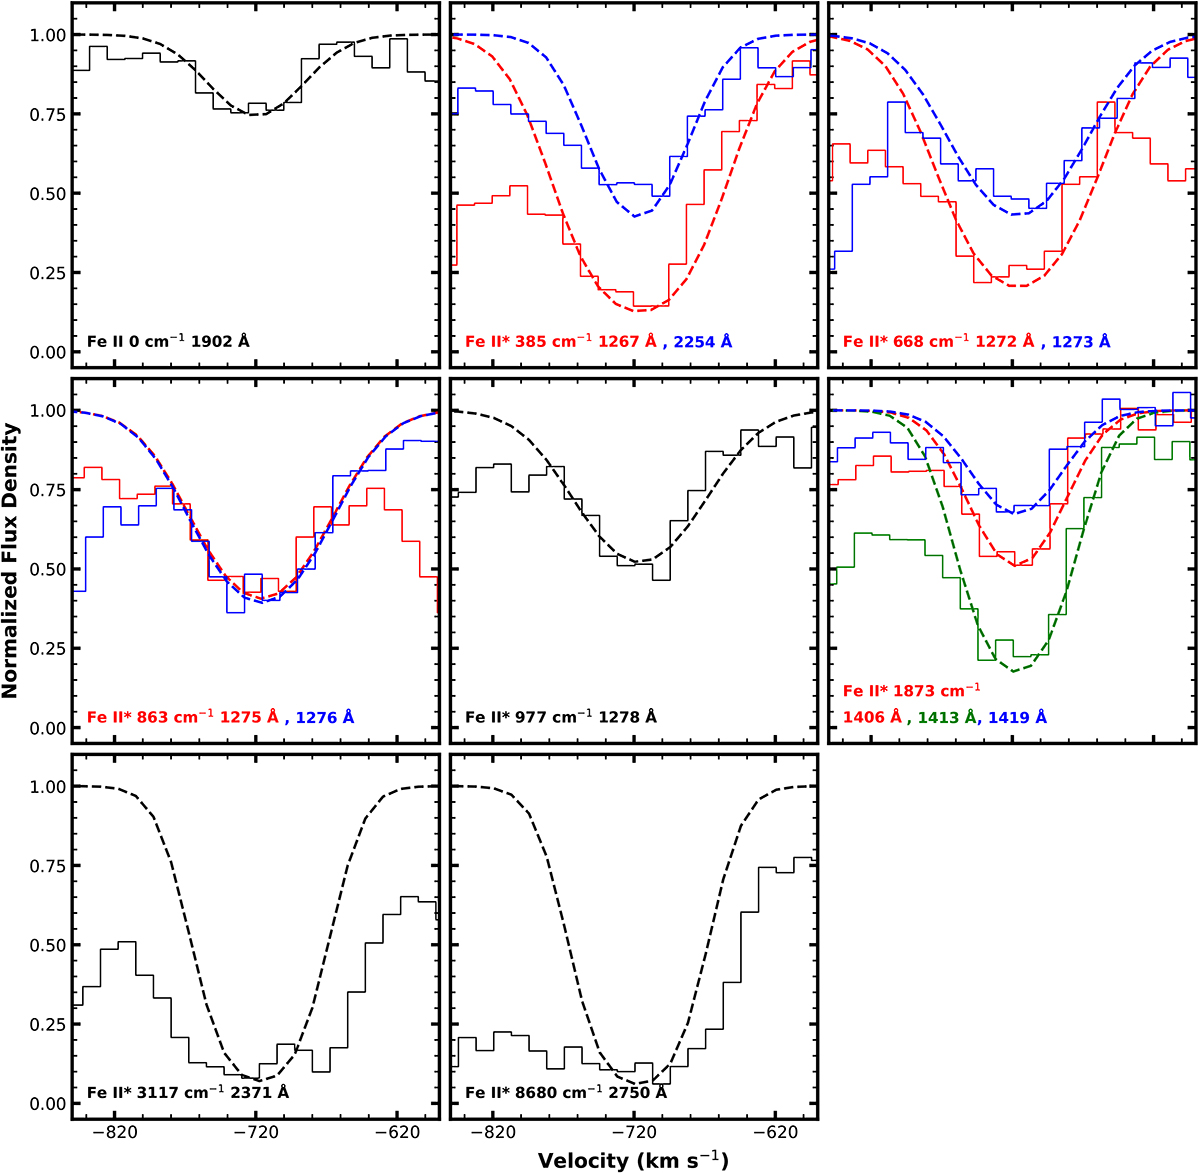
Fig. 4.
Download original image
Identified Fe II troughs for outflow system S2. The histograms show the VLT/UVES spectra in velocity space, and the corresponding dashed curves show the modeled Gaussian for the absorption. The model is based on the 1278 Å transition, and its template with fixed centroid and width was scaled to match the depth of all other troughs. The lower-energy level of the transition and the wavelengths are given for each panel.
Current usage metrics show cumulative count of Article Views (full-text article views including HTML views, PDF and ePub downloads, according to the available data) and Abstracts Views on Vision4Press platform.
Data correspond to usage on the plateform after 2015. The current usage metrics is available 48-96 hours after online publication and is updated daily on week days.
Initial download of the metrics may take a while.