Fig. 3.
Download original image
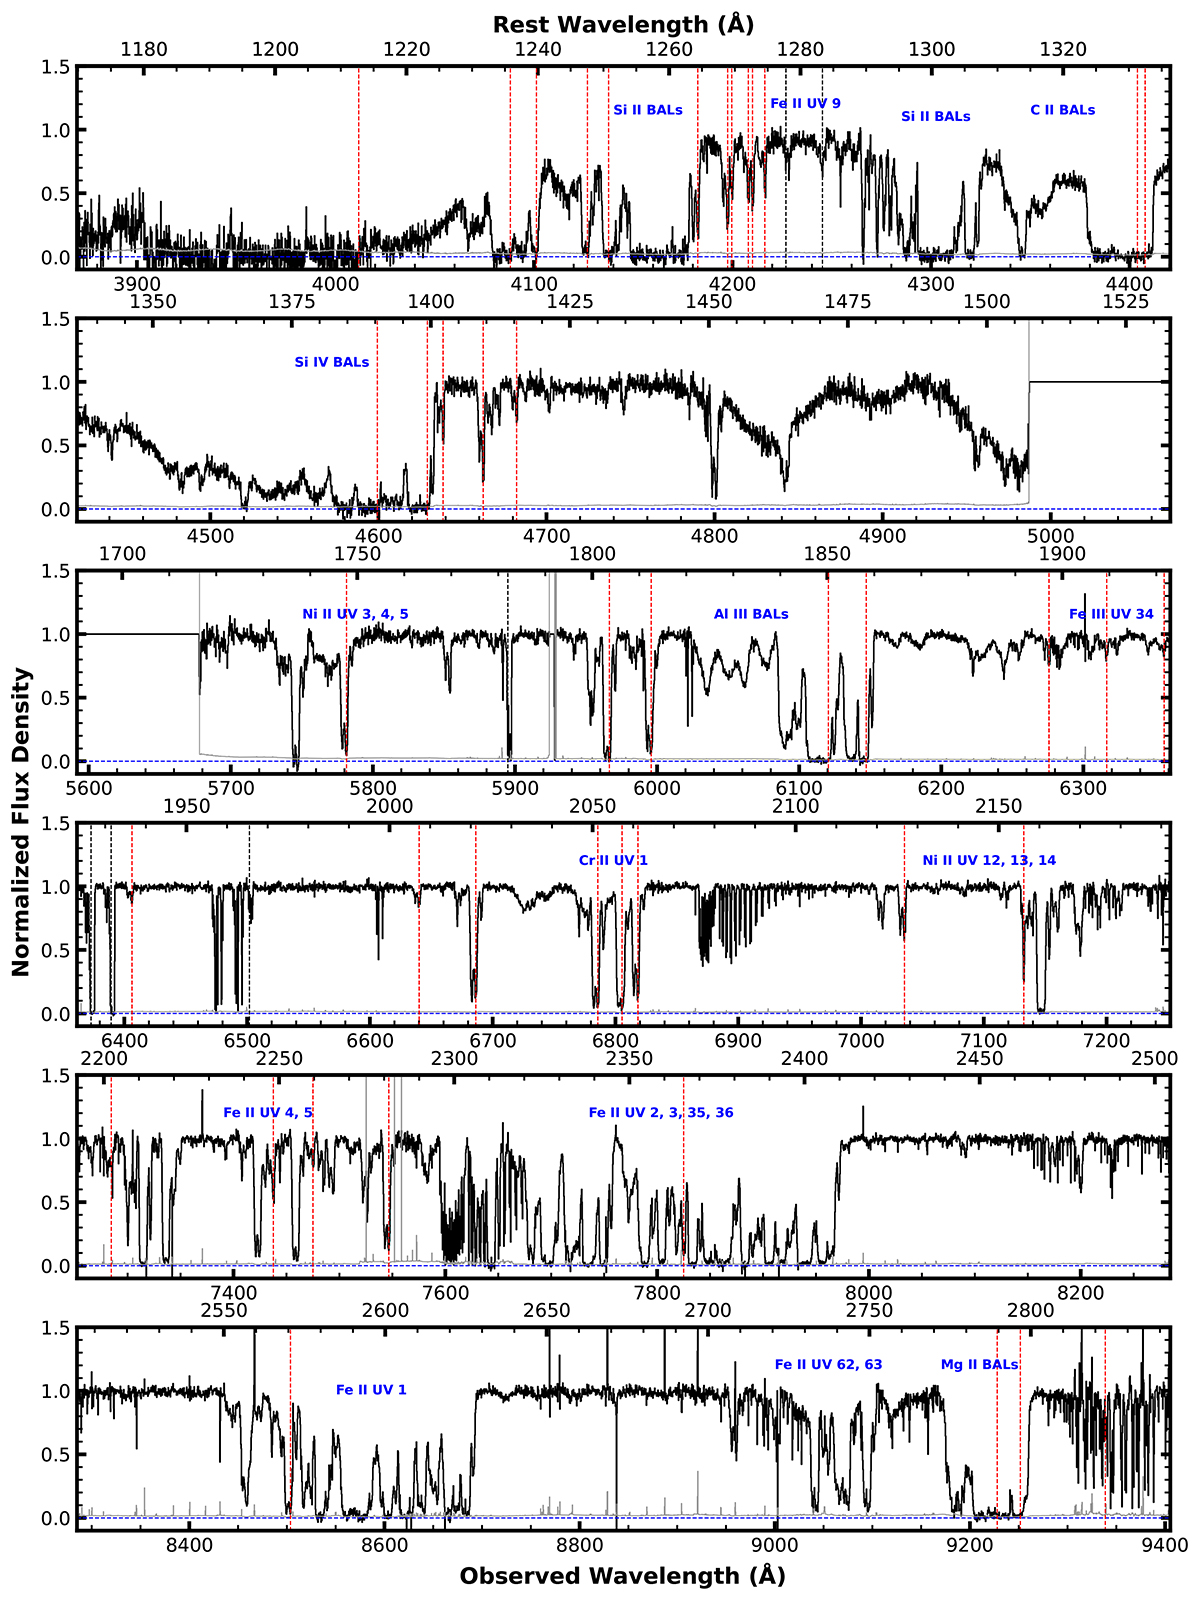
Normalized UVES spectrum of J0932-0840. Important features and multiplets are marked in blue, and the identified absorption troughs from the primary outflow system at v ≈ −720 km s−1 are marked with dashed red lines. The zero flux level is shown by the dashed blue lines. The dashed black lines mark troughs from an intervening system at z = 1.28.
Current usage metrics show cumulative count of Article Views (full-text article views including HTML views, PDF and ePub downloads, according to the available data) and Abstracts Views on Vision4Press platform.
Data correspond to usage on the plateform after 2015. The current usage metrics is available 48-96 hours after online publication and is updated daily on week days.
Initial download of the metrics may take a while.