Fig. 2.
Download original image
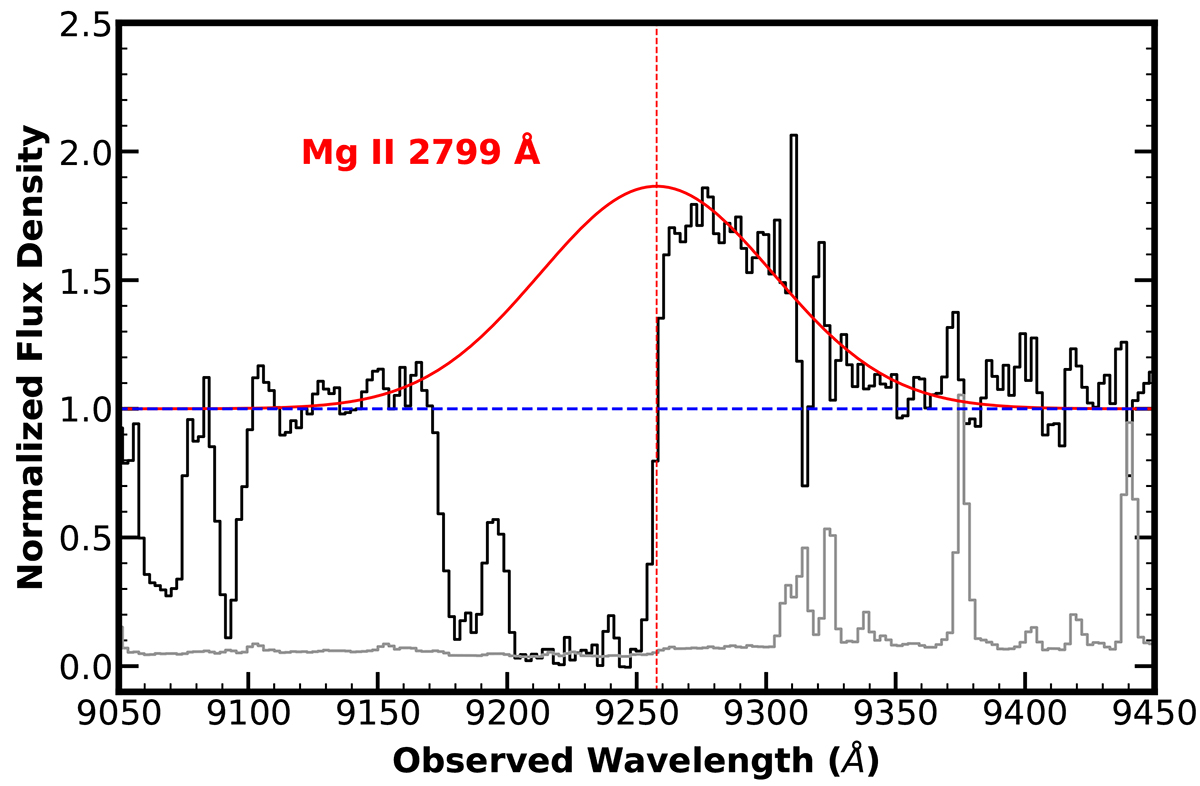
Gaussian model fit for the Mg II 2799 emission feature (shown in red). Due to high absorption, the data points for the fit were selected manually. The dashed red line marks the centroid of the best-fit model we used to determine the redshift of the quasar. The dashed blue line shows the continuum level. The error on the flux is shown in gray.
Current usage metrics show cumulative count of Article Views (full-text article views including HTML views, PDF and ePub downloads, according to the available data) and Abstracts Views on Vision4Press platform.
Data correspond to usage on the plateform after 2015. The current usage metrics is available 48-96 hours after online publication and is updated daily on week days.
Initial download of the metrics may take a while.