| Issue |
A&A
Volume 693, January 2025
|
|
|---|---|---|
| Article Number | L2 | |
| Number of page(s) | 6 | |
| Section | Letters to the Editor | |
| DOI | https://doi.org/10.1051/0004-6361/202452422 | |
| Published online | 23 December 2024 | |
Letter to the Editor
Deep silence: Radio properties of little red dots
1
Konkoly Observatory, HUN-REN Research Centre for Astronomy and Earth Sciences, Konkoly-Thege Miklós út 15-17, 1121 Budapest, Hungary
2
CSFK, MTA Centre of Excellence, Konkoly-Thege Miklós út 15-17, 1121 Budapest, Hungary
3
Institute of Physics and Astronomy, ELTE Eötvös Loránd University, Pázmány Péter sétány 1/A, 1117 Budapest, Hungary
4
Department of Astronomy, Institute of Physics and Astronomy, ELTE Eötvös Loránd University, Pázmány Péter sétány 1/A, 1117 Budapest, Hungary
5
HUN-REN–ELTE Extragalactic Astrophysics Research Group, ELTE Eötvös Loránd University, Pázmány Péter sétány 1/A, 1117 Budapest, Hungary
⋆ Corresponding author; This email address is being protected from spambots. You need JavaScript enabled to view it.
Received:
30
September
2024
Accepted:
28
November
2024
Abstract
To investigate the radio properties of the recently found high-redshift population, we collected a sample of 919 little red dots (LRDs) from the literature. By cross-matching their co-ordinates with the radio catalogues based on the first- and second-epoch observations of the Very Large Array Sky Survey (VLASS) and the Faint Images of the Radio Sky at Twenty-centimeters (FIRST) survey, we found no radio counterparts coinciding with any of the LRDs. To uncover possible sub-milli-Jansky-level weak radio emission, we performed mean and median image stacking analyses of empty-field ‘quick look’ VLASS and FIRST image cutouts centred on the LRD positions. We found no radio emission above 3σ noise levels (∼11 and ∼18 μJy beam−1 for the VLASS and FIRST maps, respectively) in either of the stacked images for the LRD sample, while the noise levels of the single-epoch images are comparable to those found earlier in the stacking of high-redshift radio-quiet active galactic nuclei (AGNs). The non-detection of radio emission in LRDs suggests that these sources host weaker (or no) radio AGNs.
Key words: methods: data analysis / galaxies: active / galaxies: high-redshift / galaxies: star formation
© The Authors 2024
 Open Access article, published by EDP Sciences, under the terms of the Creative Commons Attribution License (https://creativecommons.org/licenses/by/4.0), which permits unrestricted use, distribution, and reproduction in any medium, provided the original work is properly cited.
This article is published in open access under the Subscribe to Open model. This email address is being protected from spambots. You need JavaScript enabled to view it. to support open access publication.
1. Introduction
One of the surprising results of recent James Webb Space Telescope (JWST) observations is the discovery of a new population of high-redshift (z ≥ 4) sources, referred to as little red dots (LRDs, e.g. Furtak et al. 2023; Harikane et al. 2023; Labbé et al. 2023a,b; Barro et al. 2024; Greene et al. 2024; Kocevski et al. 2024; Matthee et al. 2024). The common characteristics of LRDs are their compactness and very red continua at rest-frame optical wavelengths, while also exhibiting a blue ultraviolet (UV) excess. Some LRDs also have broad Hα emission lines identified in their spectra, indicating that they harbour type-I active galactic nuclei (AGNs, e.g. Harikane et al. 2023; Greene et al. 2024; Matthee et al. 2024).
Regarding their nature, there are several theories that try to explain their observed properties with varying success. The red continuum of LRDs could arise from compact, dusty star formation or even from older stellar populations, with the stellar UV emission escaping unattenuated from the host galaxy due to uneven dust distribution (e.g. Baggen et al. 2024; Pérez-González et al. 2024; Williams et al. 2024). Alternatively, the hot dust emission and the rest-frame optical slope can be explained by a heavily reddened broad-line AGN, with the UV emission originating from either the scattering of the unabsorbed AGN continuum or from their host galaxies (e.g. Durodola et al. 2024; Greene et al. 2024; Kocevski et al. 2024). However, the truth probably lies between these two scenarios, as the physical mechanisms that can trigger AGNs can also trigger starburst events; thus, it is somewhat expected to see both the central supermassive black hole and the surrounding galaxy grow alongside each other (Akins et al. 2024).
Understanding the nature of LRDs is further complicated by the different selection techniques used to identify these sources (Pérez-González et al. 2024), and also by the possible diversity of the newly discovered distant and red galaxies. As Kokubo & Harikane (2024) point out, LRDs are not necessarily Hα emitters and vice versa, implying that the LRDs with and without Hα emission could represent different galaxy populations.
A puzzling aspect of LRDs is the lack of X-ray emission, even for sources selected to show broad Hα emission lines (Maiolino et al. 2024a; Yue et al. 2024). To date, only two LRDs have X-ray counterparts, and even the stacking of the Chandra fields of X-ray-undetected LRDs did not detect X-ray emission of LRDs (Ananna et al. 2024; Kocevski et al. 2024; Yue et al. 2024). The lack of X-ray detection could be explained by the intrinsic X-ray weakness of LRDs or heavy X-ray absorption by large column density clouds (Maiolino et al. 2024a). In addition, LRDs selected from the COSMOS-Web survey (Casey et al. 2023) do not have detections at mid- and far-infrared and submillimetre or millimetre wavelengths either, even after stacking (Akins et al. 2024). If at least a fraction of LRDs hosted AGNs, this would be expected to be reflected in their multi-wavelength properties. Observations in the radio regime are of special value because the propagation of radio waves is not affected by dust and gas obscuration.
To further investigate the nature of LRDs in the scope of AGN activity, we collected an extended list of LRDs from the literature, to explore their radio properties in large radio sky surveys by means of image stacking. In Sect. 2, we introduce our sample and the cross-match it with radio catalogues. In Sect. 3, we describe the radio image stacking analysis and present its results. Finally, we summarise our findings and conclude the paper in Sect. 4.
2. Sample selection and radio cross-match
A total of 919 LRDs were collected from the literature at declinations of δ > −40° (Übler et al. 2023; Kokorev et al. 2023, 2024; Harikane et al. 2023; Labbé et al. 2023a,b; Barro et al. 2024; Matthee et al. 2024; Greene et al. 2024; Pérez-González et al. 2024; Williams et al. 2024; Wang et al. 2024; Kocevski et al. 2024; Akins et al. 2024; Furtak et al. 2024; Killi et al. 2024; Maiolino et al. 2024b). The relationship between the spectroscopic and the photometric redshifts is shown in Fig. 1 for the 51 LRDs for which both values were available in the literature. Although the similarities are already noticeable visually, with most of the objects following the equality line with the slope of unity, statistical parameters of the population also imply the goodness of the photometric redshift estimates. The majority of the LRDs in the sample (867 objects) presented here have photometric redshift information available, with values spanning the range 2.4 ≤ zphot ≤ 11.4 (Kocevski et al. 2024). The mean and median values of the photometric redshifts are  and
and  , respectively. Spectroscopic redshifts are available for 103 individual LRDs, ranging between 3.1 ≤ zspec ≤ 9.1 (Kocevski et al. 2024; Labbé et al. 2023b), with slightly lower mean and median values for this subset:
  and
and  , respectively. The standard deviations of the redshifts in the subsamples are similar, with 1.7 and 1.4 for the photometric and spectroscopic values, respectively. The good photometric redshift estimates were also used to identify and discard brown dwarfs from the samples (e.g. Burgasser et al. 2024; Greene et al. 2024). The distributions of spectroscopic and photometric redshift values are illustrated in Fig. 2.
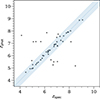 |
Fig. 1. Relation of the spectroscopic and photometric redshift for the 51 LRDs with both values available. The shaded blue area denotes parity with a ±3σ standard deviation. |
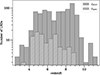 |
Fig. 2. Distribution of LRDs as a function of redshift. Photometric and spectroscopic values are denoted with dark grey and (hatched) light grey bars. |
We cross-matched the positions of LRDs with the latest versions of the ‘quick look’ catalogues based on the first-epoch (version 3) and second-epoch (version 2) observations of the Very Large Array Sky Survey (VLASS, Gordon et al. 2020, 2021). We used two search radii of  and 5′′, both to look for immediate compact counterparts and to identify more extended emission in the fields of the LRDs.
Additionally, the list of LRD positions was cross-matched with the 1.4-GHz Faint Images of the Radio Sky at Twenty-centimeters (FIRST, White et al. 1997; Helfand et al. 2015) survey database as well, applying the same search radii. Although the sky coverage, the detection limit (∼1 mJy), and the angular resolution (5′′) of FIRST are poorer than those of VLASS, the lower observing frequency could be useful to identify radio counterparts for objects at high redshifts. Despite the poorer angular resolution of FIRST, the search radius was not increased. As was discussed by Ivezić et al. (2002), separations above  significantly increase the number of random associations not corresponding to the optical counterpart.
Two radio sources were found within 5′′ distance of the LRDs in the sample in the FIRST catalogue. We investigated these radio sources individually, and concluded that neither of them are associated with the LRDs in the vicinity (see Appendix A), and thus all cutouts for the 919 LRDs were included in the stacking analysis.
3. Image stacking of little red dots
We defined empty-field images as cutouts where the signal-to-noise ratio in the 15′′ × 15′′ area surrounding the position of the LRD was SNR ≲ 6. VLASS observed the radio sky in the 2 − 4 GHz frequency range at declinations of δ ≥ −40°. The observations were carried out at three different epochs between 2017 and 2024, with the second run of epoch 3 observations to be completed by the end of 2024. The quick look radio maps for epochs 1.1 − 3.1 are publicly available1 with an angular resolution of  , and depending on the local root-mean-square (rms) noise levels, the detection threshold (5σ rms) can be as low as ∼300 μJy. We note that at the time of the analyses only the radio maps, but not an official component catalogue, were available from the third-epoch observational data. Using the ASTROQUERY package described in Ginsburg et al. (2019), we searched the VLASS image database maintained by the Canadian Astronomy Data Centre2 (CADC). For the three different epochs, respectively, we found 1015, 1015, and 959 empty-field quick look radio maps centred on 919, 919, and 872 individual LRD positions. Considering the small sample size of LRDs and that the separate images are located on different VLASS tiles, and thus they were observed independently at different times, all available maps were included in the stacking. A total of 770 maps were acquired from the FIRST survey3.
Ideally, one should perform the stacking analysis in redshift bins, in order to avoid redshift-dependent biases. Likewise, one should differentiate the sample by source properties, to minimise selection effects and better characterise the underlying populations. We performed a stacking in redshift bins, but we did not attempt to divide LRDs into sub-classes, given the scarcity of observational constraints currently available for these sources. We divided our sample into four redshift bins and performed pixel-by-pixel image stacking analyses on the radio maps using both mean and median methods (see e.g. Perger et al. 2019; Gabányi et al. 2021; Perger et al. 2024). The redshift-binned images reached 1σ sensitivities of ∼5 − 14 μ Jy beam−1; however, no radio emission was detected (see Appendix B). We hence decided to repeat the stacking over the full sample, to improve sensitivity.
The results of the stacking procedure are illustrated in the panels of Fig. 3, with the image properties listed in Table 1. We found no underlying radio emission down to ∼10 μJy beam−1-level intensities (3σ rms) in either of the stacked images. Upper limits on the radio emission of LRDs were estimated assuming a compact, unresolved structure at arcsec scales. We considered 3σ rms noise levels to determine the flux density values. The mean and median stacking procedures on the full sample of 2989 VLASS maps give upper limits on the 3-GHz flux density as  Jy and
  Jy, respectively. The mean and median stacked images of the 1.4-GHz FIRST provide upper limits of
  Jy and
  Jy. The upper limits on the characteristic monochromatic powers calculated from the median flux density constraints of the stacked VLASS maps give
  W Hz−1, considering the median of all redshift values of the sample,
  . Similarly, the FIRST image upper limits are translated into an upper limit on the characteristic power as
  W Hz−1.
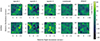 |
Fig. 3. Mean and median stacked empty-field VLASS and FIRST images of the LRDs in the sample. Image properties are listed in Table 1. |
We compared our results with those obtained from the stacking of a sample of 3068 spectroscopically identifed high-redshift (4 < z < 10) radio-undetected AGNs (Perger et al. 2024). The stacking of the control sample of AGNs results in similar rms noise levels as for the LRDs in this work, but reveals ∼30 μJy flux densities even in single-epoch datasets, with characteristic monochromatic powers in the range (2 × 1024 − 1025) W Hz−1, with a value of  W Hz−1 at redshift z = 7.1. Additionally, it is striking that none of the nearly 1000 individual LRDs found to date have radio detection. On the contrary, according to our current knowledge, roughly 10 − 15% of AGNs show radio emission (e.g. Ivezić et al. 2002; Kellermann et al. 2016; Flesch 2023), and in the high-redshift Universe (z ≥ 4) this value was found to be ∼8% (see the latest version4 of the Perger et al. 2017 catalogue). This fact and the fact that the upper limit on the monochromatic powers of LRDs is lower than the one found for the comparison high-redshift radio-quiet AGN sample suggest that LRDs host weaker (or no) radio AGNs, and/or are a composite population where AGNs are sub-dominant.
Assuming that LRDs are dominated by star formation, the upper limits determined for the radio emission can be translated to star formation rate (SFR) upper limits. Considering that LRDs are indeed high-redshift sources, we applied the redshift-dependent radio power–SFR correlation of Novak et al. (2017), resulting in SFR < 350 M⊙ yr−1 and SFR < 650 M⊙ yr−1 at the median redshift of the sample (z = 7.1), depending on the assumed initial mass function; that is, Chabrier (2003) and Salpeter (1955), respectively. We note that applying non-evolving radio power–SFR relations (e.g. Davies et al. 2017; Mahajan et al. 2019) would result in values of the same order of magnitude. As galaxies with SFRs in the order of magnitudes of ∼100 to ∼1000 M⊙ yr−1 are not unprecedented, even in the early Universe (e.g. Venemans et al. 2017; Shao et al. 2019; Kaasinen et al. 2024), enhanced star formation as an explanation of the LRD phenomenon cannot be excluded.
4. Summary and conclusions
As to date the underlying physical processes behind the LRD phenomenon are still unknown, we approached the question from a radio viewpoint by collecting data from radio sky surveys at 1.4 and 3 GHz, and comparing our results with properties of a large sample of high-redshift AGNs. After compiling a list of 919 LRDs from the literature, we searched for their possible counterparts in the 1.4-GHz FIRST and 3-GHz VLASS radio catalogue and found no associated radio emission, in contrast to the expectations based on the ∼8% radio-detected fraction of high-redshift AGNs.
A total of 770 and 2989 empty-field radio maps centred on the LRD co-ordinates were acquired from FIRST and VLASS, respectively. Using these image cutouts, we conducted stacking analyses. Considering an unresolved point source as the origin of the non-detected radio emission, 3σ flux density upper limits can be estimated for LRDs, and were found to be of the order of ∼10 μJy. As stacking of high-redshift (4 ≤ z ≲ 10) radio-quiet AGNs with a similar sample size and image noise levels reveals ∼30 μJy level flux densities (Perger et al. 2019, 2024), LRDs could represent a population of particularly radio-quiet AGNs. Alternatively, LRDs may be a composite population where AGNs are sub-dominant.
Using the radio non-detection as an upper limit on the flux densities, we estimated the corresponding SFRs following the radio power-to-SFR relation from Novak et al. (2017), and found threshold values of SFR < 350 M⊙ yr−1 and SFR < 650 M⊙ yr−1. As SFRs in the order of magnitude of hundreds M⊙ yr−1 are oftentimes found in high-redshift galaxies and AGN hosts, LRDs as embodiments of high-redshift galaxies with enhanced star formation are indeed possible.
The study presented here is the first attempt to characterise the general radio properties of LRDs as a new class of objects at high redshifts. The stacked empty-field radio images suggest significantly weaker radio emission in general, in comparison with a similar high-redshift radio-quiet AGN sample. However, the number of objects that can be stacked at present is only sufficient for deriving an upper limit of the characteristic radio emission. Similar studies in the future, based on much larger LRD samples, would be able to place tighter constraints and perhaps even detect weak stacked radio emission. Radio image stacking of substantially increased LRD samples may also allow us to determine the radio properties of this enigmatic class of objects, as a function of redshift and other important physical parameters.
Data availability
The list of the selected sources is provided as supplementary material, and is available at the CDS via anonymous ftp to cdsarc.cds.unistra.fr (130.79.128.5) or via https://cdsarc.cds.unistra.fr/viz-bin/cat/J/A+A/693/L2, or can be obtained on request by contacting the corresponding author as a machine-readable file in comma-separated values (CSV) format.
Detailed information on the VLASS observing epochs can be found at https://science.nrao.edu/vlass.
The catalogue is available at https://staff.konkoly.hu/perger.krisztina/catalog.html or https://vizier.cds.unistra.fr/viz-bin/VizieR?-source=J/other/FrASS/4.9.
Acknowledgments
We thank the referee, Dr. Isabella Prandoni for her constructive suggestions to improve our manuscript. The National Radio Astronomy Observatory is a facility of the National Science Foundation operated under cooperative agreement by Associated Universities, Inc. CIRADA is funded by a grant from the Canada Foundation for Innovation 2017 Innovation Fund (Project 35999), as well as by the Provinces of Ontario, British Columbia, Alberta, Manitoba and Quebec. We thank the Hungarian National Research, Development and Innovation Office (NKFIH, grants OTKA K134213 and PD146947) for support. This work was also supported by HUN-REN and the NKFIH excellence grant TKP2021-NKTA-64.
References
- Akins, H. B., Casey, C. M., Lambrides, E., et al. 2024, ApJ, submitted [arXiv:2406.10341] [Google Scholar]
- Ananna, T. T., Bogdán, Á., Kovács, O. E., Natarajan, P., & Hickox, R. C. 2024, ApJ, 969, L18 [NASA ADS] [CrossRef] [Google Scholar]
- Baggen, J. F. W., van Dokkum, P., Brammer, G., et al. 2024, ApJ, submitted [arXiv:2408.07745] [Google Scholar]
- Barro, G., Pérez-González, P. G., Kocevski, D. D., et al. 2024, ApJ, 963, 128 [CrossRef] [Google Scholar]
- Burgasser, A. J., Bezanson, R., Labbé, I., et al. 2024, ApJ, 962, 177 [NASA ADS] [CrossRef] [Google Scholar]
- Casey, C. M., Kartaltepe, J. S., Drakos, N. E., et al. 2023, ApJ, 954, 31 [NASA ADS] [CrossRef] [Google Scholar]
- Chabrier, G. 2003, PASP, 115, 763 [Google Scholar]
- Davies, L. J. M., Huynh, M. T., Hopkins, A. M., et al. 2017, MNRAS, 466, 2312 [Google Scholar]
- Durodola, E., Pacucci, F., & Hickox, R. C. 2024, ApJ, submitted [arXiv:2406.10329] [Google Scholar]
- Flesch, E. W. 2023, Open J. Astrophys., 6, 49 [NASA ADS] [CrossRef] [Google Scholar]
- Furtak, L. J., Zitrin, A., Plat, A., et al. 2023, ApJ, 952, 142 [NASA ADS] [CrossRef] [Google Scholar]
- Furtak, L. J., Labbé, I., Zitrin, A., et al. 2024, Nature, 628, 57 [NASA ADS] [CrossRef] [Google Scholar]
- Gabányi, K. É., Frey, S., & Perger, K. 2021, MNRAS, 506, 3641 [CrossRef] [Google Scholar]
- Ginsburg, A., Sipőcz, B. M., Brasseur, C. E., et al. 2019, AJ, 157, 98 [Google Scholar]
- Giodini, S., Smolčić, V., Finoguenov, A., et al. 2010, ApJ, 714, 218 [NASA ADS] [CrossRef] [Google Scholar]
- Gordon, Y. A., Boyce, M. M., O’Dea, C. P., et al. 2020, Res. Am. Astron. Soc., 4, 175 [Google Scholar]
- Gordon, Y. A., Boyce, M. M., O’Dea, C. P., et al. 2021, ApJS, 255, 30 [NASA ADS] [CrossRef] [Google Scholar]
- Greene, J. E., Labbé, I., Goulding, A. D., et al. 2024, ApJ, 964, 39 [CrossRef] [Google Scholar]
- Harikane, Y., Zhang, Y., Nakajima, K., et al. 2023, ApJ, 959, 39 [NASA ADS] [CrossRef] [Google Scholar]
- Helfand, D. J., White, R. L., & Becker, R. H. 2015, ApJ, 801, 26 [NASA ADS] [CrossRef] [Google Scholar]
- Heywood, I., Jarvis, M. J., Hale, C. L., et al. 2022, MNRAS, 509, 2150 [Google Scholar]
- Ivezić, Ž., Menou, K., Knapp, G. R., et al. 2002, AJ, 124, 2364 [CrossRef] [Google Scholar]
- Kaasinen, M., Venemans, B., Harrington, K. C., et al. 2024, A&A, 684, A33 [NASA ADS] [CrossRef] [EDP Sciences] [Google Scholar]
- Kellermann, K. I., Condon, J. J., Kimball, A. E., Perley, R. A., & Ivezić, Ž. 2016, ApJ, 831, 168 [Google Scholar]
- Killi, M., Watson, D., Brammer, G., et al. 2024, A&A, 691, A52 [NASA ADS] [CrossRef] [EDP Sciences] [Google Scholar]
- Kocevski, D. D., Finkelstein, S. L., Barro, G., et al. 2024, ApJ, submitted [arXiv:2404.03576] [Google Scholar]
- Kokorev, V., Fujimoto, S., Labbé, I., et al. 2023, ApJ, 957, L7 [NASA ADS] [CrossRef] [Google Scholar]
- Kokorev, V., Caputi, K. I., Greene, J. E., et al. 2024, ApJ, 968, 38 [NASA ADS] [CrossRef] [Google Scholar]
- Kokubo, M., & Harikane, Y. 2024, ApJ, submitted [arXiv:2407.04777] [Google Scholar]
- Labbé, I., Greene, J. E., Bezanson, R., et al. 2023a, ApJ, submitted [arXiv:2306.07320] [Google Scholar]
- Labbé, I., van Dokkum, P., Nelson, E., et al. 2023b, Nature, 616, 266 [CrossRef] [Google Scholar]
- Mahajan, S., Ashby, M. L. N., Willner, S. P., et al. 2019, MNRAS, 482, 560 [NASA ADS] [CrossRef] [Google Scholar]
- Maiolino, R., Risaliti, G., Signorini, M., et al. 2024a, MNRAS, submitted [arXiv:2405.00504] [Google Scholar]
- Maiolino, R., Scholtz, J., Curtis-Lake, E., et al. 2024b, A&A, 691, A145 [NASA ADS] [CrossRef] [EDP Sciences] [Google Scholar]
- Matthee, J., Naidu, R. P., Brammer, G., et al. 2024, ApJ, 963, 129 [NASA ADS] [CrossRef] [Google Scholar]
- Novak, M., Smolčić, V., Delhaize, J., et al. 2017, A&A, 602, A5 [NASA ADS] [CrossRef] [EDP Sciences] [Google Scholar]
- Oklopčić, A., Smolčić, V., Giodini, S., et al. 2010, ApJ, 713, 484 [NASA ADS] [CrossRef] [Google Scholar]
- Pérez-González, P. G., Barro, G., Rieke, G. H., et al. 2024, ApJ, 968, 4 [CrossRef] [Google Scholar]
- Perger, K., Frey, S., Gabányi, K. É., & Tóth, L. V. 2017, Front. Astron. Space Sci., 4, 9 [NASA ADS] [CrossRef] [Google Scholar]
- Perger, K., Frey, S., Gabányi, K. É., & Tóth, L. V. 2019, MNRAS, 490, 2542 [NASA ADS] [CrossRef] [Google Scholar]
- Perger, K., Frey, S., & Gabányi, K. É. 2024, MNRAS, 527, 3436 [Google Scholar]
- Salpeter, E. E. 1955, ApJ, 121, 161 [Google Scholar]
- Shao, Y., Wang, R., Carilli, C. L., et al. 2019, ApJ, 876, 99 [NASA ADS] [CrossRef] [Google Scholar]
- Tu, H., Gavazzi, R., Limousin, M., et al. 2009, A&A, 501, 475 [NASA ADS] [CrossRef] [EDP Sciences] [Google Scholar]
- Übler, H., Maiolino, R., Curtis-Lake, E., et al. 2023, A&A, 677, A145 [NASA ADS] [CrossRef] [EDP Sciences] [Google Scholar]
- Venemans, B. P., Walter, F., Decarli, R., et al. 2017, ApJ, 837, 146 [NASA ADS] [CrossRef] [Google Scholar]
- Wang, B., Leja, J., de Graaff, A., et al. 2024, ApJ, 969, L13 [NASA ADS] [CrossRef] [Google Scholar]
- White, R. L., Becker, R. H., Helfand, D. J., & Gregg, M. D. 1997, ApJ, 475, 479 [Google Scholar]
- Williams, C. C., Alberts, S., Ji, Z., et al. 2024, ApJ, 968, 34 [NASA ADS] [CrossRef] [Google Scholar]
- Yue, M., Eilers, A.-C., Ananna, T. T., et al. 2024, ApJ, 974, L26 [CrossRef] [Google Scholar]
Appendix A: Radio counterparts of individual LRDs
In the FIRST catalogue, only two radio sources were found within 5′′ distance to the LRDs in the sample, and one of those was also identified in the first-epoch VLASS radio component catalogue, in the vicinity of the LRDs J0217−0513 (id. 52581, Kokorev et al. 2024), and J1000+0149 (id. 381494, Akins et al. 2024). The latter remained ‘undetected’ in the VLASS catalogue. This appears to be the fainter component of a double radio source, with the brighter component being at  distance. No counterparts were identified in the second-epoch VLASS catalogue, although both radio sources are visible in all three epochs of the quick look images. This can be attributed to the low signal-to-noise ratio of SNR ≲ 5, which is just below the VLASS-defined detection limit. These radio sources are shown in Fig. A.1.
The finer angular resolution of VLASS, the astrometric precision of JWST, and the presence of known optical sources coinciding with the radio co-ordinates strongly suggest that the LRDs are unlikely to be connected to the radio emission. The radio source closest to J0217−0513 is surrounded with the components of the gravitational lensing system SL2S J02176−0513, with the lens galaxy (z = 0.656) coinciding with the radio peak, and the arc-shaped images of the lensed galaxy (z = 1.847) ‘enveloping’ the eastern side of the radio feature (Tu et al. 2009). The brighter component of the double radio source in the field of J100+0149 is consistent with the position of both a galaxy (Oklopčić et al. 2010) and a galaxy cluster (Giodini et al. 2010) at z = 0.53. The fact that the LRD is unrelated to the radio emission from the foreground sources is also supported by the radio morphology seen in the more sensitive 1.3-GHz radio map from recent MeerKAT observations (Heywood et al. 2022).
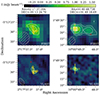 |
Fig. A.1. FIRST and VLASS image cutouts around two LRDs, J0217−0513 (id. 52581, left) and J1000+0149 (id. 381494, right). The co-ordinates corresponding to the positions of the LRDs (red crosses) are shown on the top of each column. Yellow markers denote the most probable optical counterparts of the radio emission, the gravitational lensing system SL2S J02176−0513 (Tu et al. 2009) for the first, and a radio galaxy (Oklopčić et al. 2010) or a galaxy cluster (Giodini et al. 2010) for the second radio source. The first radio contours (white) are drawn at ±3σ rms noise levels (∼0.4 mJy beam−1), and the positive levels increase by a factor of |


Based on the above, we can conclude that none of the 919 LRDs in our sample can be securely associated with any radio source in the VLASS and FIRST surveys.
Appendix B: Stacking redshift-binned subsamples
As of today, the exact physical properties and any statistically significant differences in the LRD population are still under examination. However, it is likely that LRDs represent various kinds of different objects, and thus show different properties depending on the redshift. Stacking analyses were carried out with dividing the LRDs into four redshift bins with approximately equal number of sources in each. As the decrease of the image noise follows the  relation, where N is the number of objects in the stacked sample, defining subsamples would limit the sensitivity of the stacked images. Indeed, we found higher rms levels (∼5 − 14 μJy beam−1) with similarly low SNR (∼2 − 3) values in both the mean (Fig B.1) and median (Fig B.2) stacked VLASS maps in of the redshift-binned sample. Based on the results on both the mean and median-stacked binned-data, no further conclusions can be drawn. Thus, at the moment we can only discuss the stacking of the sample as a whole in detail.
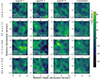 |
Fig. B.1. Mean stacked VLASS images of the LRDs in the sample, divided into four redshift bins. Contour lines denote the ±3σ rms noise levels. |
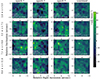 |
Fig. B.2. Median stacked VLASS images of the LRDs in the sample, divided into four redshift bins. Contour lines denote the ±3σ rms noise levels. |
All Tables
All Figures
|
Fig. 1. Relation of the spectroscopic and photometric redshift for the 51 LRDs with both values available. The shaded blue area denotes parity with a ±3σ standard deviation. |
| In the text | |
|
Fig. 2. Distribution of LRDs as a function of redshift. Photometric and spectroscopic values are denoted with dark grey and (hatched) light grey bars. |
| In the text | |
|
Fig. 3. Mean and median stacked empty-field VLASS and FIRST images of the LRDs in the sample. Image properties are listed in Table 1. |
| In the text | |
|
Fig. A.1. FIRST and VLASS image cutouts around two LRDs, J0217−0513 (id. 52581, left) and J1000+0149 (id. 381494, right). The co-ordinates corresponding to the positions of the LRDs (red crosses) are shown on the top of each column. Yellow markers denote the most probable optical counterparts of the radio emission, the gravitational lensing system SL2S J02176−0513 (Tu et al. 2009) for the first, and a radio galaxy (Oklopčić et al. 2010) or a galaxy cluster (Giodini et al. 2010) for the second radio source. The first radio contours (white) are drawn at ±3σ rms noise levels (∼0.4 mJy beam−1), and the positive levels increase by a factor of |
| In the text | |
|
Fig. B.1. Mean stacked VLASS images of the LRDs in the sample, divided into four redshift bins. Contour lines denote the ±3σ rms noise levels. |
| In the text | |
|
Fig. B.2. Median stacked VLASS images of the LRDs in the sample, divided into four redshift bins. Contour lines denote the ±3σ rms noise levels. |
| In the text | |
Current usage metrics show cumulative count of Article Views (full-text article views including HTML views, PDF and ePub downloads, according to the available data) and Abstracts Views on Vision4Press platform.
Data correspond to usage on the plateform after 2015. The current usage metrics is available 48-96 hours after online publication and is updated daily on week days.
Initial download of the metrics may take a while.