| Issue |
A&A
Volume 694, February 2025
|
|
|---|---|---|
| Article Number | L14 | |
| Number of page(s) | 8 | |
| Section | Letters to the Editor | |
| DOI | https://doi.org/10.1051/0004-6361/202453194 | |
| Published online | 14 February 2025 | |
Letter to the Editor
Radio emission from little red dots may reveal their true nature
1
Physics Department, College of Science, United Arab Emirates University, PO Box 15551, Al-Ain, UAE
2
Institute of Cosmology and Gravitation, Portsmouth University, Dennis Sciama Building, Portsmouth PO1 3FX, UK
3
Institute of Space Sciences (ICE, CSIC), Campus UAB, Carrer de Magrans, 08193 Barcelona, Spain
4
Institut d’Estudis Espacials de Catalunya (IEEC), Edifici RDIT, Campus UPC, 08860 Castelldefels (Barcelona), Spain
⋆ Corresponding author; latifne@gmail.com
Received:
27
November
2024
Accepted:
31
January
2025
Context. The unprecedented sensitivity of the James Webb Space Telescope (JWST) has revolutionized our understanding of the early Universe. Among the most intriguing JWST discoveries are red, very compact objects that show broad line emission features, nicknamed little red dots (LRDs). The discovery of LRDs has triggered great interest in their origin as either extremely starbursting galaxies or highly obscured active galactic nuclei (AGNs). Their exact nature remains unknown.
Aims. The goal of this work is to estimate the radio emission from LRDs and predict which radio surveys would detect them. To achieve these objectives, we employed the fundamental plane of black hole (BH) accretion to estimate radio emission from AGNs and the stellar radio fluxes from their host galaxies. We assumed a range of BH masses, X-ray luminosities (LX), and star formation rates (SFRs) to bracket the likely properties of LRDs.
Methods. Our findings suggest that BH radio fluxes from LRDs are 10–100 times higher than the stellar fluxes from their host galaxies, depending on the BH mass, LX, and SFR. The detection of a ∼500 nJy signal above 2 GHz at z ≥ 5 or a ∼2000 nJy flux at z = 3–4 would be a smoking gun for the presence of AGNs provided that SFRs in the host galaxies are < 30 M⊙ yr−1.
Results. We find that LRDs are most likely radio-quiet AGNs; otherwise, they would have already been detected in the current radio surveys. Our findings suggest that LRDs can be detected with upcoming radio observatories such as ngVLA and SKA with integration times of 10–100 h, respectively.
Key words: galaxies: active / galaxies: high-redshift
© The Authors 2025
 Open Access article, published by EDP Sciences, under the terms of the Creative Commons Attribution License (https://creativecommons.org/licenses/by/4.0), which permits unrestricted use, distribution, and reproduction in any medium, provided the original work is properly cited.
This article is published in open access under the Subscribe to Open model. Subscribe to A&A to support open access publication.
1. Introduction
Recent James Webb Space Telescope (JWST) photometric and spectroscopic surveys have uncovered a large sample of faint active galactic nucleus (AGN) candidates at z = 4–10; this has led to a seismic shift in our understanding of the AGN population (Bogdán et al. 2024; Kokorev et al. 2023; Furtak et al. 2024; Lambrides et al. 2024; Larson et al. 2023; Goulding et al. 2023; Maiolino et al. 2024b; Matthee et al. 2024; Kokorev et al. 2024; Greene et al. 2024). Among the most intriguing discoveries are very compact, reddish objects that exhibit broad line emission features in their spectra, the little red dots (LRDs; Matthee et al. 2024; Greene et al. 2024; Kocevski et al. 2024; Maiolino et al. 2024a). Their spectral energy distributions show V-shape features that can be explained by extremely starbursting galaxies, highly-obscured AGNs, or a combination of the two. If LRDs are due to rapid star formation, their inferred stellar masses would be 1010 − 1011 M⊙, unusually high for galaxies at such redshifts (Pérez-González et al. 2024). Although supernova- or star-formation-generated outflows may explain observational features of LRDs such as broad line emission, narrow unresolved forbidden lines such as [O III] cannot be explained by just stars (Maiolino et al. 2024a). Alternatively, they could be heterogeneous galaxies with contributions both from stars and AGNs.
Spectroscopic studies suggest that LRDs are dust-reddened AGNs with Lbol = 1043 − 46 erg s−1 and inferred black hole (BH) masses of 106 − 108 M⊙ (Greene et al. 2024; Matthee et al. 2024). Moreover, their cosmic abundance is two orders of magnitude (∼ 10−5 Mpc−3 mag−1) higher than quasars observed at such redshifts (Matthee et al. 2024; Kokorev et al. 2024; Greene et al. 2024). LRDs provide key insights into the AGN population, the co-evolution of AGNs with their host galaxies, BH seeding and growth mechanisms, and AGN contribution to cosmic reionization. So far, near-infrared observations by JWST remain inconclusive as star formation and AGNs can produce similar spectral features. X-ray emission, which could be a robust indicator of the presence of AGNs, has only been detected for a few LRDs to date (Maiolino et al. 2024a; Kocevski et al. 2024) and mostly remains undetected (Ananna et al. 2024; Yue et al. 2024). Nevertheless, these studies provide useful constraints on AGN activity, such as their BH masses and accretion rates. Multiwavelength observations may unambiguously reveal the signatures of AGN activity. However, while both the near-infrared and X-rays are obscured by dust in the host galaxies, radio is not. Akins et al. (2024) report non-detections of LRDs in radio in current data from MeerKAT at 1.4 GHz and from the VLA at 3 GHz, potential proof that the average LRDs are not radio-loud AGNs. Deeper future observations are required to determine their properties and true nature.
Motivated by the prospect that ≳106 M⊙ BHs will be detected by upcoming radio surveys by the Next-Generation Very Large Array (ngVLA) and the Square Kilometer Array (SKA) up to z ≲ 13 − 14 (Whalen et al. 2023; Latif et al. 2024b,a), we propose following up LRDs in the radio. In Sect. 2 we lay out our method for estimating radio fluxes from AGNs and host galaxies. We present our flux estimates in Sect. 3 and discuss our conclusions in Sect. 4.
2. Numerical method
2.1. Radio emission from BHs in LRDs
We estimated the radio flux at 0.1–10 GHz from BHs in LRDs using the fundamental plane (FP) of BH accretion. The FP is an empirical relation between the nuclear radio luminosity (LR) at 5 GHz, the BH mass (MBH), and the X-ray luminosity (LX) at 2–10 keV (Merloni et al. 2003). It is valid over five orders of magnitude in BH mass down to MBH ∼ 105 M⊙ (Gültekin et al. 2014). To compute the expected radio flux from the BH in the observer frame, we calculated LR from LX using the FP:

where A, B, and C are taken from Merloni et al. (2003), Körding et al. (2006), Gültekin et al. (2009), Plotkin et al. (2012), and Bonchi et al. (2013) and are listed in Table 2 of Latif et al. (2024b).
Bariuan et al. (2022) find that the FP depends on the radio-loudness of the source. To take this into account, we used the relations for radio-quiet and radio-loud sources from Bariuan et al. (2022). For radio-loud cases, we used A = 1.12 ± 0.06, B = 0.20 ± 0.07, and C = −(5.64 ± 2.99) and for the radio-quiet cases, A = 0.48 ± 0.06, B = 0.50 ± 0.08, and C = 15.26 ± 2.66. X-ray observations of LRDs provide upper limits on their X-ray luminosities at 2–10 KeV (Ananna et al. 2024; Yue et al. 2024). We took three values of LX, 1043 erg s−1, 1043.5 erg s−1, and 1044 erg s−1, from Table 1 of Ananna et al. (2024). Similarly, three fiducial values of MBH, 106 M⊙, 106.5 M⊙, and 107 M⊙, were taken based on the X-ray observations of LRDs mentioned above.
To cover the range of LRD redshifts, we considered z = 3 − 7. Because of cosmological redshifting, the radio flux does not originate from 5 GHz in the observer frame today. Radio fluxes from the FP were redshifted into the current ngVLA and SKA bands using the relation LR = νLν in the source frame, assuming that Lν ∝ ν−α. As explained in Sect. 4, we used a spectral index α = 0.3 and computed the spectral flux at frequency ν in the observer frame from the spectral luminosity at ν′ in the source frame from
where dL is the luminosity distance and ν′=(1 + z)ν. We employed cosmological parameters from Planck: ΩM = 0.308, ΩΛ = 0.691, Ωbh2 = 0.0223, σ8 = 0.816, h = 0.677, and n = 0.968 (Planck Collaboration XIII 2016).
2.2. Radio emission from host galaxies
Massive stars in host galaxies create H II regions that produce continuum radio flux via thermal bremsstrahlung emission. Also, the synchrotron emission from young supernova remnants in host galaxies produces radio flux that contributes to the total radio emission from AGNs, particularly at lower frequencies. To estimate the radio emission from host galaxies, we used the empirical relation given in Delhaize et al. (2017), which also takes the redshift dependence into account; we briefly summarize it here (see Delhaize et al. 2017 for further details). We estimated the radio luminosity as
![$$ \begin{aligned} L_{\rm R} [W/\mathrm{Hz}] = \frac{SFR[M_{\odot }/\mathrm{yr}]}{f_{\rm IMF}10^{-24}10^{q_{\rm TIR}(z,\alpha )}} ,\end{aligned} $$](/articles/aa/full_html/2025/02/aa53194-24/aa53194-24-eq3.gif)
where

and fIMF is the factor for the assumed initial mass function (IMF), which we took to be fIMF = 1.7 for the Salpeter IMF. The α is the assumed spectral index of the star-forming galaxy, which we took to be −0.7. We estimated the stellar flux using the following relation:
We employed two values of the observing frequency (νobs), 3 GHz and 8 GHz, and α = −0.7. Equation 5 was tested by Delhaize et al. (2017) for 3 GHz, but we assumed it is also valid for 8 GHz; this assumption does not impact our results. Star formation rates (SFRs) in the host galaxies of LRDs are not directly measured but are typically estimated with stellar synthesis codes and remain largely uncertain because of degeneracies in the models (Greene et al. 2024). To bracket the range of SFRs inferred for LRDs, we considered 1, 10, and 30 M⊙ yr−1 at each redshift.
3. Results
The AGN-to-SFR flux ratios versus BH masses are shown for 3 GHz and 8 GHz at z = 7 in Fig. A.1. These two frequencies are best for distinguishing AGN fluxes from those of their host galaxies (Whalen et al. 2023; Latif et al. 2024b,a). Also, they allow us to compare our results with the VLA Cosmic Evolution Survey (COSMOS). We considered two scenarios: with and without radio-loudness. We call the first case the “standard” scenario and the second the “radio-loudness” scenario.
3.1. Standard scenario
We find that for SFR = 1 M⊙ yr−1, the flux ratios vary from 0.1–40 and that the maximum AGN fluxes are dominant over the host galaxies for the entire range of MBH and LX, but that the minimum AGN fluxes only exceed the host galaxies for MBH > 106.5 M⊙ and LX ≥1043.5 erg s−1. For SFR = 10 M⊙ yr−1 the flux ratios vary from 0.02–4, the minimum AGN fluxes are subdominant compared to the emission from host galaxies for all cases, and the maximum AGN fluxes only exceed stellar fluxes for MBH > 106.5 M⊙ and LX ≥1043.5 erg s−1. In the case of SFR = 30 M⊙ yr−1, flux ratios drop to 0.002–2, and stellar fluxes from host galaxies are higher than both the minimum and maximum fluxes only, with the exception of MBH = 107 M⊙ with LX ≥1044 erg s−1. We show flux ratios for z = 7 in Fig. A.1; they actually increase at lower redshifts. Also, the flux ratios at 8 GHz do not significantly differ from those at 3 GHz.
The fluxes for AGNs and stars in their host galaxies are shown at 3 < z < 7 in Fig. A.2. For the sake of simplicity, only the minimum and maximum AGN fluxes (associated with the error bars of the FP) for α = 0.3 are shown. The six FP fluxes vary by a factor of about 20. The AGN radio fluxes range from 1–3000 nJy and decrease by a factor of a few from z = 3–7. On the other hand, the stellar fluxes from the host galaxies vary from 10–40 nJy, 100–400 nJy, and 400–1000 nJy for SFRs = 1, 10, and 30 M⊙ yr−1, respectively. The AGN radio fluxes are highest at z = 3 for MBH = 107 M⊙ and LX = 1044 erg s−1 and lowest at z = 7 for MBH = 106 M⊙ and LX = 1043 erg s−1. Generally, the maximum AGN fluxes are higher than those of the host galaxies for SFR = 1 M⊙ yr−1 for all cases, while the minimum AGN fluxes only exceed host galaxies at MBH = 107 M⊙ and LX = 1044 erg s−1. For SFR = 10 M⊙ yr−1, the maximum AGN fluxes only exceed the stellar fluxes from the host galaxies for MBH = 107 M⊙ at z < 5. The minimum AGN fluxes are lower than the stellar fluxes from the host galaxies for all cases. For SFR = 30 M⊙ yr−1, only the maximum AGN flux from MBH = 107 M⊙ with LX = 1044 erg s−1 is higher than the stellar fluxes, while in all the remaining cases the stellar fluxes from the host galaxies outshine their AGNs. These trends are found at all redshifts.
3.2. Radio-loudness scenario
In this scenario, we introduce radio-loudness to our analysis and report the results obtained for radio-loud sources versus radio-quiet sources, which are shown in Fig. A.3. We note that flux ratios are much higher compared to the standard cases discussed above. For SFR = 1 M⊙ yr−1, we find that flux ratios vary from 5–2000, and AGN fluxes outshine the host galaxies both for radio-loud and radio-quiet cases irrespective of MBH and LX. For SFR = 10 M⊙ yr−1, the flux ratios range from 0.5–2000 and fluxes from both radio-loud and radio-quiet cases are higher than those of host galaxies for MBH ≥ 106.5 M⊙, the only exception being MBH = 106 M⊙ with LX = 1043 erg s−1. Even in the case of SFR = 30 M⊙ yr−1, radio-loud AGN fluxes remain dominant over the stellar fluxes from the host galaxies, but radio-quiet AGN fluxes become subdominant.
The AGN fluxes and stellar fluxes from the host galaxies for the radio-loudness scenario are shown at 3 < z < 7 in Fig. A.4. The radio-loud AGN fluxes range from 20 000–2 000 000 nJy and the radio-quiet AGN fluxes from 90–4000 nJy. In both cases, they only decrease by a factor of a few at z = 3–7. The radio-quiet fluxes are about two orders of magnitude lower than the radio-loud fluxes. The AGN radio-loud fluxes dominate the host galaxies irrespective of SFRs. The stellar fluxes from host galaxies are subdominant compared to the radio-quiet AGN fluxes for SFR = 1 M⊙ yr−1, which are on the order of 15–40 nJy. For SFR = 10 M⊙ yr−1, the stellar fluxes are a few hundred nanojanskys and become comparable to the radio-quiet AGN fluxes only for MBH = 106 M⊙, while for all of the remaining cases they are lower. In the case of SFR = 30 M⊙ yr−1, the radio-quiet AGN fluxes only exceed those of the host galaxies for MBH = 107 M⊙ with LX = 1044 erg s−1.
3.3. Observational prospects
We find that most of the AGN fluxes can be detected by the ngVLA with integration times of about 10 h at 3 < z < 7, while the SKA will require approximately 100 h. These estimates are based on the proposed reference designs (for further details, see Whalen et al. 2023). The SKA limits for 3 and 8 GHz are listed in Table 3 of Braun et al. (2019), and the ngVLA 5-sigma values are taken from Plotkin & Reines (2018). Even 1 h of integration with the ngVLA will be able to detect AGNs with MBH ≥ 106.5 M⊙ at z < 5. In general, for the same flux the SKA requires 10 times longer integration times than the ngVLA. Most importantly, the detection of any signal above ∼2000 nJy at z = 3–4 and above ∼500 nJy at z > 5 would be a smoking gun for the presence of an AGN in LRDs if SFRs in the host galaxies are 10 M⊙ yr−1. Mazzolari et al. (2024) performed a stacking analysis of 22 JWST-selected broad line AGNs and report radio non-detection down to 0.2 μJy/beam. Similar results are found by Akins et al. (2024) and Gloudemans et al. (2025) from the COSMOS survey. Perger et al. (2025) stacked a sample of more than 900 LRDs from the VLASS and FIRST surveys and obtained upper limits of ∼11 μJy/beam and ∼18 μJy/beam, respectively. These observations (Mazzolari et al. 2024; Akins et al. 2024; Perger et al. 2025; Gloudemans et al. 2025) rule out the possibility that LRDs are radio-loud AGNs; otherwise, they would have already been detected in the current VLASS, FIRST, and COSMOS surveys. The only radio detection of an LRD comes from Gloudemans et al. (2025), who find a radio flux of ∼0.15 μJy/beam and a radio-loudness of 0.5. They also find that current radio observations do not have sufficient depth to claim that JWST discovered high-z candidates are radio-weak AGNs. This further supports our finding that the radio-quiet AGN scenario cannot be ruled out by the current observations; confirming or ruling out this scenario would require deeper observations, down to 10 nJy.
4. Discussion and conclusion
We estimated radio fluxes from AGN candidates in LRDs and stellar fluxes from their host galaxies for a range of BH masses, LX, redshifts, and SFRs. Also, we considered two different scenarios, the standard case and the radio-loudness case. For the standard scenario, we find that the maximum AGN radio flux densities range from 1–3000 nJy and are about 100, 10, and 2 times higher than the radio emission from stars in their host galaxies for SFR = 1, 10, and 30 M⊙ yr−1, respectively. For low SFRs of 1 M⊙ yr−1, AGN radio fluxes dominate stellar fluxes from their host galaxies, but for higher SFRs, ≥10 M⊙ yr−1, AGN fluxes only exceed those of the host galaxies for MBH = 107 M⊙. Overall, radio AGN fluxes decrease by a factor of a few from z = 3 to z = 7. For the radio-loudness scenario, radio-loud AGN fluxes are about two orders of magnitude higher compared to the corresponding radio-quiet cases. In general, radio-quiet fluxes are comparable to the standard scenario. Our findings suggest that if LRDs were hosts of radio-loud AGNs, then they would have already been detected with current observations in the VLA-COSMOS or FIRST survey. We find that LRDs are most likely radio-quiet AGNs and that their radio properties can be probed with upcoming radio observatories such as ngVLA and SKA. If SFRs in the LRDs’ host galaxies are < 30 M⊙ yr−1, then the detection of radio fluxes above ∼2000 nJy at z = 3–4 and above ∼500 nJy at z > 5 would be a clear indication of the presence of a BH in an LRD. Otherwise, AGN radio fluxes cannot be distinguished from their host galaxies.
We employed the empirical relation given in Delhaize et al. (2017) to estimate the radio emission from host galaxies, but our estimates of the AGN-to-SFR flux ratios may depend on the choice of radio-SFR relation. Observations of radio sources in the local Universe suggest a median value of α = 0.7 (Condon et al. 2002), while radio emission from high-z quasars indicate a median value of α = 0.3 (Gloudemans et al. 2021). These values evince an intrinsic scatter in α for individual sources. Although we show here radio fluxes for α = 0.3, in our previous studies we found that α = 0.7 caused fluxes to decrease by a factor of 2 at ν > 5 GHz but to increase by the same factor at low frequencies (0.1 GHz; Whalen et al. 2023; Latif et al. 2024a,b). Our main conclusions are thus true for both values of α.
Some studies suggest that LRDs could be AGNs accreting above the Eddington limit and are highly obscured because of large columns of gas and dust (Pacucci & Narayan 2024; Inayoshi & Maiolino 2024). Even in this case, our estimates for radio emission would remain valid because radio is least affected by such effects. Moreover, in the case of super-Eddington accretion, one would expect radio jets and lobes, which are expected to dissipate energy via scattering with the cosmic microwave background at high redshifts rather than emitting synchrotron radiation (Ghisellini et al. 2014; Fabian et al. 2014; Gloudemans et al. 2024). However, if such jets are formed at lower redshifts (z < 5), then they would be visible.
Acknowledgments
MAL thanks the UAEU for funding via SURE Plus grant No. 12S182. MM acknowledges support from the Spanish Ministry of Science and Innovation through the project PID2021-124243NB-C22. This work was partially supported by the program Unidad de Excelencia María de Maeztu CEX2020-001058-M. We thank the referee for constructive feedback.
References
- Akins, H. B., Casey, C. M., Lambrides, E., et al. 2024, ApJ, submitted, [arXiv:2406.10341] [Google Scholar]
- Ananna, T. T., Bogdán, Á., Kovács, O. E., Natarajan, P., & Hickox, R. C. 2024, ApJ, 969, L18 [NASA ADS] [CrossRef] [Google Scholar]
- Bariuan, L. G. C., Snios, B., Sobolewska, M., Siemiginowska, A., & Schwartz, D. A. 2022, MNRAS, 513, 4673 [NASA ADS] [CrossRef] [Google Scholar]
- Bogdán, Á., Goulding, A. D., Natarajan, P., et al. 2024, Nat. Astron., 8, 126 [Google Scholar]
- Bonchi, A., La Franca, F., Melini, G., Bongiorno, A., & Fiore, F. 2013, MNRAS, 429, 1970 [CrossRef] [Google Scholar]
- Braun, R., Bonaldi, A., Bourke, T., Keane, E., & Wagg, J. 2019, arXiv e-prints [arXiv:1912.12699] [Google Scholar]
- Condon, J. J., Cotton, W. D., & Broderick, J. J. 2002, AJ, 124, 675 [Google Scholar]
- Delhaize, J., Smolčić, V., Delvecchio, I., et al. 2017, A&A, 602, A4 [NASA ADS] [CrossRef] [EDP Sciences] [Google Scholar]
- Fabian, A. C., Walker, S. A., Celotti, A., et al. 2014, MNRAS, 442, L81 [NASA ADS] [CrossRef] [Google Scholar]
- Furtak, L. J., Labbé, I., Zitrin, A., et al. 2024, Nature, 628, 57 [NASA ADS] [CrossRef] [Google Scholar]
- Ghisellini, G., Celotti, A., Tavecchio, F., Haardt, F., & Sbarrato, T. 2014, MNRAS, 438, 2694 [NASA ADS] [CrossRef] [Google Scholar]
- Gloudemans, A. J., Duncan, K. J., Röttgering, H. J. A., et al. 2021, A&A, 656, A137 [NASA ADS] [CrossRef] [EDP Sciences] [Google Scholar]
- Gloudemans, A. J., Sweijen, F., Morabito, L. K., et al. 2024, ApJ, accepted, [arXiv:2411.16838] [Google Scholar]
- Gloudemans, A. J., Duncan, K. J., Eilers, A. C., et al. 2025, ApJ, submitted, [arXiv:2501.04912] [Google Scholar]
- Goulding, A. D., Greene, J. E., Setton, D. J., et al. 2023, ApJ, 955, L24 [NASA ADS] [CrossRef] [Google Scholar]
- Greene, J. E., Labbe, I., Goulding, A. D., et al. 2024, ApJ, 964, 39 [CrossRef] [Google Scholar]
- Gültekin, K., Cackett, E. M., Miller, J. M., et al. 2009, ApJ, 706, 404 [CrossRef] [Google Scholar]
- Gültekin, K., Cackett, E. M., King, A. L., Miller, J. M., & Pinkney, J. 2014, ApJ, 788, L22 [CrossRef] [Google Scholar]
- Inayoshi, K., & Maiolino, R. 2024, arXiv e-prints [arXiv:2409.07805] [Google Scholar]
- Kocevski, D. D., Finkelstein, S. L., Barro, G., et al. 2024, ApJ, accepted, [arXiv:2404.03576] [Google Scholar]
- Kokorev, V., Fujimoto, S., Labbe, I., et al. 2023, ApJ, 957, L7 [NASA ADS] [CrossRef] [Google Scholar]
- Kokorev, V., Caputi, K. I., Greene, J. E., et al. 2024, ApJ, 968, 38 [NASA ADS] [CrossRef] [Google Scholar]
- Körding, E., Falcke, H., & Corbel, S. 2006, A&A, 456, 439 [NASA ADS] [CrossRef] [EDP Sciences] [Google Scholar]
- Lambrides, E., Chiaberge, M., Long, A. S., et al. 2024, ApJ, 961, L25 [NASA ADS] [CrossRef] [Google Scholar]
- Larson, R. L., Finkelstein, S. L., Kocevski, D. D., et al. 2023, ApJ, 953, L29 [NASA ADS] [CrossRef] [Google Scholar]
- Latif, M. A., Aftab, A., & Whalen, D. J. 2024a, AJ, 167, 251 [NASA ADS] [CrossRef] [Google Scholar]
- Latif, M. A., Whalen, D. J., & Mezcua, M. 2024b, MNRAS, 527, L37 [Google Scholar]
- Maiolino, R., Risaliti, G., Signorini, M., et al. 2024a, MNRAS, submitted, [arXiv:2405.00504] [Google Scholar]
- Maiolino, R., Scholtz, J., Witstok, J., et al. 2024b, Nature, 627, 59 [NASA ADS] [CrossRef] [Google Scholar]
- Matthee, J., Naidu, R. P., Brammer, G., et al. 2024, ApJ, 963, 129 [NASA ADS] [CrossRef] [Google Scholar]
- Mazzolari, G., Gilli, R., Maiolino, R., et al. 2024, A&A, submitted [Google Scholar]
- Merloni, A., Heinz, S., & di Matteo, T. 2003, MNRAS, 345, 1057 [Google Scholar]
- Pacucci, F., & Narayan, R. 2024, ApJ, 976, 96 [NASA ADS] [CrossRef] [Google Scholar]
- Pérez-González, P. G., Barro, G., Rieke, G. H., et al. 2024, ApJ, 968, 4 [CrossRef] [Google Scholar]
- Perger, K., Fogasy, J., Frey, S., & Gabányi, K. É. 2025, A&A, 693, L2 [NASA ADS] [CrossRef] [EDP Sciences] [Google Scholar]
- Planck Collaboration XIII. 2016, A&A, 594, A13 [NASA ADS] [CrossRef] [EDP Sciences] [Google Scholar]
- Plotkin, R. M., & Reines, A. E. 2018, arXiv e-prints [arXiv:1810.06814] [Google Scholar]
- Plotkin, R. M., Markoff, S., Kelly, B. C., Körding, E., & Anderson, S. F. 2012, MNRAS, 419, 267 [NASA ADS] [CrossRef] [Google Scholar]
- Whalen, D. J., Latif, M. A., & Mezcua, M. 2023, ApJ, 956, 133 [NASA ADS] [CrossRef] [Google Scholar]
- Yue, M., Eilers, A.-C., Ananna, T. T., et al. 2024, ApJ, 974, L26 [CrossRef] [Google Scholar]
Appendix A: Figures
We show all figures in Appendix A.
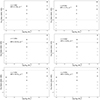 |
Fig. A.1. AGN-to-SFR flux ratios vs. BH mass at z= 7. The empty and filled symbols are for the minimum and maximum fluxes from the FP, respectively. Circles, triangles, and squares are for log(LX) = 43 erg s−1, log(LX) = 43.5 erg s−1, and log(LX) = 44 erg s−1, respectively. Horizontal dashed lines are for AGN/SFR flux ratio = 1. |
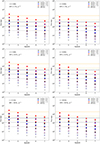 |
Fig. A.2. Fluxes vs. redshift. Empty shapes are for the minimum fluxes and filled shapes for the maximum fluxes from the FP. Colors indicate BH mass and black crosses SFR fluxes. Circles, triangles, and squares are for log(LX) = 43 erg s−1, log(LX) = 43.5 erg s−1, and log(LX) = 44 erg s−1, respectively. The orange and black lines are sensitivity limits for SKA and ngVLA, respectively, for integration times of 1 hr (solid), 10 hr (dashed), and 100 hr (dotted). |
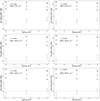 |
Fig. A.3. AGN-to-SFR flux ratios vs. BH mass at z= 7. The empty and filled symbols are for the radio-quiet and radio-loud sources, respectively. Circles, triangles, and squares are for log(LX) = 43 erg s−1, log(LX) = 43.5 erg s−1, and log(LX) = 44 erg s−1, respectively. Horizontal dashed lines are for AGN/SFR flux ratio = 1. |
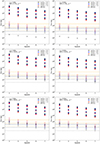 |
Fig. A.4. Fluxes vs. redshift. The empty symbols are for radio-quiet sources and the filled symbols for radio-loud sources. Colors indicate BH mass, and black crosses SFR fluxes. Circles, triangles, and squares are for log(LX) = 43 erg s−1, log(LX) = 43.5 erg s−1, and log(LX) = 44 erg s−1, respectively. The orange and black lines are sensitivity limits for SKA and ngVLA, respectively, for integration times of 1 hr (solid), 10 hr (dashed), and 100 hr (dotted). |
All Figures
|
Fig. A.1. AGN-to-SFR flux ratios vs. BH mass at z= 7. The empty and filled symbols are for the minimum and maximum fluxes from the FP, respectively. Circles, triangles, and squares are for log(LX) = 43 erg s−1, log(LX) = 43.5 erg s−1, and log(LX) = 44 erg s−1, respectively. Horizontal dashed lines are for AGN/SFR flux ratio = 1. |
| In the text | |
|
Fig. A.2. Fluxes vs. redshift. Empty shapes are for the minimum fluxes and filled shapes for the maximum fluxes from the FP. Colors indicate BH mass and black crosses SFR fluxes. Circles, triangles, and squares are for log(LX) = 43 erg s−1, log(LX) = 43.5 erg s−1, and log(LX) = 44 erg s−1, respectively. The orange and black lines are sensitivity limits for SKA and ngVLA, respectively, for integration times of 1 hr (solid), 10 hr (dashed), and 100 hr (dotted). |
| In the text | |
|
Fig. A.3. AGN-to-SFR flux ratios vs. BH mass at z= 7. The empty and filled symbols are for the radio-quiet and radio-loud sources, respectively. Circles, triangles, and squares are for log(LX) = 43 erg s−1, log(LX) = 43.5 erg s−1, and log(LX) = 44 erg s−1, respectively. Horizontal dashed lines are for AGN/SFR flux ratio = 1. |
| In the text | |
|
Fig. A.4. Fluxes vs. redshift. The empty symbols are for radio-quiet sources and the filled symbols for radio-loud sources. Colors indicate BH mass, and black crosses SFR fluxes. Circles, triangles, and squares are for log(LX) = 43 erg s−1, log(LX) = 43.5 erg s−1, and log(LX) = 44 erg s−1, respectively. The orange and black lines are sensitivity limits for SKA and ngVLA, respectively, for integration times of 1 hr (solid), 10 hr (dashed), and 100 hr (dotted). |
| In the text | |
Current usage metrics show cumulative count of Article Views (full-text article views including HTML views, PDF and ePub downloads, according to the available data) and Abstracts Views on Vision4Press platform.
Data correspond to usage on the plateform after 2015. The current usage metrics is available 48-96 hours after online publication and is updated daily on week days.
Initial download of the metrics may take a while.