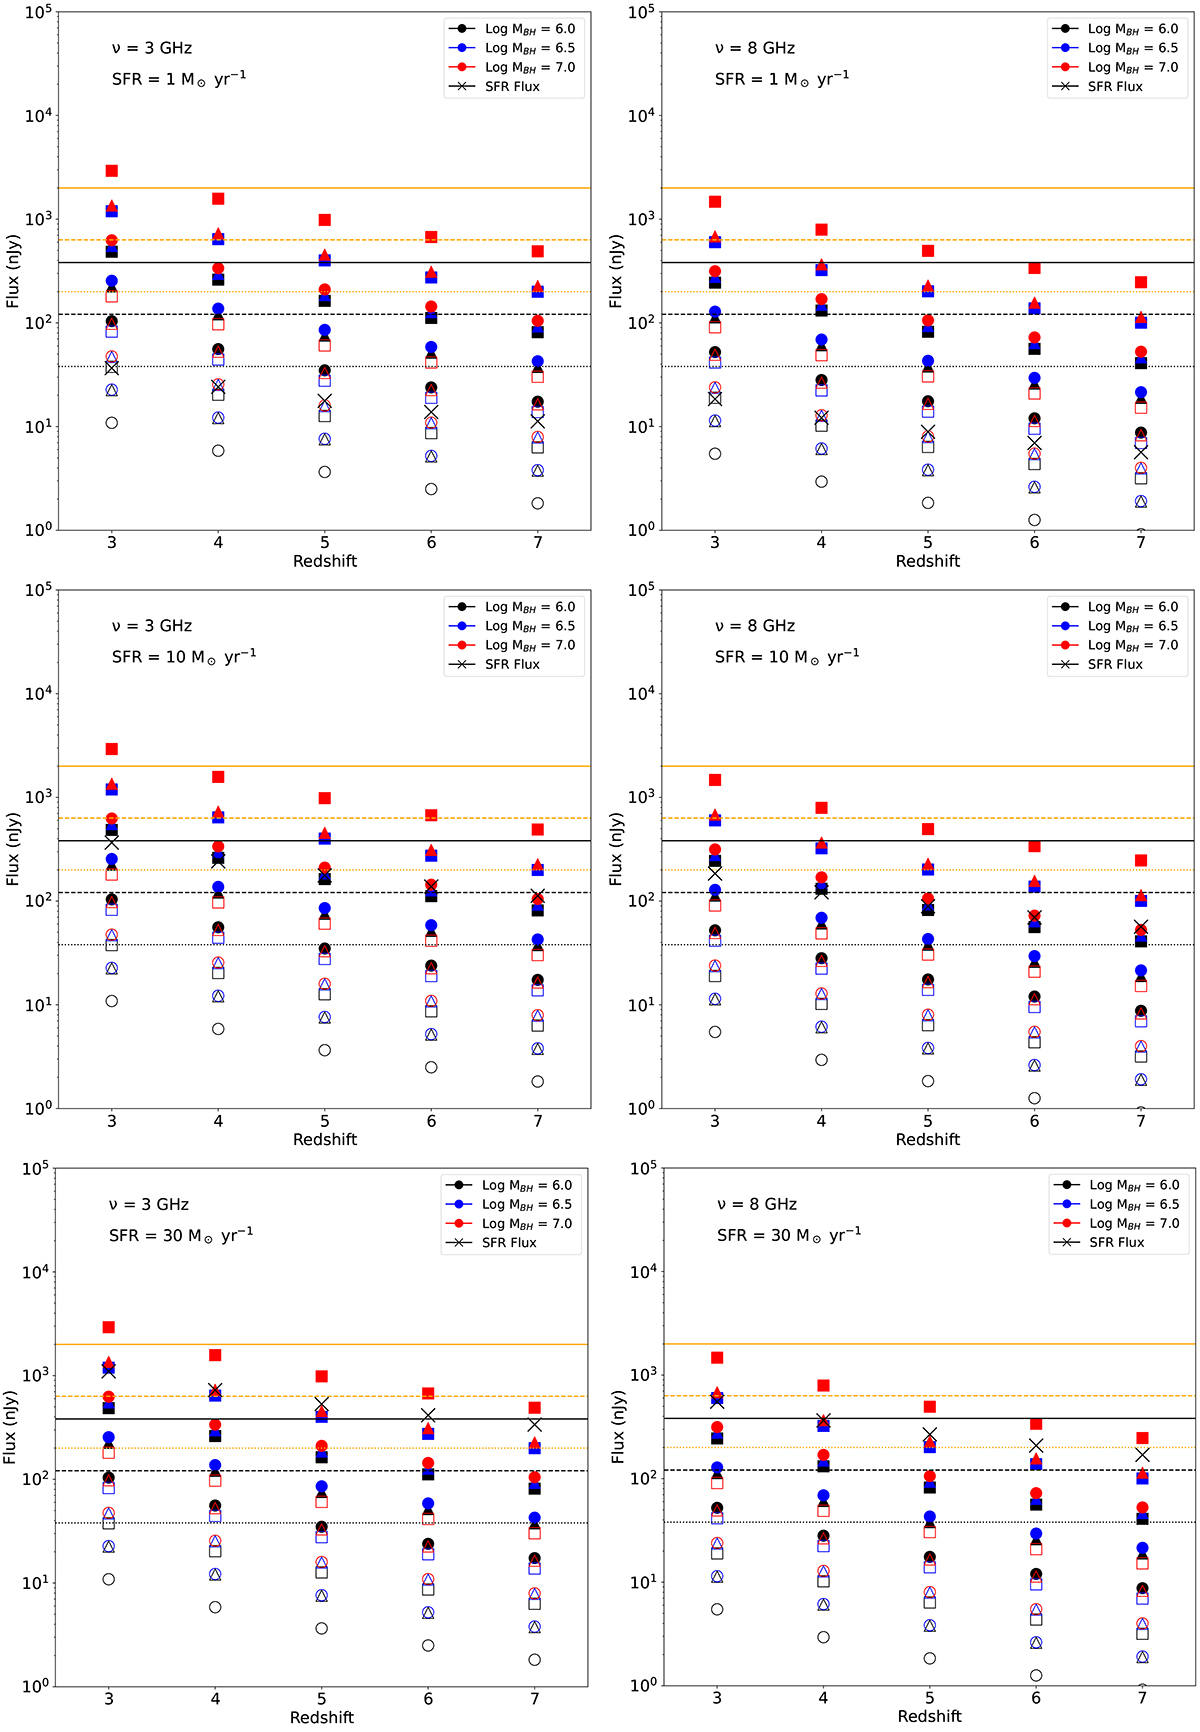
Fig. A.2.
Download original image
Fluxes vs. redshift. Empty shapes are for the minimum fluxes and filled shapes for the maximum fluxes from the FP. Colors indicate BH mass and black crosses SFR fluxes. Circles, triangles, and squares are for log(LX) = 43 erg s−1, log(LX) = 43.5 erg s−1, and log(LX) = 44 erg s−1, respectively. The orange and black lines are sensitivity limits for SKA and ngVLA, respectively, for integration times of 1 hr (solid), 10 hr (dashed), and 100 hr (dotted).
Current usage metrics show cumulative count of Article Views (full-text article views including HTML views, PDF and ePub downloads, according to the available data) and Abstracts Views on Vision4Press platform.
Data correspond to usage on the plateform after 2015. The current usage metrics is available 48-96 hours after online publication and is updated daily on week days.
Initial download of the metrics may take a while.