| Issue |
A&A
Volume 698, June 2025
|
|
|---|---|---|
| Article Number | L2 | |
| Number of page(s) | 5 | |
| Section | Letters to the Editor | |
| DOI | https://doi.org/10.1051/0004-6361/202555177 | |
| Published online | 26 May 2025 | |
Letter to the Editor
Zooming into the neutrino-associated blazar candidate J1718+4239
1
Konkoly Observatory, HUN-REN Research Centre for Astronomy and Earth Sciences, Konkoly-Thege Miklós út 15-17, 1121 Budapest, Hungary
2
CSFK, MTA Centre of Excellence, Konkoly-Thege Miklós út 15-17, 1121 Budapest, Hungary
3
Institute of Physics and Astronomy, ELTE Eötvös Loránd University, Pázmány Péter sétány 1/A, 1117 Budapest, Hungary
4
Department of Astronomy, Institute of Physics and Astronomy, ELTE Eötvös Loránd University, Pázmány Péter sétány 1/A, 1117 Budapest, Hungary
5
HUN-REN–ELTE Extragalactic Astrophysics Research Group, ELTE Eötvös Loránd University, Pázmány Péter sétány 1/A, 1117 Budapest, Hungary
6
Institute of Astronomy, Faculty of Physics, Astronomy and Informatics, Nicolaus Copernicus University, Grudzidzka 5, 87-100 Toruń, Poland
7
Theoretical Physics IV, Faculty for Physics & Astronomy, Ruhr University Bochum, D-44780 Bochum, Germany
8
Faculty for Physics & Astronomy, Astronomical Institute, Ruhr University Bochum, D-44780 Bochum, Germany
9
Ruhr Astroparticle and Plasma Physics Center, Ruhr-Universität Bochum, D-44780 Bochum, Germany
⋆ Corresponding author: This email address is being protected from spambots. You need JavaScript enabled to view it.
Received:
16
April
2025
Accepted:
9
May
2025
Abstract
The radio quasar NVSS J171822+423948 (J1718+4239) was proposed to be the counterpart of the IceCube neutrino event IC-201221A. To reveal the nature of the source, we conducted new very long baseline interferometry observations of this blazar candidate with the Very Long Baseline Array. The observations were carried out in dual-band mode between 4 and 7 GHz. Archival radio data from the literature were also collected for comparison. Our analysis revealed highly variable Doppler-boosted radio emission of the source, with a compact structure at kiloparsec and parsec scales, a slightly inverted spectrum, and a maximum jet inclination angle of θ ≤ 5°. These results confirm that J1718+4239 is a blazar-type object.
Key words: techniques: interferometric / galaxies: active / galaxies: high-redshift / quasars: individual: NVSS J171822+423948
© The Authors 2025
 Open Access article, published by EDP Sciences, under the terms of the Creative Commons Attribution License (https://creativecommons.org/licenses/by/4.0), which permits unrestricted use, distribution, and reproduction in any medium, provided the original work is properly cited.
This article is published in open access under the Subscribe to Open model. This email address is being protected from spambots. You need JavaScript enabled to view it. to support open access publication.
1. Introduction
The exact astrophysical process behind the origin of cosmic high-energy neutrinos is still uncertain to date. Different astrophysical objects and scenarios are discussed in the literature, for instance, X-ray binary systems (e.g. Bednarek et al. 2005; Reynoso et al. 2008; Kantzas & Calore 2024), superbubbles surrounding regions of massive star formation (e.g. Banik & Ghosh 2022), novae (e.g. Bednarek & Śmiałkowski 2022; Abbasi et al. 2023), supernovae (e.g. Bednarek et al. 2005; Bhattacharya et al. 2015; He et al. 2018), starburst galaxies (e.g. Anchordoqui & Torres 2020; Aguilar-Ruiz et al. 2021), the Galactic plane (IceCube Collaboration 2023), and active galactic nuclei (AGN) through various processes (e.g. de Gouveia Dal Pino et al. 2025; Yang et al. 2025). The most probable objects that coincide with the probability regions of the neutrino events were recently suspected to be different types of AGN. Interestingly, they include two object types with inherently different radio properties: radio-loud blazars (e.g. Ansoldi et al. 2018; IceCube Collaboration 2018a,b; Rodrigues et al. 2021; Padovani et al. 2022; Sumida et al. 2022; Novikova et al. 2023; Plavin et al. 2023; Jiang et al. 2024; Ji & Wang 2024; Kőmíves et al. 2024; Kun et al. 2024; Blinov & Novikova 2025; Ji et al. 2025; Omeliukh et al. 2025) with very emphasised radio jets, and Seyfert galaxies (IceCube Collaboration 2022; Neronov et al. 2024), which are usually radio quiet. We note that the classical radio-loudness parameter (R) is defined as the ratio of the 5 GHz radio to the 4400 Å optical flux density, and sources with R > 10 are considered radio loud (e.g. Kellermann et al. 1989). On the other hand, the classical definitions can be misleading, and based on their physical differences, labels of jetted and non-jetted AGN are encouraged (e.g. Padovani 2017). As discussed by Kun et al. (2024), however, continuous neutrino production in AGN would not require the involvement of relativistic (radio) jets.
Active galactic nuclei are thought to host accreting supermassive black holes in the centres of galaxies and emit powerful radiation throughout the entire electromagnetic spectrum. A sub-class of AGN are blazars, whose radio-emitting relativistic plasma jets are inclined at a small angle to the line of sight of the observer (Urry & Padovani 1995). Their radio spectrum is flat (−0.5 ≤ α ≤ 0; Sν ∝ να, where Sν is the flux density and ν the frequency) and their brightness temperatures exceeds the equipartition limit (Tb, eq ≈ 5 × 10¹⁰ K, Readhead 1994), and they are often associated with X-ray (e.g. Sbarrato et al. 2013; Ghisellini et al. 2015; Perger et al. 2021) and γ-ray emission (e.g. Ghisellini et al. 2009; Ackermann et al. 2015; Olmo-García et al. 2022; Peñil et al. 2024). The flux density of blazars also varies in the radio (e.g. Jauncey et al. 2020; Hsu et al. 2023), infrared (e.g. Jiang et al. 2012; Son et al. 2022; Perger et al. 2023), optical (e.g. Marchesini et al. 2016; Tortosa et al. 2023), X-ray (e.g. Bhatta et al. 2018; Mundo & Mushotzky 2023), and γ-ray (Xie et al. 2001; Li et al. 2018) wavebands, and it is occasionally associated with flaring events (e.g. Abdollahi et al. 2017; Liodakis et al. 2019; Olmo-García et al. 2022; Neustadt et al. 2023). The parsec-scale structure of blazars can only be studied with observations using very long baseline interferometry (VLBI), with angular resolutions as fine as milliarcseconds (mas) at gigahertz frequencies. On VLBI scales, blazar jets usually exhibit compact core or one-sided core–jet structures (e.g. Lister et al. 2019) as a result of the Doppler enhancement of the jet emission seen under a small inclination angle.
The quasar NVSS J171822+423948 (J1718+4239) was found to exhibit a flaring behaviour in the γ-ray and optical wavebands, with accompanying mid-infrared variability in its light curve. It was proposed to possibly be associated with the IceCube neutrino event IC-201221A (Jiang et al. 2024).
With its spectroscopic redshift, z = 2.68 (Jiang et al. 2024), the blazar candidate J1718+4239 is one of the highest-redshift γ-ray emitting AGN, and it is the most distant neutrino-source candidate known to date. Based on its variable nature and identified flaring events in the γ-ray, optical, and mid-infrared wavebands, the source fulfils some requirements of a blazar candidate. This is further supported by the variability of the total flux density in its radio emission (Perger et al. 2024). To address the possible blazar nature of J1718+4239, we analysed its radio emission based on data from archival kiloparsec-scale flux density measurements and based on VLBI observations that were conducted for the first time. VLBI can provide the ultimate evidence for the high brightness-temperature jet emission that is characteristic of blazars through its high-resolution imaging capability.
Throughout the paper, we considered a standard Λ cold dark matter cosmological model, with H0 = 67.3 km s−1 Mpc−1, ΩM = 0.315, and ΩΛ = 0.685 (Planck Collaboration XVI 2014). At the spectroscopic redshift of J1718+4239 (z = 2.68), an angular distance of 1 mas corresponds to a projected linear size of 8.146 pc (Wright 2006).
2. Observations and data reduction
To uncover the parsec-scale structure and physical properties of J1718+4239, we conducted phase-referencing VLBI observations with the U.S. Very Long Baseline Array (VLBA; project code: BP268, PI: K. Perger). The two-hour observational run was carried out on 2024 August 4 in dual-band mode between 4 and 7 GHz. Only eight out of the ten VLBA stations (Napier et al. 1994) participated because Los Alamos and Kitt Peak were unable to observe due to hardware issues. The data were recorded at a rate of 4096 Mbit s−1 with a 2 s integration time in left and right circular polarizations, and they were correlated at the VLBA DiFX correlator (Deller et al. 2011). Four individual intermediate-frequency (IF) channels were used in dual-band setup, centred around 4.5 and 6.7 GHz in pairs. A total bandwidth of 128 MHz per polarisation was used with 128 spectral channels in each IF. The on-source times were 69 min, 25 min, and 9 min for the target (J1718+4239), the phase-reference calibrator (J1709+4318, at  angular separation from the target), and the fringe-finder (J1717+4530) sources, respectively.
The amplitudes and phases of the visibility data were calibrated with the National Radio Astronomy Observatory (NRAO) Astronomical Image Processing System (AIPS, e.g. Diamond 1995; Greisen 2003) package following the standard VLBA calibration guidelines. Two individual sets of data were prepared during the fringe-fitting step. Set A was acquired by interpolating fringe-fit solutions obtained for the phase-reference source (J1709+4318) to the target (J1718+4239) data, and set B was produced by performing the fringe fitting directly on the target source data. The two calibrated data sets were exported into UVFITS format for further analysis in the DIFMAP package (Shepherd 1997), with two sub-sets in each for IFs 1 − 2 (central frequency 4.5 GHz) and 3 − 4 (central frequency 6.7 GHz). We performed imaging and phase and amplitude self-calibration cycles through hybrid mapping using the CLEAN deconvolution algorithm (Högbom 1974). To quantitatively characterise the brightness distribution of the quasar, circular Gaussian model components were fitted to the self-calibrated visibility data (Pearson 1995). We calculated the uncertainties for the fitted model parameters following Lee et al. (2008), considering an additional flux density calibration error of 5%. As the target source was found to be bright enough for a direct fringe fitting, the physical parameters and other derived properties for J1718+4239 presented in this paper were acquired from the self-fringe-fitted data set (set B).
To characterise the radio spectrum and light curve of the quasar, we collected available flux density measurements from the literature. Detailed information on these data is given in Appendix A.
3. Results
The radio maps resulting from the imaging and the parameters of the fitted models are shown in Fig. 1 and are listed in Table 1. The source was detected as a bright compact feature with a north-east extension at both frequencies. Two model components were fitted to both data sets: a compact core, and a secondary jet component. They are marked c and j in Fig. 1 and in Table 1. The separation of the two components at both frequencies agree within the errors, which means that the identification of component j is reliable. We note that all fitted model component sizes exceed the minimum resolvable angular size (Kovalev et al. 2005) of the interferometer. We found spectral indices between 4.5 and 6.7 GHz of αc = 0.25 ± 0.08 and αj = −0.3 ± 0.4 for the core and jet components, respectively. The spectral index for the total integrated flux densities of the VLBI components is αVLBI = 0.24 ± 0.19. The flat spectrum of the source supports its classification as a blazar.
Parameters of the images and the Gaussian model components we fitted to the dual-frequency VLBA data of J1718+4239.
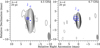 |
Fig. 1. Naturally weighted CLEAN maps of J1718+4239 at 4.5 GHz (IFs 1 − 2) and 6.7 GHz (IFs 3 − 4). The contours start at noise levels of ±3σ rms, and the positive contours increase by a factor of 2. The fitted Gaussian model components are shown with blue labels and crossed circles. The angular scaling at the redshift of the quasar (z = 2.68) is denoted in the top left corner, and the restoring beam is shown in the bottom right corner. The image parameters are listed in Table 1. |
The accurate coordinates of J1718+4239 were determined at 4.5 GHz as  (±0.2 mas) and
  (±0.9 mas). The position at 6.7 GHz agrees with the 4.5 GHz coordinates within the uncertainties.
4. Discussion
4.1. Variability in the flux density
The variable nature of the radio emission of the quasar at 1.4 and 3 GHz was briefly noted by Perger et al. (2024). With the newly available observational data of the third-epoch Very Large Array Sky Survey (VLASS, Gordon et al. 2020, 2021), the brightening following the neutrino event is even more pronounced, as illustrated in Fig. A.1. There is a clear brightening at 3 GHz, and the flux density increases by factors of 2 and 3 between the first epoch (2019) and later observations (2021 and 2024). The increase in the 3 GHz flux density might be connected to the neutrino event and the optical–γ-ray flaring detected from the AGN. Variability at 1.4 GHz is also visible in the angular resolution of the NRAO VLA Sky Survey (NVSS; 45′′, Condon et al. 1998), the Faint Images of the Radio Sky at Twenty-Centimeters survey (FIRST; 5′′, White et al. 1997), and the Rapid Australian Square Kilometre Array Pathfinder (ASKAP) Continuum Survey (RACS;  , Duchesne et al. 2024). The finer-resolution surveys show higher flux density values. The RACS observations were conducted just 8 days after the neutrino event IC-201221A on 2020 December 21, and when we assume that the NVSS flux density was measured when the source was in quiescence, it is possible that the brightening was temporally coincident with the neutrino event.
4.2. Compactness
The structure of the quasar J1718+4239 is known to be compact on arcsecond scales, as seen in the large radio surveys. At 1.4 GHz, the ratios of the peak intensity to the total flux density are 0.97 beam−1 and 0.94 beam−1 in the NVSS and FIRST surveys, respectively. Similarly, the 3 GHz VLASS data give compactness values of 0.90 beam−1 and 0.96 beam−1 for the first and third epoch, respectively. The compactness is somewhat lower in the second epoch (0.69). According to our observations, the quasar is also very compact at milliarcsecond scales. The ratio of the peak intensity to the total integrated flux density is CVLBI = 0.98 beam−1.
As the third-epoch VLASS measurements and our VLBA observations were carried out just 2 days apart (see Appendix A), the kiloparsec-to-parsec compactness of the quasar can be inferred without taking the variability into account. By extrapolating our 4.5 and 6.7 GHz measurements, we estimated the VLBI flux density at 3 GHz to be S3 GHz, VLBI = 77.3 ± 5.4 mJy, assuming the spectral index determined for the total integrated flux density of the parsec-scale structure to be αVLBI = 0.24 ± 0.19. Using this value, we estimated the flux density loss due to the resolution differences between the VLA and the VLBA. We derived a loss of only ≈15%.
4.3. Jet parameters
The brightness temperature of the core component was calculated following the equation (e.g. Condon et al. 1982)
 (1)
(1)
where S is the flux density measured in Jy, ϑ is the full width at half-maximum (FWHM) size of the component in mas, and ν is the observing frequency in GHz. We found values of Tb, 4.5 GHz = (5.7 ± 0.3)×1011 K and Tb, 6.7 GHz = (5.9 ± 0.4)×1011 K for the 4.5 and 6.7 GHz data sets, respectively (Table 1).
Assuming the equipartition brightness temperature Tb, int ≈ 5 × 10¹⁰ K (Readhead 1994) as the intrinsic value, we calculated the Doppler factors according to the relation of
 (2)
(2)
and we found values of δ4.5 GHz = 11.4 and δ6.7 GHz = 11.8 from the models based on the 4.5 and 6.7 GHz data sets, respectively.
Following the relations (Urry & Padovani 1995)
 (3)
(3)
we estimated the limiting values for the inclination angle, θ, and the bulk Lorentz factor, γ. This resulted in constraints of θ ≤ 5° and γ ≥ 6.
Our VLBI observations clearly indicate that J1718+4239 is a blazar whose relativistic jet points close to the line of sight, but our observations are certainly not suitable for deciding whether this blazar is the source of the IC-201221A neutrino event. We note that a recent population study of blazars associated with IceCube neutrino events found that their VLBI-determined Doppler factors (median value around 30) were higher and the jet inclination angles (median value around  ) lower than in other typical bright radio sources, however (Plavin et al. 2025). Based on the limits we derived for J1718+4239, this source would fit in this population. Multi-epoch VLBI monitoring observations in the coming years might help us to measure the apparent proper motion of the jet and to refine the jet parameters in J1718+4239.
5. Summary and conclusions
To reveal the nature of the radio AGN J1718+4239, which is a candidate object for an association with the IceCube neutrino event IC-201221A, we performed high-resolution VLBI observations in dual-band mode (4.5 and 6.7 GHz) with the VLBA for the first time. We also collected total flux density measurement data from various radio sky surveys at multiple frequencies from 0.144 to 8.4 GHz. The source is compact (C ≈ 1) on arcsecond and milliarcsecond angular scales, and it shows a significant flux density variability. On the milliarcsecond scale, we found that J1718+4239 has a compact core and a weak secondary jet component, which might allow studies of the apparent proper motion of the jet in the future. This blazar is sufficiently bright and compact for a direct fringe fitting, which makes it suitable as a phase-reference calibrator for VLBI observations of nearby weak radio sources. We derived its relative astrometric position with an accuracy on the submilliarcsecond scale. The core component has a flat spectrum, and its brightness temperature exceeds the equipartition limit (Tb ≈ 5 × 10¹⁰ K). Its Doppler factor is δ ≈ 12. The limiting values on the bulk Lorentz factor and the position angle were found to be γ ≥ 6 and θ ≤ 5°. They confirm that J1718+4239 is a blazar-type AGN.
6. Data availability
Raw VLBA data can be obtained from the NRAO archive1 under the project code BP268. The calibrated visibility data may be shared on reasonable request to the corresponding author.
Component catalogues are available at https://cirada.ca/vlasscatalogueql0
Acknowledgments
We thank the anonymous reviewer for their constructive suggestions to improve our manuscript. The National Radio Astronomy Observatory is a facility of the National Science Foundation operated under cooperative agreement by Associated Universities, Inc. CIRADA is funded by a grant from the Canada Foundation for Innovation 2017 Innovation Fund (Project 35999), as well as by the Provinces of Ontario, British Columbia, Alberta, Manitoba and Quebec. This work made use of the DiFX software correlator developed at Swinburne University of Technology as part of the Australian Major National Research Facilities program. We thank the Hungarian National Research, Development and Innovation Office (NKFIH, grant OTKA K134213) for support. This research was also supported by HUN-REN and the NKFIH excellence grant TKP2021-NKTA-64. E.K. acknowledges support from the German Science Foundation DFG, via the Collaborative Research Center SFB1491: Cosmic Interacting Matters – from Source to Signal (grant no. 445052434).
References
- Abbasi, R., Ackermann, M., Adams, J., et al. 2023, ApJ, 953, 160 [Google Scholar]
- Abdollahi, S., Ackermann, M., Ajello, M., et al. 2017, ApJ, 846, 34 [NASA ADS] [CrossRef] [Google Scholar]
- Ackermann, M., Ajello, M., Albert, A., et al. 2015, ApJ, 813, L41 [NASA ADS] [CrossRef] [Google Scholar]
- Aguilar-Ruiz, E., Fraija, N., Joshi, J. C., Galvan-Gamez, A., & de Diego, J. A. 2021, Phys. Rev. D, 104, 083013 [Google Scholar]
- Anchordoqui, L. A., & Torres, D. F. 2020, Phys. Rev. D, 102, 023034 [Google Scholar]
- Ansoldi, S., Antonelli, L. A., Arcaro, C., et al. 2018, ApJ, 863, L10 [Google Scholar]
- Banik, P., & Ghosh, S. K. 2022, ApJ, 931, L30 [Google Scholar]
- Bednarek, W., & Śmiałkowski, A. 2022, MNRAS, 511, 3339 [NASA ADS] [CrossRef] [Google Scholar]
- Bednarek, W., Burgio, G. F., & Montaruli, T. 2005, New Astron. Rev., 49, 1 [CrossRef] [Google Scholar]
- Bhatta, G., Mohorian, M., & Bilinsky, I. 2018, A&A, 619, A93 [NASA ADS] [CrossRef] [EDP Sciences] [Google Scholar]
- Bhattacharya, A., Enberg, R., Reno, M. H., & Sarcevic, I. 2015, JCAP, 2015, 034 [CrossRef] [Google Scholar]
- Blinov, D., & Novikova, P. 2025, A&A, 694, L10 [NASA ADS] [CrossRef] [EDP Sciences] [Google Scholar]
- Condon, J. J., Condon, M. A., Gisler, G., & Puschell, J. J. 1982, ApJ, 252, 102 [Google Scholar]
- Condon, J. J., Cotton, W. D., Greisen, E. W., et al. 1998, AJ, 115, 1693 [Google Scholar]
- de Gouveia Dal Pino, E. M., Rodríguez-Ramírez, J. C., & del Valle, M. V. 2025, MNRAS, 537, 3895 [Google Scholar]
- Deller, A. T., Brisken, W. F., Phillips, C. J., et al. 2011, PASP, 123, 275 [Google Scholar]
- Diamond, P. J. 1995, ASP Conf. Ser., 82, 227 [NASA ADS] [Google Scholar]
- Duchesne, S. W., Grundy, J. A., Heald, G. H., et al. 2024, PASA, 41, e003 [NASA ADS] [CrossRef] [Google Scholar]
- Ghisellini, G., Tavecchio, F., & Ghirlanda, G. 2009, MNRAS, 399, 2041 [CrossRef] [Google Scholar]
- Ghisellini, G., Haardt, F., Ciardi, B., et al. 2015, MNRAS, 452, 3457 [Google Scholar]
- Gordon, Y. A., Boyce, M. M., O’Dea, C. P., et al. 2020, Res. Notes Am. Astron. Soc., 4, 175 [Google Scholar]
- Gordon, Y. A., Boyce, M. M., O’Dea, C. P., et al. 2021, ApJS, 255, 30 [NASA ADS] [CrossRef] [Google Scholar]
- Gregory, P. C., Scott, W. K., Douglas, K., & Condon, J. J. 1996, ApJS, 103, 427 [NASA ADS] [CrossRef] [Google Scholar]
- Greisen, E. W. 2003, Astrophys. Space Sci. Libr., 285, 109 [NASA ADS] [Google Scholar]
- He, H.-N., Kusenko, A., Nagataki, S., Fan, Y.-Z., & Wei, D.-M. 2018, ApJ, 856, 119 [NASA ADS] [CrossRef] [Google Scholar]
- Högbom, J. A. 1974, A&AS, 15, 417 [Google Scholar]
- Hsu, P.-C., Koay, J. Y., Matsushita, S., et al. 2023, MNRAS, 525, 5105 [Google Scholar]
- IceCube Collaboration (Aartsen, M. G., et al.) 2018a, Science, 361, eaat1378 [NASA ADS] [Google Scholar]
- IceCube Collaboration (Aartsen, M. G., et al.) 2018b, Science, 361, 147 [NASA ADS] [Google Scholar]
- IceCube Collaboration (Abbasi, R., et al.) 2022, Science, 378, 538 [CrossRef] [PubMed] [Google Scholar]
- IceCube Collaboration (Abbasi, R., et al.) 2023, Science, 380, 1338 [NASA ADS] [CrossRef] [Google Scholar]
- Jackson, N., Battye, R. A., Browne, I. W. A., et al. 2007, MNRAS, 376, 371 [Google Scholar]
- Jauncey, D. L., Koay, J. Y., Bignall, H., et al. 2020, Adv. Space Res., 65, 756 [NASA ADS] [CrossRef] [Google Scholar]
- Ji, S., & Wang, Z. 2024, ApJ, 975, L30 [Google Scholar]
- Ji, S., Wang, Z., & Zheng, D. 2025, ApJ, 979, 1 [Google Scholar]
- Jiang, N., Zhou, H.-Y., Ho, L. C., et al. 2012, ApJ, 759, L31 [NASA ADS] [CrossRef] [Google Scholar]
- Jiang, X., Liao, N.-H., Wang, Y.-B., et al. 2024, ApJ, 965, L2 [Google Scholar]
- Kantzas, D., & Calore, F. 2024, A&A, 690, A87 [NASA ADS] [CrossRef] [EDP Sciences] [Google Scholar]
- Kellermann, K. I., Sramek, R., Schmidt, M., Shaffer, D. B., & Green, R. 1989, AJ, 98, 1195 [Google Scholar]
- Kőmíves, J., Gabányi, K. É., Frey, S., & Kun, E. 2024, Universe, 10, 78 [Google Scholar]
- Kovalev, Y. Y., Kellermann, K. I., Lister, M. L., et al. 2005, AJ, 130, 2473 [Google Scholar]
- Kun, E., Bartos, I., Tjus, J. B., et al. 2024, Phys. Rev. D, 110, 123014 [Google Scholar]
- Lee, S.-S., Lobanov, A. P., Krichbaum, T. P., et al. 2008, AJ, 136, 159 [Google Scholar]
- Li, H. Z., Jiang, Y. G., Yi, T. F., et al. 2018, Ap&SS, 363, 45 [NASA ADS] [CrossRef] [Google Scholar]
- Liodakis, I., Romani, R. W., Filippenko, A. V., Kocevski, D., & Zheng, W. 2019, ApJ, 880, 32 [NASA ADS] [CrossRef] [Google Scholar]
- Lister, M. L., Homan, D. C., Hovatta, T., et al. 2019, ApJ, 874, 43 [NASA ADS] [CrossRef] [Google Scholar]
- Marchesini, E. J., Andruchow, I., Cellone, S. A., et al. 2016, A&A, 591, A21 [NASA ADS] [CrossRef] [EDP Sciences] [Google Scholar]
- Mundo, S. A., & Mushotzky, R. 2023, MNRAS, 526, 4040 [Google Scholar]
- Myers, S. T., Jackson, N. J., Browne, I. W. A., et al. 2003, MNRAS, 341, 1 [Google Scholar]
- Napier, P. J., Bagri, D. S., Clark, B. G., et al. 1994, IEEE Proc., 82, 658 [Google Scholar]
- Neronov, A., Savchenko, D., & Semikoz, D. V. 2024, Phys. Rev. Lett., 132, 101002 [NASA ADS] [CrossRef] [Google Scholar]
- Neustadt, J. M. M., Hinkle, J. T., Kochanek, C. S., et al. 2023, MNRAS, 521, 3810 [NASA ADS] [CrossRef] [Google Scholar]
- Novikova, P., Shishkina, E., & Blinov, D. 2023, MNRAS, 526, 347 [NASA ADS] [CrossRef] [Google Scholar]
- Olmo-García, A., Paliya, V. S., Álvarez Crespo, N., et al. 2022, MNRAS, 516, 5702 [CrossRef] [Google Scholar]
- Omeliukh, A., Garrappa, S., Fallah Ramazani, V., et al. 2025, A&A, 695, A266 [NASA ADS] [CrossRef] [EDP Sciences] [Google Scholar]
- Padovani, P. 2017, Nat. Astron., 1, 0194 [Google Scholar]
- Padovani, P., Boccardi, B., Falomo, R., & Giommi, P. 2022, MNRAS, 511, 4697 [CrossRef] [Google Scholar]
- Pearson, T. J. 1995, ASP Conf. Ser., 82, 267 [NASA ADS] [Google Scholar]
- Peñil, P., Westernacher-Schneider, J. R., Ajello, M., et al. 2024, MNRAS, 527, 10168 [Google Scholar]
- Perger, K., Frey, S., Schwartz, D. A., et al. 2021, ApJ, 915, 98 [Google Scholar]
- Perger, K., Frey, S., & Gabányi, K. É. 2023, Ap&SS, 368, 18 [Google Scholar]
- Perger, K., Frey, S., Gabányi, K. É., & Kun, E. 2024, Res. Notes Am. Astron. Soc., 8, 44 [Google Scholar]
- Planck Collaboration XVI. 2014, A&A, 571, A16 [NASA ADS] [CrossRef] [EDP Sciences] [Google Scholar]
- Plavin, A. V., Kovalev, Y. Y., Kovalev, Y. A., & Troitsky, S. V. 2023, MNRAS, 523, 1799 [NASA ADS] [CrossRef] [Google Scholar]
- Plavin, A. V., Kovalev, Y. Y., & Troitsky, S. V. 2025, ArXiv e-prints [arXiv:2503.08667] [Google Scholar]
- Readhead, A. C. S. 1994, ApJ, 426, 51 [Google Scholar]
- Reynoso, M. M., Romero, G. E., & Christiansen, H. R. 2008, MNRAS, 387, 1745 [NASA ADS] [CrossRef] [Google Scholar]
- Rodrigues, X., Garrappa, S., Gao, S., et al. 2021, ApJ, 912, 54 [NASA ADS] [CrossRef] [Google Scholar]
- Sbarrato, T., Ghisellini, G., Nardini, M., et al. 2013, MNRAS, 433, 2182 [NASA ADS] [CrossRef] [Google Scholar]
- Shepherd, M. C. 1997, ASP Conf. Ser., 125, 77 [Google Scholar]
- Shimwell, T. W., Hardcastle, M. J., Tasse, C., et al. 2022, A&A, 659, A1 [NASA ADS] [CrossRef] [EDP Sciences] [Google Scholar]
- Son, S., Kim, M., & Ho, L. C. 2022, ApJ, 927, 107 [NASA ADS] [CrossRef] [Google Scholar]
- Sumida, V. Y. D., Schutzer, A. d. A., Caproni, A., & Abraham, Z. 2022, MNRAS, 509, 1646 [Google Scholar]
- Tortosa, A., Ricci, C., Arévalo, P., et al. 2023, MNRAS, 526, 1687 [NASA ADS] [CrossRef] [Google Scholar]
- Urry, C. M., & Padovani, P. 1995, PASP, 107, 803 [NASA ADS] [CrossRef] [Google Scholar]
- White, R. L., Becker, R. H., Helfand, D. J., & Gregg, M. D. 1997, ApJ, 475, 479 [Google Scholar]
- Wright, E. L. 2006, PASP, 118, 1711 [NASA ADS] [CrossRef] [Google Scholar]
- Xie, G. Z., Li, K. H., Bai, J. M., et al. 2001, ApJ, 548, 200 [Google Scholar]
- Yang, Q.-R., Liu, R.-Y., & Wang, X.-Y. 2025, ApJ, 980, 255 [Google Scholar]
Appendix A: Radio flux densities
We collected data from the Low-Frequency Array (LOFAR) Two-metre Sky Survey second data release (LoTSS DR2, Shimwell et al. 2022) at 144 MHz, the NRAO VLA Sky Survey (NVSS, Condon et al. 1998), the Faint Images of the Radio Sky at Twenty-Centimeters (FIRST, White et al. 1997) survey, and the Rapid Australian Square Kilometre Array Pathfinder (ASKAP) Continuum Survey (RACS, Duchesne et al. 2024) at 1.4 GHz, the Very Large Array Sky Survey (VLASS, Gordon et al. 2020, 2021) at 3 GHz, the Green Bank 4.85-GHz survey (GB6, Gregory et al. 1996), and the 8.4-GHz Cosmic Lens All-Sky Survey (CLASS, Jackson et al. 2007; Myers et al. 2003). We note that VLASS flux densities were collected from the third and second version ‘quick-look’ catalogues for the first and second epochs2, respectively. As, to date, no official catalogue was released for the third-epoch observations, the flux density value was obtained by fitting a Gaussian model component to the CLEAN image in AIPS using the IMFIT task. We note that, by chance, our VLBA observations (Sect. 2) were quasi-simultaneous with the third-epoch VLASS observations. Detailed information on the radio observations are listed in TableA.1 and illustrated in Fig. A.1.
Radio flux densities of J1718+4239 from the literature and our new VLBA observations.
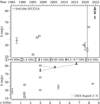 |
Fig. A.1. Radio light curve and radio spectrum of J1718+4239. The lower limits denote the VLBA flux densities. The archival observations at 0.144, 1.4, 3, 4.85, and 8.4 GHz frequencies are indicated with light grey diamonds, squares, circles, rectangles, and triangles, respectively. Our VLBA measurements at 4.5 and 6.7 GHz, and the estimated 3 GHz VLBI flux densities are denoted with dark grey rectangle and circle markers, respectively. The dashed line in the top panel marks the date of the neutrino event, while the dotted lines in the bottom panel highlight the flux densities from the coinciding VLA and VLBA observations. Detailed information is given in Table A.1. |
All Tables
Parameters of the images and the Gaussian model components we fitted to the dual-frequency VLBA data of J1718+4239.
Radio flux densities of J1718+4239 from the literature and our new VLBA observations.
All Figures
|
Fig. 1. Naturally weighted CLEAN maps of J1718+4239 at 4.5 GHz (IFs 1 − 2) and 6.7 GHz (IFs 3 − 4). The contours start at noise levels of ±3σ rms, and the positive contours increase by a factor of 2. The fitted Gaussian model components are shown with blue labels and crossed circles. The angular scaling at the redshift of the quasar (z = 2.68) is denoted in the top left corner, and the restoring beam is shown in the bottom right corner. The image parameters are listed in Table 1. |
| In the text | |
|
Fig. A.1. Radio light curve and radio spectrum of J1718+4239. The lower limits denote the VLBA flux densities. The archival observations at 0.144, 1.4, 3, 4.85, and 8.4 GHz frequencies are indicated with light grey diamonds, squares, circles, rectangles, and triangles, respectively. Our VLBA measurements at 4.5 and 6.7 GHz, and the estimated 3 GHz VLBI flux densities are denoted with dark grey rectangle and circle markers, respectively. The dashed line in the top panel marks the date of the neutrino event, while the dotted lines in the bottom panel highlight the flux densities from the coinciding VLA and VLBA observations. Detailed information is given in Table A.1. |
| In the text | |
Current usage metrics show cumulative count of Article Views (full-text article views including HTML views, PDF and ePub downloads, according to the available data) and Abstracts Views on Vision4Press platform.
Data correspond to usage on the plateform after 2015. The current usage metrics is available 48-96 hours after online publication and is updated daily on week days.
Initial download of the metrics may take a while.