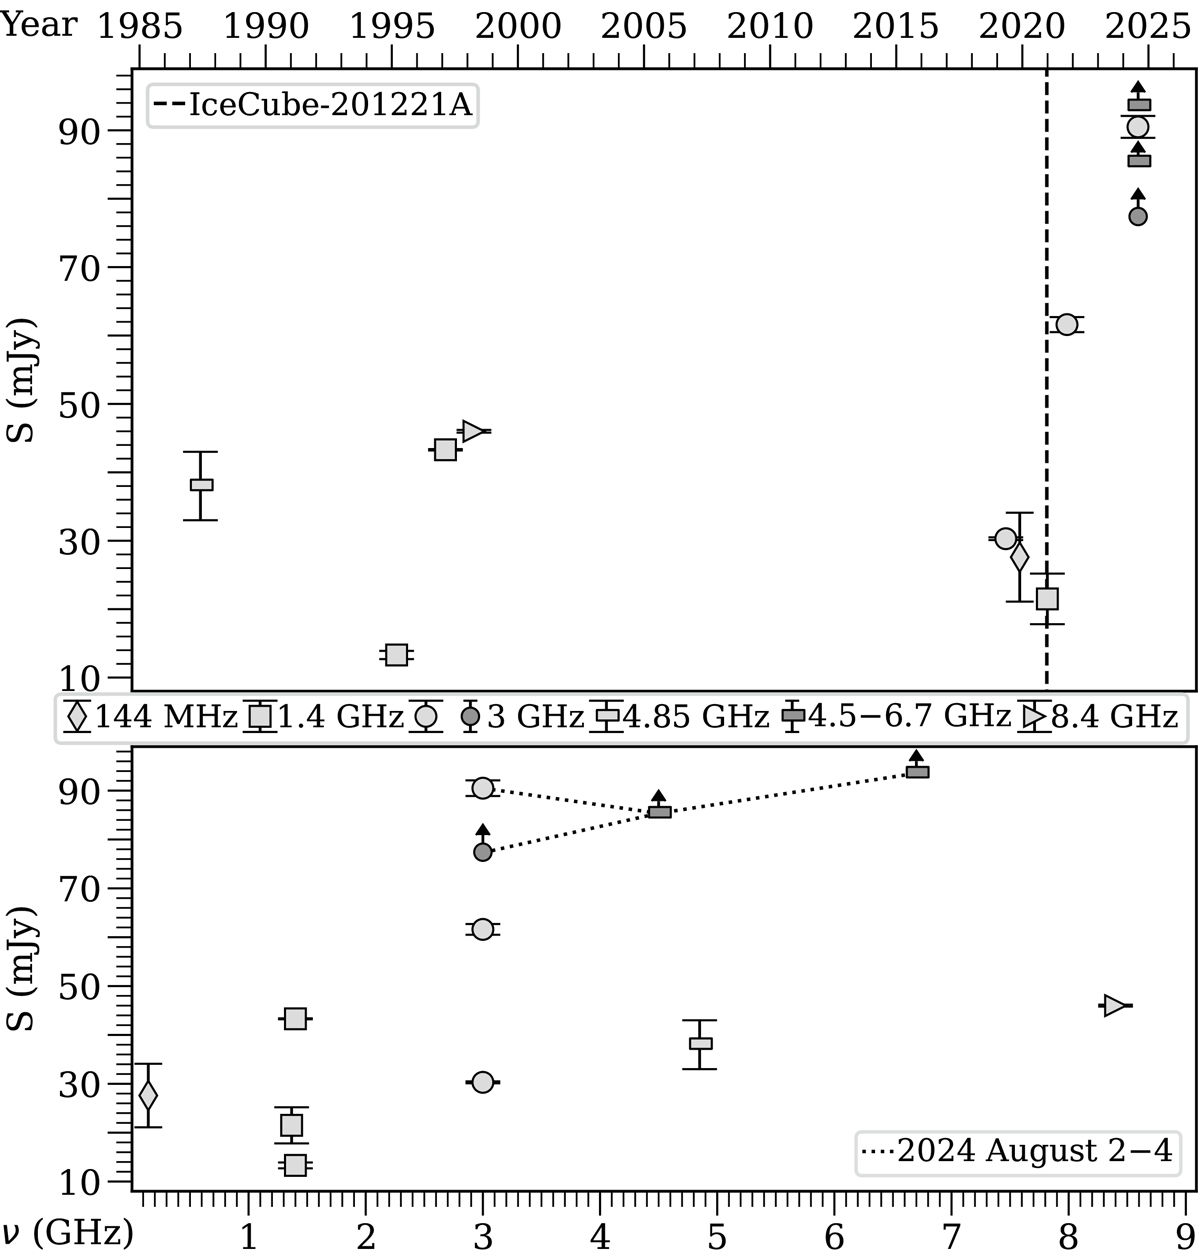
Fig. A.1.
Download original image
Radio light curve and radio spectrum of J1718+4239. The lower limits denote the VLBA flux densities. The archival observations at 0.144, 1.4, 3, 4.85, and 8.4 GHz frequencies are indicated with light grey diamonds, squares, circles, rectangles, and triangles, respectively. Our VLBA measurements at 4.5 and 6.7 GHz, and the estimated 3 GHz VLBI flux densities are denoted with dark grey rectangle and circle markers, respectively. The dashed line in the top panel marks the date of the neutrino event, while the dotted lines in the bottom panel highlight the flux densities from the coinciding VLA and VLBA observations. Detailed information is given in Table A.1.
Current usage metrics show cumulative count of Article Views (full-text article views including HTML views, PDF and ePub downloads, according to the available data) and Abstracts Views on Vision4Press platform.
Data correspond to usage on the plateform after 2015. The current usage metrics is available 48-96 hours after online publication and is updated daily on week days.
Initial download of the metrics may take a while.