Open Access
Fig. 9.
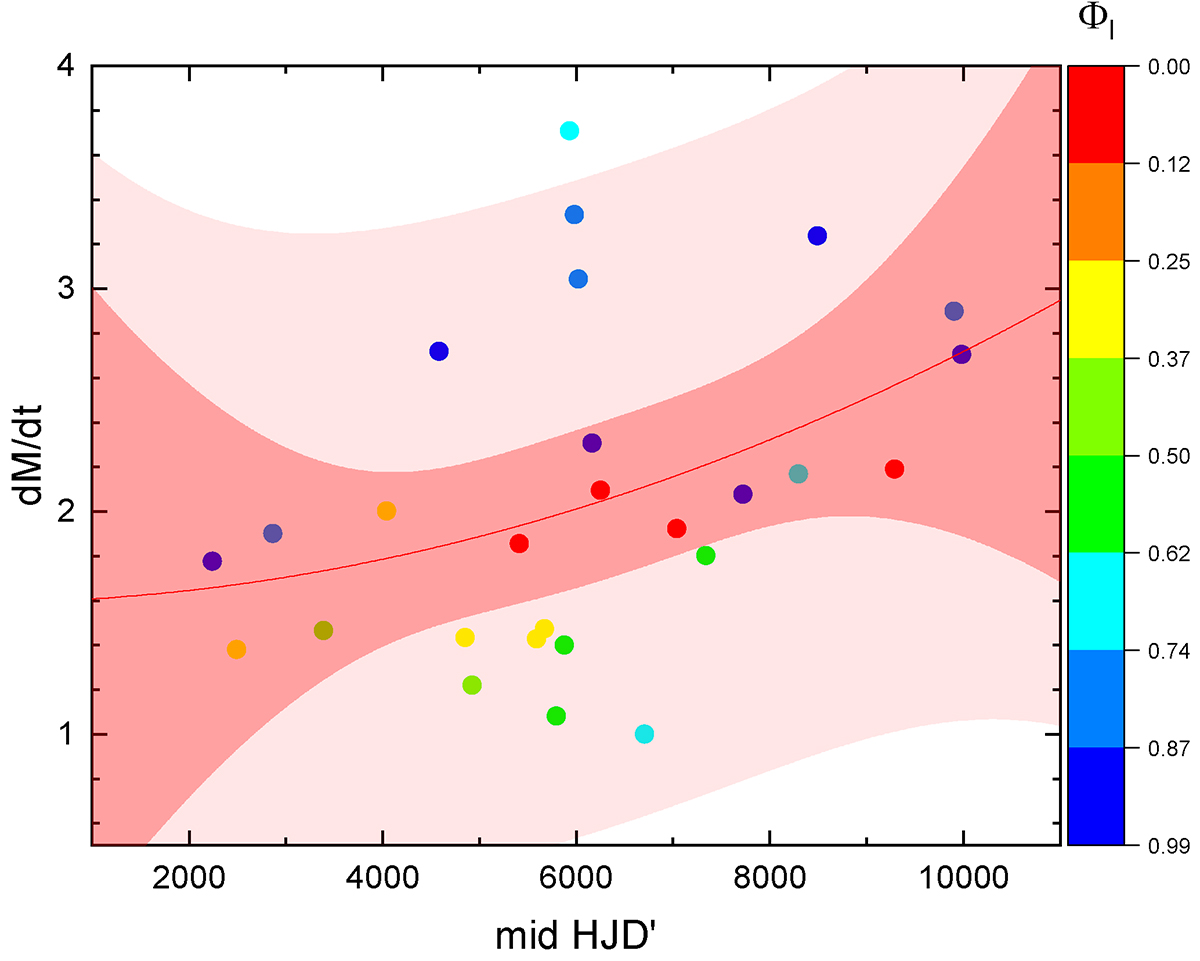
Download original image
Mass transfer rate versus the mid HJD′ given in Table 2 with colors indicating ranges of the long-term cycle phase. The best quadratic fit, y = (1.59055)+(5.948E-6)*x + (1.06792E-8)*x2 is shown, along with light and dark shaded regions indicating 95% prediction and confidence bands, respectively.
Current usage metrics show cumulative count of Article Views (full-text article views including HTML views, PDF and ePub downloads, according to the available data) and Abstracts Views on Vision4Press platform.
Data correspond to usage on the plateform after 2015. The current usage metrics is available 48-96 hours after online publication and is updated daily on week days.
Initial download of the metrics may take a while.